0DSSLQJDQGPRQLWRULQJRIEHQWKRV
LQWKH%DUHQWV6HDDQG6YDOEDUGZDWHUV
5HVXOWVIURPWKHMRLQW5XVVLDQ1RUZHJLDQ
EHQWKLFSURJUDPPH
%\
1$$QLVLPRYD//-¡UJHQVHQ3$/\XELQDQG,(0DQXVKLQ
This report should be cited as:
Anisimova, N.A., Jørgensen, L.L., Lyubin, P.A. and Manushin, I.E. 2010. Mapping and monitoring of benthos in the Barents Sea and Svalbard waters: Results from the joint Russian - Norwegian benthic programme 2006-2008. IMR-PINRO Joint Report Series 1-2010. ISSN 1502-8828. 114 pp.
Mapping and monitoring of benthos
in the Barents Sea and Svalbard waters:
Results from the joint Russian-Norwegian
benthic programme 2006-2008
N.A. Anisimova
1, L.L. Jørgensen
2, P.A. Lyubin
1and I.E. Manushin
11
Polar Research Institute of Marine Fisheries and Oceanography (PINRO) Murmansk, Russia
2
Institute of Marine Research (IMR) Tromsø, Norway
The detritus feeding sea cucumber Molpodia borealis taken as by-catch in bottom trawling and now ready to be weighed counted and measured. Photo: Lis Lindal Jørgensen
Contents
1 Introduction ... 5
2 Atlas of the macrobenthic species of the Barents Sea invertebrates ... 7
3 Benthic databases ... 11
4 The by-catch survey ... 17
4.1 Collection and processing methods ... 17
4.2 Results ... 19
4.2.1 Total number of species ... 19
4.2.2 Distribution of the total biomass and abundance ... 20
4.2.3 Distribution of main animal groups. ... 22
4.2.4 Community description ... 26
4.2.5 Monitoring areas and three years of recorded community dynamics of main groups and species... 48
4.2.6. Advice on the monitoring areas with regard to the human impact ... 50
5 Quantitative large-scale benthic survey of the Barents Sea 2003-2008 ... 55
5.1 Background ... 55
5.2 Material and methods ... 57
5.3 First results ... 58
5.3.1 Varangerfiord ... 58
5.3.2 The Motovsky Bay ... 65
5.3.3 Open waters of the southern Barents Sea ... 70
5.3.4 Comparative characteristic of the investigated areas ... 79
6 Future research ... 81
7 Acknowledgement ... 82
8 Reference list ... 82
Appendix I. Topographic map of the Barents Sea ... 85
Appendix 2. Taxonomic composition of macrobenthos from trawl and grab surveys ... 86
Appendix 3. Joint three-year programme (2006-2008) of IMR-PINRO for the research on benthos in the Barents Sea. ... 108
5
1 Introduction
By L.L. Jørgensen
This three-year project, supported by the Joint Norwegian-Russian Fishery Commission, is meant as a contribution to describe the status of the Barents Sea ecosystem with expected change under impact of the climate variability and human activities. As benthos is broadly accepted as environmental indicators, this report are also of interest for the the Joint Norwegian-Russian Commission for Environment. The report is designed as a contribution into the information basis for developing joint ecosystem-based management in the Barents Sea. Ecosystem-based management is a work in progress and should be considered as a process rather than an end state. Ecosystembased management plan for Norwegian waters in the area (the Integrated Management of the Marine Environment of the Barents Sea and the
Sea Areas off the Lofoten Islands: Rep No 8 to the Storting 2005-2006) is now adopted but the
analogous management plan for the Russian part is not yet developed.
Year 2007 marked the 50-year anniversary of a formal and active cooperation in marine research between the Institute of Marine Research (IMR) in Norway and the Polar Research Institute of Marine Fisheries and Oceanography (PINRO) in Russia. Whereas IMR has focused mainly on commercial species in the past, PINRO has also been working with benthic investigations for nearly a decade.
PINRO started the mapping of benthic fauna in the Southern and Eastern part of the Barents Sea in 1923. In 1968-1970, the entire Barents Sea was mapped with regard to the benthos, and this was done again in 2003-2008. PINRO holds therefore a long-term series of 85 years of monitoring the bottom fauna.
In 2005, the first joint benthic programme was established by IMR and PINRO at the
“Ecosystem Survey” covering the entire Barents Sea. The main idea behind the joint benthic
work was to establish a time and cost efficient “Long Term Monitoring Programme” for the
benthic component of the Barents Sea ecosystem. The by-catch of the scientific demersal fish trawling (Campelen trawl) on all participating IMR and PINRO research vessels was analysed and recorded in a standardized way, and all data were made available for both IMR and PINRO benthic experts and evaluated in annual meetings.
In 2007, PINRO and IMR agreed upon a three-year joint programme. Here it was decided to describe the project, the progress, and the results of the study on benthic communities in the Barents Sea. The mail goals were: 1) map the benthic species and communities, 2) to initiate the long term monitoring of potential changes in the benthic composition resulting from bottom trawling, climate change, invasive species (primarily the king crab) and effects from gas and oil activities, and 3) to give recommendations on how the benthic component of the ecosystem can be used in the management of the environment and living recourses of the Barents Sea.
6
During 2007-2009 it was decided to 1) finalise the re-sampling of the historical station grid of PINRO, 2) to assess all the invertebrate species caught in bottom fishing-trawling, and 3) to study the foraging behaviour of the king crab and its impact on native fauna.
The benthic community is a three-dimensional habitat consisting of infaunal species (i.e. inside the sediment), epifaunal species (on the sediment surface), and species swimming above the sediment (mobile megafauna). In order to obtain a detailed picture of the in- and epifauna, a quantitative 0.1m2 van-Veen grab is used. For the widely distributed, but often sparsely or aggregated large benthic species, a trawl has to be used. Combining both methods provides more information than using only one gear type. However, data of the two gear types can not be combined directly in order to obtain quantitative estimates, since trawl haul data are considered semi-quantitative (thus referred to as gross estimates), whereas vanVeen grab data are quantitative data.
Methods exist for the calculation of a catch-ability index for species occurring in both trawl and grab samples, but there are problems in using these indexes because of the different spatial scales addressed by the two sampling methods (sampling areas 0.1 m2 for the grab versus up to 18.000 m2 for the trawl). Since calculations can only be made for the large and sparsely distributed species sampled by both gear types, the accuracy of the calculations is
somewhat uncertain. Nevertheless, despite such direct incompatibility of “trawl” and “grab”
benthos data, it is important to use both gears in monitoring in order to sample the different components of the benthic communities. Using the trawl has, to a certain degree, the advantage of being more time- and cost-efficient than using the grab. Trawl samples produce a useful assessment of semi-quantitative estimates of the megafauna.
At present, the PINRO-IMR joint benthic research involves both types of sampling tools: 1) the classic benthic grab study (benthic surveys 2003-2008). which is the continuation of the long-term observations of major changes in the Barents Sea benthos, and 2) the trawl benthos study (by-catch in Campelen trawls). This opens up the prospect for operative monitoring in order to detect unpredicted changes in the benthic communities, and, as a second step, to initiate more detailed scientific research, which eventually should lead to management decisions.
The Barents Sea is strongly influenced by human activity; historically involving the fishing and hunting of marine mammals. More recently, human activities also involve transportation of goods, oil and gas, tourism, and aquaculture. Large-scale harvesting in the Barents Sea strongly impacts not only on the status of commercially important species, but also on the ecosystem as a whole. The impact of introduced and invasive species can be seen on a more localised scale.
The Barents Sea ecosystem is also strongly influenced by climatic conditions. Year-to-year variations in strength of Atlantic water inflow lead to adjustments in the ecosystem that affect production and the distribution of species. In the last years, there is an increasing interest in the evaluation of the most likely responses of the Barents Sea ecosystem to future climatic
7
change. Anthropogenic warming is projected to lead to increased air and sea temperatures globally, with the highest increases in air temperature in the Arctic and Sub arctic regions. Climatic conditions effect primary production and feeding conditions for fish and invertebrates, as well as survival of their offspring. Inter-specific trophic relations are another key factor influencing the abundance and population dynamics of species.
2
Atlas of the macrobenthic species of the Barents Sea invertebrates
By P.A. Lyubin
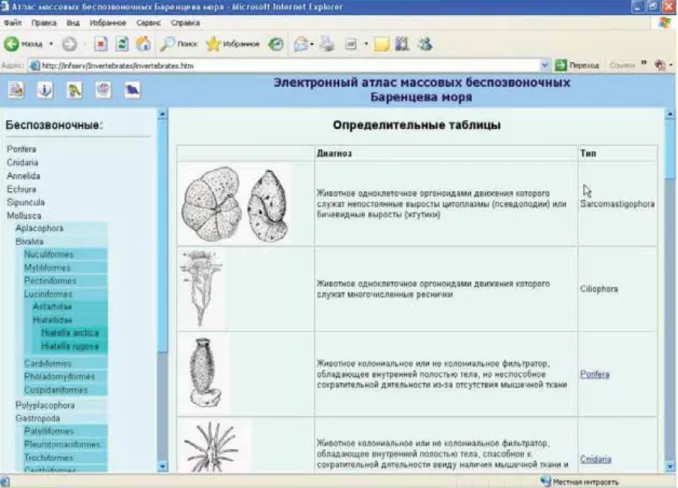
For the use of the Russian-Norwegian ecosystem surveys, an electronic atlas, containing information about dominant invertebrate species in the Barents Sea, was created in order to standardize naming of species obtained from by-catches of macrobenthos. Images of bottom by-catch invertebrates taken during ichthyologic research were used in the atlas. The taxonomy of each species, their ecology and distribution are described in the atlas in accordance to original data and references. This background information was generated in the database using Microsoft Access 2002. To update the atlas automatically and create a web application, Macromedia Dreamweaver MX was used. This generates auxiliary programmes written in the Visual Basic programming language using the Active Server Pages (ASP) technology.
The structure of the electronic atlas represents six blocks which are linked to each other:
“Main menu”, “Express key”, “Systematic key”, “Catalogue of taxonomical groups”,
“Description of species”, “Bibliographic Data” (Figure 2.1). Entrance to the electronic atlas is
conducted via the “main menu” (Figure 2.2). Four options of the actions to be carried out are
then suggested:
search for information on a particular (discrete) species; go to the taxonomic group required;
identify an organism using a picture;
identify an organism using a systematic character.
Main menu
Express key Taxonomical Taxonomical key
groups
Descriptions
of species Bibliographic
Data Figure 2.1. Structure of
8
Figure 2.2. Example of the initial menu of the electronic atlas.
A user can go to the main menu or to the parallel menu from each menu item dependent on the search results (Figure 2.3). If there is no information available on a taxonomic group or species, the user is referred to a list of references on this issue (planned in the second version).
9
The result page gives information on each species containing an image of a typical individual, the taxonomical name, systematic position, morphological description using illustrative material, a map of distribution in the Northern hemisphere and a description of the ecological features (Figure 2.4).
Figure 2.4. Example of result page for a particular species.
The ''Picture-keys'' are used to identify organisms following systematic characters. Such method has been applied traditionally in systematics and is the most accurate one to identify the systematic status of an organism. However, a method of dichotomous written keys (based on key couplets) is very inconvenient for algorithm elaboration if a number of taxonomic units to be used in the atlas (which is still in development) are unknown. The editing of such characters in the Atlas requires a software programme and is labour-intensive. For this reason a polytomous key was chosen. Despite the fact that this type of key is rarely used by taxonomists, the successful use of polytomous keys in the identification of living organisms has been described (Cannon 1986).
The advantage of using a polytomous key is that multiple choices are offered at each step as compared to two choices in the dichotomous key. This type of key couplets is convenient to organize keys into a hierarchical tree of taxa. At the same time, a number of identification steps in the key are equal to a number of taxonomic ranks. The first step identifies the general type an organism belongs to (Table 2.1, Figure 2.5), in the second stage – its class and so forth up to species level.
10
Table 2.1. Example of table for identification of a type of animal.
Diagnosis Type
A colonial or non-colonial animal, a filter-feeder with internal body cavity but incapable of contractive activity because of absence of muscular tissue
Porifera
A colonial or non-colonial animal, a filter-feeder with body cavity and capable of contractive activity as it has muscular tissue and thread-cells
Cnidaria
An animal with segmented body and joint extremities Arthropoda
An animal with soft body consisting of a head, trunk and muscular foot which has or does not have an external or internal shell
Mollusca
An animal with bivalve shell, abdominal valve forms a
rostrum Brachiopoda
An animal with five-beam symmetry, its body is more
11
Figure 2.5. Example of key-table for identification of the type of animal.
At present there are 24 keys to identify faunal types, 10 keys to identify classes, 20 keys for orders, 29 keys for genera, 31 keys for families and 24 keys for species. At the beginning of 2009 information on 37 benthic invertebrate species occurring frequently in the Barents Sea is incorporated in the Electronic Atlas.
3 Benthic
databases
By P.A. Lyubin
Modern and large-scale research cannot function without laborious mathematical and statistical methods of data processing. Thus, it is vital to implement databases and their management systems in such research projects. Extended databases are created during the joint PINRO and IMR benthic researches in the Barents Sea where we find up to 50 species (on average) of benthic invertebrates belonging to more than 10 animal types in each bottom sample (0.1 m2). Since five replicate samples are taken per station the species inventory for each station can contain up to 150 species on average. For the assessing of bottom assemblages it is essential to not only take into account density and biomass of each sampled species but also the reliability of findings, biogeographically characteristics of each taxon, its life form and feeding behaviour. Thus the preparation of data for further use in, e.g., theoretical models, is labour-intensive. In this context, an information database, adapted for
12
storag and processing of information on benthic invertebrates was created in 2004 in the Laboratory of Commercial Invertebrates (PINRO). By now this database works successfully and is continuously developed further. Microsoft Access 2002 was chosen as software environment for the database.
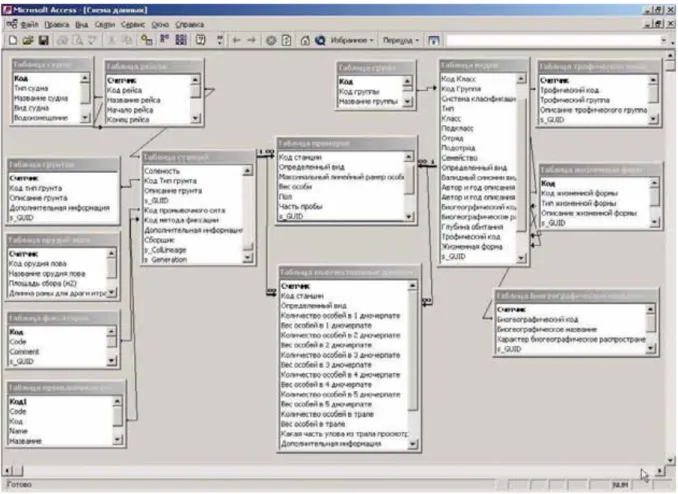
Currently, the benthic database used during joint investigation consists of three major blocks (Figure 3.1):
cruise and station information storage;
quantitative and biological information storage;
storage of information on taxonomy, biology and ecology of species.
Cruise and station data Quantitative data Information on taxonomy, biology and ecology of species
The first block contains basic expedition information and consists of 7 tables (Figure 3.2).
The main table in this block is the “Station Table” containing station data: date and time of
station beginning and end, coordinates, area of samples collection, depth, bottom temperature and salinity, sediment description, gear used, catch description, method of sample processing and fixation, name of person(s) processing the sample and entering data. Each station has a unique identifier which consists of cruise code and station number. Thus, stations collected in
one cruise are united under a cruise code. The “Table of cruises” contains cruise data: cruise
dates, vessel characteristics, data on cruise managers, etc. Apart from the mentioned tables, this block contains additional tables with data on equipment used, description of sea bottom, research areas, data on vessels, and personnel processing the samples.
The block with systematic information contains data on invertebrates inhabiting the Barents,
Kara and White Seas and other regions of the Arctic and the Atlantic. The “Table of species”
is the main table of this block. Taxonomy, biogeographical, trophic and ecological characteristics are presented for each species along with their valid synonyms. Another important additional table is the “Table of synonyms” which is directly connected to the “Table of species”. This table contains old and new names, invalid species synonyms used by
experts to specify organisms and their connection to valid name of the species. Apart from this table there are some other additional tables that decipher code names used to describe biology of the species and its systematic location.
The last of the three blocks contains quantitative information and is linked to the other two
blocks. This block consists of two tables. The first, “Table of quantitative data”, contains
quantitative data by species per station: abundance and biomass of species per sample. The second table contains the biological data (body length in mm; specimen's biomass in gram;
Figure 3.1. Circuit diagram of the PINRO benthic database structure.
13
organism's sex; maturity stage, etc). Both tables are connected to the tables “Station Table”
and “Table of synonyms”.
Figure 3.2. Chart of tables and links in the benthic database made in Microsoft Access 2002.
User surface, queries and macros in the database facilitate simple data entry and information retrieval (Figure 3.3).
Thus this database is one single (unified) complex of tables, user interfaces (forms), queries and macro instructions connected to each other that simplify the use of the base and allow rapid obtaining of information necessary for the analyses of benthic communities.
At the present, the database is transformed into a data storage system based on Visual FoxPro (V7.0). This will allow correlating benthic data to the ichthyologic database ‘BioFox’ and to
the fisheries- biological database of cruise information on the PINRO server. Call cruises numbers are defined by vessels register, handbooks of biological and hydrological information of PINRO cruises. Tables of supplemental information are being created based on the block of systematic information and are entered into the linked software on benthic data base processing
.
14
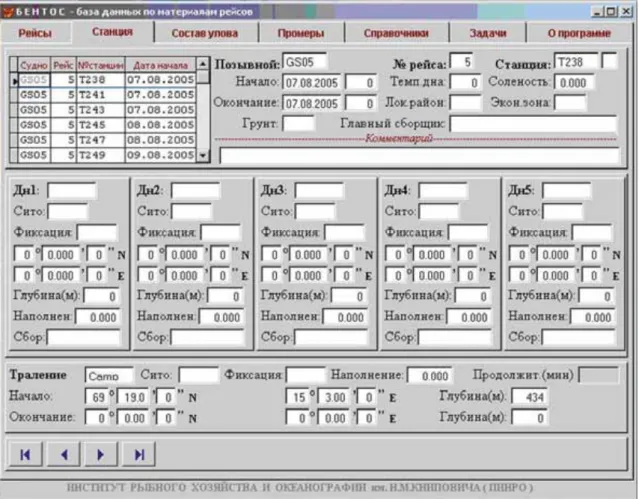
Figure 3.3. View of the “Station Table” in Microsoft Access 2002.
A user-friendly interface (Figure 3.4) was developed for easy use of the database.
The form “Table of species information” consists of three interdependent entry fields (Figure
3.5). A list of chosen cruise stations with brief information concerning the date of stations, coordinates and name of the responsiblecollector is situated at the top of the form. A station-specific species list and the quantitative information on trawl catches is located at the bottom left part of the form. The results of each grab are located at the right bottom part of the form.
15
Figure 3.4. User-friendly interface for entering station information based on Visual FoxPro (V7.0).
Figure 3.5. Interactive form for entering and editing quantitative information on species based on Visual FoxPro (V7.0).
16
The form for entering data of morphometric data as well as the form of information on species' biology consists of a top field with the list of chosen stations and a bottom field to enter survey data (Figure 3.6). The bottom field includes the species name, its maximum size and weight, and its proportion of the catch. There is a special column for comments.
Figure 3.6. Interactive form for entering and editing morphometry data based on Visual FoxPro (V7.0).
The information block contains description of the general chart and page frames of the programme. Descriptions are provided on how to enter data, use control keys functions and other supplemental information.
Currently the benthic database contains information on 38 cruises and 3825 stations, 173606 units of quantitative information, 7139 units of morphometric information, data on systematic location, ecology and biology of 2946 benthic invertebrate taxa, 2134 of which are on species level.
17
4 The
by-catch
survey
4.1 Collection and processing methods
By L.L. Jørgensen
Fieldwork was carried out from August to September 2006, 2007, and 2008 using the Russian research vessels Fridtjof Nansen (2006), Smolensk (2006 and 2007), Vilnus (2007 and 2008) and the Norwegian research vessels G.O. Sars, Jan Mayen and Johan Hjort (2006, 2007 and 2008).
Sampling on all vessels was carried out using a Campelen 1800 bottom trawl, which is constructed for catching benthic fish and the northern shrimp Pandalus borealis at andup to 3.5 - 4.2 m above the sea floor. However, a range of other benthic organisms are also
collected, and this “by-catch” makes up the material for the benthic part of the Benthic Long
Term Monitoring Programme described in this chapter. To achieve a constant “swept bottom
area” during each haul, the trawl door-spread was recorded continuously and the full spread of
the opening was maintained throughout each haul. The cross-section of the opening of the trawl bag, the Rockhopper bottom gear, which is in contact with the sea floor, is 13.5 m wide. The mesh size varies from the front part (60 mm) to the cod end (22 mm) of the bag. Therefore, for benthos larger than 40 mm, the effective catch width (cross-section) is calculated to be 11.7 m of the conical shaped trawl bag which is 44 m long (Figure 4.1).
Trawling was carried out at 3 knots with a bottom time of 15 minutes, resulting in an average sampling area of 17900±1320 m2, depending on wind and current conditions. There was no significant relationship between the amount of fish and shrimps collected in the trawl and the amount of benthos sampled (r2 = 0.06). Therefore fish and shrimps were excluded from subsequent analyses of the benthic fauna. Whereas the grab and box core methods used in traditional benthic sampling give quantitative abundance and biomass data per unit area sampled, data from trawl samples are semi-quantitative and are to be considered as gross estimates. However, when carried out consistently over a large number of stations, relative spatial and temporal patterns can be identified also from trawl samples.
This study uses data from 1682 sampling stations (Figure 4.1.2), covering an area of approximately 30 km2 (the total area of the Barents Sea is 1.4 mill km2).
Figure 4.1.1. Schematic drawing of Campelen 1800 bottom trawl with mesh sizes (MS) given for each of the three sections (22, 42 and 60 mm) of the 44 m long trawl bag, with an effective catch cross-section of 11.7 m.
18
Figure 4.1.2. The Barents Sea with the positions of Campelen trawl deployments where benthos has been
recorded annually from 2006-2008 by PINRO and IMR with the Norwegian R/V Jan Mayen (JM), G.O. Sars
(GS), Johan Hjort (JH) and the Russian R/V Vilnus (VI), Fridtjof Nansen (FN) and Smolensk (SM).
The fauna was identified to the lowest possible taxonomic level, enumerated and the wet-weight biomass recorded on all Russian expeditions, but only on those Norwegian expeditions with benthic experts onboard (G.O. Sars 2006-2008). During the remaining Norwegian expeditions (onboard Jan Mayen and Johan Hjort) the invertebrate fauna was grouped into large animal groups (Table 4.1.1), enumerated and the wet-weight biomass recorded. The data were stored electronically as a taxon-by-station matrix. Identification was largely carried out on board, with quality control and standardisation of taxon names provided during subsequent join PINRO-IMR workshop and meetings.
Olga strait Novaya Zemlya Bank Bear Island Hope Island Deep Goose Bank North Kanin Bank Tromso Plateau
Bear island Channel Spitsbergen Bank Central Bank Great (Perseus) Bank Murman Rise
19
Table 4.1.1. List of benthic faunal groups used for invertebrate component of Campelen trawl hauls onboard the Norwegian research vessel Jan Mayen and Johan Hjort annually from 2006-2008.
Porifera Sipunculida Mysida Brachyura Cephalopoda Holothuroidea
Hydroider Priapulida Cumacea Anomura Brachiopoda Ascidiacea
Alcyoniidae Nemertini Isopoda Polyplacophora Bryozoa Echinoidea
Actiniaria Echiura Amphipoda Bivalvia Crinoidea
Madreporia Pycnogonida Euphausiidae Scaphopoda Asteroidea
Polychaeta Cirripedia Natantia Gastropoda Ophiuroidea
4.2 Results
4.2.1 Total number of species
By I. E.Manushin
A total of 476 taxa of benthic invertebrates (337 of these at species level) related to 14 animal types, 28 classes, 79 orders and 190 families were recorded in by-catches of benthic trawls in the Barents Sea and the area round Svalbard from 2005 to 2008 (Appendix II Table 1). The largest number of taxa was found among molluscs, crustaceans (Arthropoda in Figure 4.2.1), coelenterates and echinoderms (Figure 4.2.1). It has to be noted that the number of identified taxa per group is not only dependent on the relative species richness of this particular group in the hauls, but also on the level of taxonomic expertise present on board during the surveys The total number of taxa registered per haul varied from 1 to 84 taxa with a mean of 16.0±0.3 taxa per a station.
According to the mean number of taxa identified per station all cruises can be divided into two groups: the number of taxa below the mean for all cruises and the number of taxa above the mean for all cruises (Figure 4.2.2). The first group includes cruises without participating benthic experts onboard, the other one, cruises with participating benthic experts. The total number of taxa identified per cruise is larger in the second group (Figure 4.2.3). Their mean number was 122±23 taxa. The only exception is the cruise of R/V G.O. Sars in 2008. According to the number of taxa per a station it can be included into the first group. But according to the total number of identified taxa it can be included into the second group. This can be explained by the fact that the experts only partly participated in this cruise.
Nemertini, 0,2% Echiura, 0,4% Sipuncula, 1,1% Brachiopoda, 0,8% Plathelminthes, 0,4% Porifera 7,4% Chordata 3,0% Echinodermata 14,0% Others 3,0% Arthropoda 15,5% Mollusca 27,8% Bryozoa 4,9% Cnidaria 14,0% Annelida 10,6%
Figure 4.2.1. Ratio of the species number of the main taxonomic group of benthic invertebrate in by-catch of trawls.
20 JM-2006 JH-2007 JM-2007 JH-2008 S-2006 JM-2008 JH-2006 GOS-2008 GOS-2006V-2008 V-2007 S-2007GOS-2007 FN-2005 F N-2006 S-2005 0 5 10 15 20 25 30 35 40 0 1 2 3 4 5 6 7 8 9 10 11 12 13 14 15 16 1
Order number of cruise
Nu m b e r o f ta x o n s p e r s ta tio n
Figure 4.2.2. The mean number of benthic invertebrate taxa per station obtained during different ecosystem surveys in 2005, 2006, 2007 and 2008. Red line indicates the cruises with the number of taxa per station below the mean, green line indicate cruises with the number of taxa per station above the mean. JM –Jan Mayen, JH – Johan Hjort, S –Smolensk, GOS –G.O. Sars, V –Vilnyus, FN –F. Nansen. All cruises were arranged according to increasing number of identified taxa per a station.
FN-2006 V-2007 FN-2005 GOS-2007 V-2008 GOS-2008 S-2007 GOS-2006 S-2005 S-2006 JH-2007 JH-2006 JH-2008 JM-2008 JM-2007 JM-2006 0 50 100 150 200 250 300 350 0 2 4 6 8 10 12 14 16 18
Order number of cruise
Nu m b e r o f ta x o n s pe r c ru is e
Figure 4.2.3. The mean number of taxa of benthic invertebrate taxa per station obtained during ecosystem surveys in 2005–2008. Conventions are the same as in Figure 4.2.2. All cruises were arranged according to increasing number of identified taxa per cruise.
4.2.2 Distribution of the total biomass and abundance
By L.L. Jørgensen and P.A. Lyubin
Benthos data derived from Campelen trawl hauls indicate that the biomass distribution of the benthos varies among areas (Figure 4.2.4). The biomass-“hotspots” are located in “shallow
water areas” such as the Tromsø Plateau (decreasing from year to year), on the Spitsbergen
Bank, Kanin Bank (increasing in 2006 and 2007, but then decreasing in 2008) south of Franz Joseph Land (increasing up to 2008) and east of Goose Bank (increasing from 2006 to 2007, and then decreasing on some of the stations in 2008).
21
Higher abundances were recorded at several stations north of 75°N. Most of such high abundances occurred in 2008. High abundance stations were also recorded east of 50°E and on the west coast of Svalbard. The abundance values are based on non-colonial taxa only since colonial taxa are usually not recorded.
A
B
Figur 4.2.4. Distribution of biomass (A) and abundance (B) of benthic invertebrates (excluding Pandalus borealis and pelagic invertebrates) taken annually from 2006 to 2008
(August-September) by campelen trawl from 1682 stations. Area covered per trawl haul estimated to be ~18.000 m2/per station.
22
4.2.3 Distribution of main animal groups.
By L.L.Jørgensen and P.A. Lyubin
Different animal groups dominate the biomass in different parts of the Barents Sea for all the investigated years. Porifera (sponges) make up the largest part of the communities in weight along the continental slope from Tromso Plateau and north along the west coast of Svalbard, north of Svalbard and east to Franz Joseph Land (Figures 4.2.5, 4.2.6, and 4.2.7). Porifera also seems to dominate the communities with respect to biomass north of the Finnmark coast including the Bear Island Channel. Molluscs (mainly bivalves and gastropods) dominate off-shore parts of south-western Barents Sea and partly the west coast of Svalbard. Echinoderms make up the main communities in the main part of the Barents Sea though crustaceans (excluding Pandalus borealis) dominate the south-eastern part of the sea. The red king crab
(Paralithodes camtschaticus) was found mainly on the Kanin Bank. The snow crab
(Chionoecetes opilio) was recorded for the first time close to northern Goose Bank in 2007
but also north and south of the Central Bank.
2006 Biomass
Figure 4.2.5. Distribution of main invertebrate groups in the Barents Sea in 2006 presented as % biomass per station. (Pandalus borealis, vertebrates and pelagic invertebrates excluded). The crustaceans are divided into snow crabs (Chionoecetes opilio) as “Crustacea S”, red king crabs (Paralithodes camtschaticus) as “Crustacea K” while all other crustaceans are “Crustacea”.
23 2007 Biomas 2008 Biomass Figure 4.2.6. Distribution of main invertebrate groups in the Barents Sea in 2007 presented as % biomass per station. (Pandalus borealis, vertebrates and pelagic invertebrates excluded). The crusta-ceans are divided into snow crabs ( Chiono-ecetes opilio) as “Crusta -cea S”, red king crabs (Paralithodes cam-tschaticus) as “Crustacea K” while all other crustaceans are “Crustacea”.
Figure 4.2.7.
Distribution of main invertebrate groups in the Barents Sea in 2008 presented as % biomass per station. (Pandalus borealis, vertebrates and pelagic invertebrates excluded). The crustac-eans are divided into snow crabs ( Chion-ecetes opilio) as “Crustacea S”, red king crabs (Paralithodes camtschaticus) as “Crustacea K” while all other crustaceans are “Crustacea”.
24
Sponges not only dominate the same western areas with respect to biomass, but also in abundance, although the number of individuals seems to decline from 2006 to 2008 (Figures 4.2.8, 4.2.9 and 4.2.10). Many species of sponges are difficult to enumerate due to their tendency to fragmentation. The number of individuals presented here might therefore be overestimated. In 2006, cnidarians (mainly sea anemones and soft corals) made up large part of the communities around Svalbard, but also of the offshore areas of the Finnmark coast. Similar to the sponges, the number seemed to decline with very low abundances in 2007 and 2008. Instead molluscs (west of Svalbard in 2007), crustaceans (north of Svalbard) and echinoderms (all around Svalbard in 2008) start to dominate the communities. Echinoderms make up the larges part of the communities in the main part of the Barents Sea though crustaceans seem to dominate more in the south eastern parts with the king crab dominating strongly on the Kanin Bank. However, in 2008 the number of individuals caught by the trawl was low.
Comparing figures 4.2.5, 4.4.2.6, 4.2.7 (biomass,) and 4.2.8, 4.2.9, 4.2.10 (number of individuals) reveal that many mainly large sponges dominate the south eastern parts of the Barents Sea and the west coast of Svalbard, but as the colonial specimens was not counted, the distribution in numbers of individuals are incorrect. Many, but with a rather low biomass, cnidarians are recorded off-shore from the Finnmark coast. Many large echinoderms make up the main part of the communities in the central and eastern part of the Barents Sea, while many and large crustaceans (especially king crabs) dominate the south eastern part of the Barents Sea. 2006 abundance Figure 4.2.8. Distribution in number of individuals of main invertebrate groups in the Barents Sea in 2006 given as % abundance per station. (Pandalus borealis, vertebrates and pelagic invertebrates excluded). The crustaceans are divided into snow crabs
(Chionoecetes opilio) as “Crustacea S”, red king crabs (Paralithodes camtschaticus) as “Crustacea K” while all other crustaceans are “Crustacea”.
25 2007 abundance 2008 Abundance Figure 4.2.9. Distribution in number of individuals of main invertebrate groups in the Barents Sea in 2007 given as % abundance per station. (Pandalus borealis, vertebrates and pelagic invertebrates excluded). The crustaceans are divided into snow crabs
(Chionoecetes opilio) as “Crustacea S”, red king crabs (Paralithodes camtschaticus) as “Crustacea K” while all other crustaceans are “Crustacea”.
Figure 4.2.10.
Distribution in number of individuals of main invertebrate groups in the Barents Sea in 2008 given as % abundance per station. (Pandalus borealis, vertebrates and pelagic invertebrates excluded). The crustaceans are divided into snow crabs
(Chionoecetes opilio) as “Crustacea S”, red king crabs (Paralithodes camtschaticus) as “Crustacea K” while all other crustaceans are “Crustacea”.
26
4.2.4 Community description
Description of the community distribution was made separately for north-western and south-eastern part of the Barents Sea (based on the Russian data) and for south-western and central part of the sea (based on the Norwegian data). In spite of some differences in the procedures of excretion and description of communities, the obtained results are commensurable and substantially supplement each other.
4.2.4.1 Distribution of the benthic communities in the south-eastern and north-western part of the Barents Sea
By N.A. Anisimova
The by-catch of 255 trawl hauls were identified to the lowest possible taxon. Such resolution made it possible to identify faunistic assemblages (benthic communities). These 255 stations were sampled during the cruises carried out by R/V Fridtjof Nansen in 2005 and 2006 and
R/V Vilnus in 2007.
Cluster analysis (using an average-weighted mean method) was employed in order to identify the faunistic assemblages. As a measure of similarity “quantitative Sorensen index” was used (Czeckanovski 1909, Andreev 1980) and the species/taxon biomass in the by-catches was used as the quantitative parameter.
Several indices have traditionally been used in Russia when describing bottom communities, analyzing community structure and assessing the importance of individual species. These indices link parameters such as the quantitative assessment of a species at a station (e.g., biomass) and frequency of occurrence within the area of community distribution (Anon 1939; Brotskaya & Zenkevich 1939, Zatsepin 1962).
In the present study ''index of importance'' of the species in the community, suggested by Zatsepin (1962), was used to describe the structure of singled-out assemblages. This index is calculated by the following formula:
) 100 ( 1 ( B b F I
where: F – frequency of the species occurrence within the range of singled-out community, %; b – the average biomass of the taxa/species at the stations where it was occurred, g/trawling; B – the average biomass of benthos within the community distribution area, g/trawling.
The given index does not differ significantly from the same one used by Brotskaya and Zenkevich for describen the bottom communities of the Barents Sea (Anon 1939, Brotskaya & Zenkevich 1939). However, in contrast to Brotskaja and Zenkevich index, it is not dimensionless and varies from 0 to 10 000. This allows this index to be used for comparative porposes.
27
When describing the identified faunistical assemblages the species with the highest index of importance were regarded as dominant, the species with the highest frequency of occurrence, independent of biomass and index of importance, were regarded as typical. The species with frequency of occurrence within the range of singled-out community less than 50 % were assessed as unimportant (inessential) and are not taken into account in description of the communities structure.
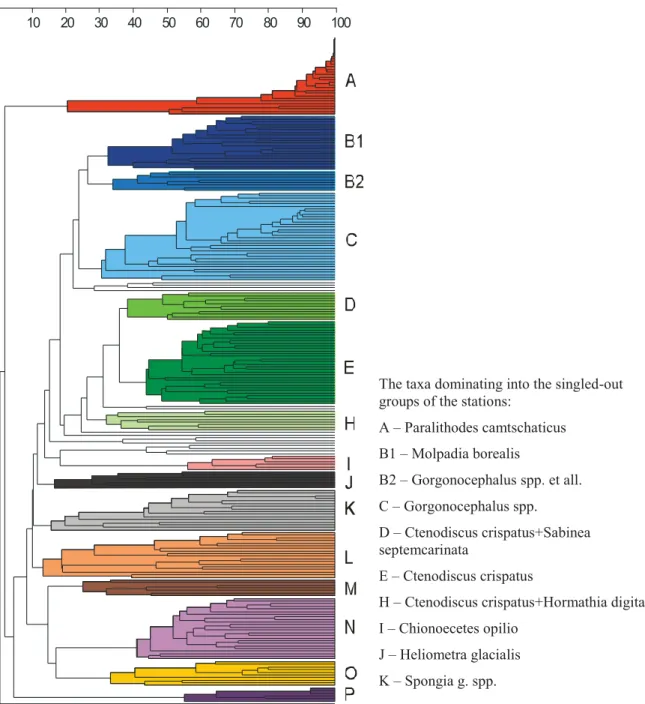
The cluster analysis identified the stations into 15 groups (Figure 4.2.11). These groups differs in both species composition and the species biomass ratio. Bottom inhabitants of each group of stations is regarded as a "faunistic assemblage". As used here these "faunistic assemblages" are similar, in a general sense, to the conception of "biocoenose'' or
''community''. This is because stations are combined as groups, not only on the basis of the
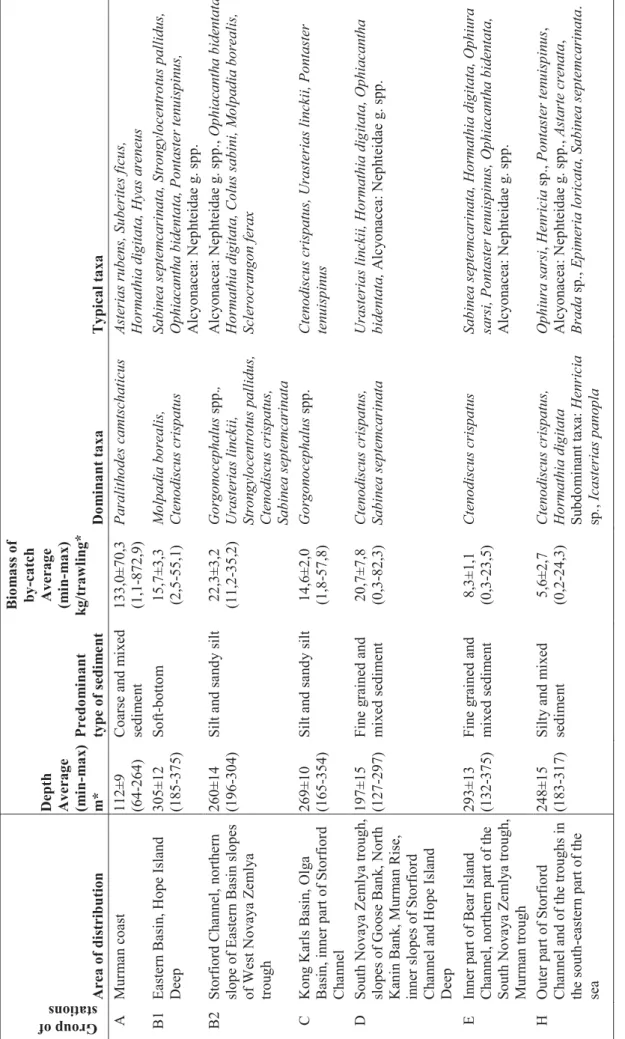
species composition similarity, but also on the structure of domination (the ratio of the taxa). The main features of the singled-out faunistic assemblages are given in Table 4.2.1.
The environmental conditions in any area influence strongly which feeding type(s) will be predominant in a faunal community. This allows the defined faunistic assemblages to be divided into three communities, each of which is characterized by a different feeding type:
Suspension feeders which occur in areas with active hydrodynamics.
Detritus feeders which occur in soft sediments rich in organic matter.
Carnivores.
The distributional patterns of these communities reflect the various habitats which are characterized by parameters such as, e.g., bottom topography, type of sediment, depth, locality of the main food availability.
28
0 10 20 30 40 50 60 70 80 90 100
Figure 4.2.11.Dendrogram of the station similarity by the invertebrates by-catches composition given as 15 (A-P) faunistic assemblages.
The taxa dominating into the singled-out groups of the stations:
А– Paralithodes camtschaticus B1 – Molpadia borealis B2 – Gorgonocephalus spp. et all. C – Gorgonocephalus spp. D – Ctenodiscus crispatus+Sabinea septemcarinata E – Ctenodiscus crispatus
H – Ctenodiscus crispatus+Hormathia digitata I – Chionoecetes opilio
J – Heliometra glacialis K – Spongia g. spp.
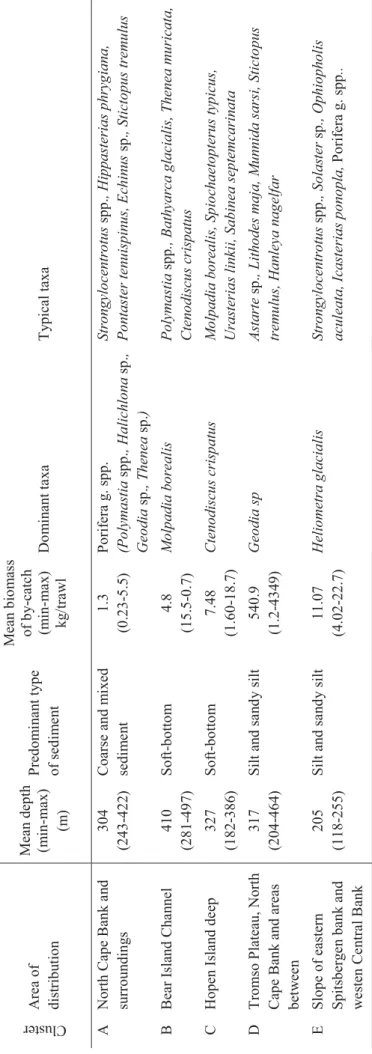
29 Table 4 .2.1 . T h e m ai n f eatu re s of th e fa u n istical a sse m b lage s si n g led ou t according to th e result s of clu ster anal y sis . Group of stations Area of dis
tribut ion Depth Average (m in -ma x ) m* Predo m inant type of sedi m e nt B io m a ss o f by -ca tch Average (min -ma x ) k g /tra w ling* Do m inant tax a Typical tax a А Mur m a n co ast 112± 9 (64-264) Coarse and m ix ed sed im e n t 133,0 ±70 ,3 (1,1-872, 9) Paralithodes ca mtsch aticus As teri as rubens , Suberit es ficu s, Horma thia digitata, Hy as aren eu s В1 Eastern B asi n , Hope Island Deep 305± 12 (185 -375 ) Sof t-botto m 15,7± 3,3 (2,5 -55,1 ) Molpadia b o rea lis, Cten odiscu s cris patu s Sabine a s eptemcar inata, Str o ngylocentr otus p a llidus, Ophiacanth a bid enta ta, Ponta ster tenuispinus , A lc y on acea: Nep h teidae g . sp p. В2 Storf iord Ch a n n el, n o rth ern slope of Eastern B asi n slopes of W est Nov a y a Z e m ly a trou gh 260± 14 (196 -304 ) Silt an d sa n d y silt 22,3± 3,2 (11,2 -35, 2) Gor gonocep halus spp. , Urasteria s linckii, Str ongy locentrotus p a llidus, Cten odiscu s cris patus, Sabine a s eptemcar inata A lc y on acea: Nep h teidae g . sp p. , Ophiac anth a bide ntata,
Hormathia digitata, Colus sab
ini, Molpadia borea lis, Sclerocrangon ferax С Ko n g Kar ls B asin , Ol g a B asin , inn er part of Storf iord Cha n nel 269± 10 (165 -354 ) Silt an d sa n d y silt 14,6± 2,0 (1,8 -57,8 ) Gor gonocep halus spp. Cten odiscu s cris patus, Uraste
rias linckii, Pontaster
tenuispinus D S o ut h N o va ya Ze ml ya t ro u gh, slopes o f Go ose B ank , No rth Kani n B ank, M u rm a n Rise, in n er slopes of Storf ior d Ch a n n el and Ho pe I sland Deep 197± 15 (127 -297 ) Fin e g rained and m ix ed s edim e n t 20,7± 7,8 (0,3 -82,3 ) Ctenodiscu s cris patus, Sabine a sep temcarinata Urasteria s linckii, Hormathi a dig itata, Ophiaca nt ha bidentata, A lc y o n acea: Nep h teidae g . spp. E In n er part of Bear Is lan d Cha n n el, n o rth er n part o f th e S o ut h N o va ya Ze ml ya t ro u gh, Mu rm a n troug h 293± 13 (132 -375 ) Fin e g rained and m ix ed s edim e n t 8,3±1 ,1 (0,3 -23,5 ) Ctenodiscu s cris patus Sabine a s eptemcar inata, Hor mathia digitata , Ophiur a
sarsi, Pontaster ten
uispinus, Ophiacanth a bid entata, A lc y on acea: Nep h teidae g . sp p. H Outer part o f Storf iord Ch a n n el and of t h e troug hs in th e south -eas tern part o f th e sea 248± 15 (183 -317 ) Silt y a n d m ix ed se dim e n t 5,6±2 ,7 (0,2 -24,3 ) Cten odiscu s cris patus, Ho rma thia digitata Su bdo m in ant ta x a: Hen ri cia sp . , Ica sterias pan o p la Op h iu ra sa rsi , Hen ricia sp., Pontaster tenuispinus , A lc y on acea: Nep h teidae g . sp p. , Astarte crenata , Br ada sp., E p imeria lor icata, Sabine a s epte mcar inata .
30 Table 4 .2.1 . C o n t. Group of stations Area of dis
tribut ion Depth Average (m in -ma x ) m* Predo m inant type of sedi m e nt B io m a ss o f by -ca tch Average (min -ma x ) k g /tra w ling* Do m inant tax a Typical tax a I A rea of Goose B an k and Mo ller T able 213± 14 (166 -250 ) Silt y sand mi xed sed im e n t 2,6±0 ,4 (1,6 -4,7) Chionoecetes o p ilio C tenodis cus cris patus , Sabine a s eptemc ar inata, Ophi ur a sa rsi, A lc y o n acea: Nep h teidae g . spp. , Hor mathia digitata, Hyas ar ane us , Ophia cantha bidentat a J Slopes of Spitsberg e n and Ho p en B ank, Ce ntral B an k and Great (P erseus) B ank 178± 24 (105 -292 ) Silt y sand m ixed sed im e n t 15,3± 2,1 (9,2 -23,7 ) Helio metra glacia lis, Strongylocentrotus p a ll idus Lebbeus polar is , C tenodi sc us cri spatus , Sabinea sep temcarinata, Oph iacantha biden tata, Chlamys islandica, Ophio ph olis acule a te, Br ada s p . Sp on g ia g . spp., A lc y o n acea: Nep h teidae g . spp. K Slopes of th e trough s in th e so u th ern part of th e se a an d w e stern s lope of th e Spitsberg e n B ank 191± 19 (49 -316) Silt y sand mi xed sed im e n t 5,2±1 ,7 (0,8 -16,2 ) Spon g ia g . spp . Strongylocentrotus p a llidus, S abinea sep temcarinat a, Cten odis cu s cris patus L Sou th -c e n tral part o f th e Ba rents Sea, W est No v a y a Z e m ly a trou gh 212± 11 (159 -282 ) Silt y a n d silt y sa nd mi xe d sed im e n t 22,0± 14, 8 (0,06 -23 5,3) Hormathia digitata Cten odiscu s cris patus, Spong ia g . s pp., M A rea of North Ka n in B an k 112± 16 (69 -198) San d and m ix ed sed im e n t 2,0±1 1,2 (0,4 -9,0) Hyas ar aneus Su bdo m in ant ta x a: Hormathia digitata C h
lamys islandica, Myxilla i
n crus tans, Uraster ias linckii, Str ongylocentr otus p a llidus, Op h iu ra sa rsi, Pagur us pu bescens N North ern part o f th e P ech ora Sea, No v a y a Z e m ly a B ank , sh oal of B
ear Island and Hope
Island 134± 14 (60 -258) San d and m ix ed sed im e n t 27,7± 5,2 (0,2 -103, 8) Strongylocentrotus p a llidus Sabine a s eptemcar inata, C ros sa ster pa ppos us , Gor gonocep halus s pp. , Bala n u s sp p ., C h lamys islandica, Ophiaca nth a bid entata O P ech ora Sea 80±7 (54-117) San d 2,9±0 ,8 (0,2 -6 ,0) Sabine a s eptemcar inata Sclerocrangon bor eas , Hya s a raneus , Boltenia ec hinata, Balanus spp. , A scidiacea g . sp p., Pa gurus pu bescen s P Go ose B ank , No rth Kan in B ank , s h oal of B ear Island
and Hope Island
63±1 0 (39-99) San d, co arse sed im e n t 145,5 ±93 ,1 (1,8 -564, 6) C u cumar ia fr ondos a Balanus sp p ., Str ongyl ocentr o tus sp p ., Hyas ar aneus , Pagur us pu bescens , Ophi ur a s a rs i, Spon gia g . spp . * – De pth and biomass ar e g iv en with standa rd error.
31
Faunistical assemblages dominated by suspension feeders (B2, C, J, K, P)
The distribution of the faunistical assemblades dominated by suspension feeders (in biomass) is shown in Figure 4.2.12. 10° 20° 30° 40° 50° 60° 69° 71° 73° 75° 77° 79° 81° B2 B2 B2 B2 B2 B2 B2 C K P P P C B2 B2 L K C C K CC J C J C C C C C C C C C CC CC P KC K C CC K C C C K C K C C C C C C J B2 B2 J C B2 B2 B2 B2 K KK K K K K K P P J J J
B2 (Gorgonocephalus sp. + Urasterias linckii + Strongylocentrotus pallidus + Ctenodiscus
crispatus + Sabinea septemcarinata)
On the northern slopes of the Eastern Basin, in the West Novaya Zemlya Trough area and the eastern part of the Storfjord Channel at depths between 200–300 m, a community with several species being predominant is distributed. These species have approximately similar importance in the community structure (Figure 4.2.12, 4.2.13).
0 200 400 600 800 1000 1200 Gor gonoc eph alus s p. Uras teria s linc kii Stro ngy locent rotu s pa llidus Cten odi scus cris patu s Sab inea s ept em carin ata Alc yonac ea g. sp. Ophi acan tha bi den tata Hor mat hia d igita ta Colu s sab ini Scle rocr ango n fero x Cros sast er pap pos us Cion a int estin alis Icas teria s p ano pla Ophi ura s arsi Molpa dia bo reali s Inde x of im por ta nc e
Figure 4.2.12. The distri-bution of faunistical assemblages dominated by suspension feeders. (The stations are labelled as in Figure 4.2.11).
Figure 4.2.13. The structure of community Gorgonocephalus spр. + Urasterias linckii + +
Strongylocentrotus pallidus + Ctenodiscus crispatus + Sabinea septemcarinata (“В2” group of stations). The fifteen most abundant taxa are presented.
32
The trophic conditions in the distribution area of this community are reflected by the composition of predominant species with the main types of feeding. Mean biomass in the community distribution area was 22,3±3,2 kg/trawling (Table 4.2.14). Soft corals of the family Nephtheidae, the brittle star Ophiacantha bidentata, the large sea anemone Hormathia
digitata and the large crangonid shrimp Sclerocrangon ferox are characteristic (typical)
species of this community. On the whole this community may be regarded as intermediate between deep-water communities, inhabiting soft bottom in trenches and troughs, and communities, typical of rough and mixed sediment of bottom rise with active hydrodynamics.
C (Gorgonocephalus spp.)
This community, occurred at the similar depth as community B2 on soft and mixed sediment west of the Franz-Victoria Trough (Olga Basin and Kong Karls Basin, deep-water areas south of Kvitøya and Victoria Island –see Figure 4.2.12). It has a similar species composition as B2, but a quite different structure (see Figure 4.2.13, Figure 4.2.14). High abundance of the large ophiuroids of the genus Gorgonocephalus (predominantly G. arcticus) is the typical feature of the bottom macrofauna in this area. Their biomass in by-catches in the area averaged 8,7±1,7 kg/trawling, and at some stations it reached 50 kg/trawling.
0 1000 2000 3000 4000 5000 6000 7000 Gor gonoc eph alus s p. Cten odisc us c rispa tus Spo ngi a g. sp. Molpa dia bo reali s Uras teria s linc kii Scle rocr ango n fero x Icas teria s p ano pla Ophi opl eur a bor ealis Act iniar ia g. sp. Pon taste r tenui spinu s Ophi acan tha bi den tata Sab inea s eptem carin ata Alc yonac ea g. sp. Bry ozoa g. s p. Pyc nogon ida g. s p. Inde x of i m por ta nc e
Ophiuroids of the genus Gorgonocephalus are typical plankton feeders and their high abundance indicates a special hydrological conditions within this area and a dense concentration of zooplankton in the near-bottom layer of water.
The species which are listed as typical for this community, are usually found on soft mud sediment in deep-water areas of the Barents Sea (see Figure 4.2.14 and Table 4.2. 1). The typical arctic species, such as Ophiopleura borealis and Ophioscolex glacialis in the by-catch community, is characteristic of the soft mud sediment in deep-water areas of the Barents Sea. Communities with similar species composition and structural characteristics were also recorded at some stations in the Storfjord Trough and the Eastern Basin (see Figure 4.2.12).
Figure 4.2.14. The structure of community Gorgonocephalus spр. (“C” group of stations). The fifteen most abundant taxa are given.
33
J (Heliometra glacialis + Strongylocentrotus pallidus)
This community is characterized by the predomination of the plankton-feeding sea-lily
Heliometra glacialis, and the sea-urchin Strongylocentrotus pallidus and is recorded in the
northern part of the Barents Sea between 105–292 m depth (on average 178±24 m), on the slopes of the Spitsbergen Bank, the Central Bank and the Great (Perseus) Bank (Figure 4.2.12, 4.2.15; Table 4.2.1). The trophic structure of this community taken as by-catch, and their high biomass, indicate that there are high concentrations of organic suspended material and plankton in these areas. Distribution of this community well proves the well-known thesis that suspension feeders are widely distributed near the slopes of the shelf and local rise of bottom (Sokolova 1956, Neyman 1963, Kuznetsov 1980 et al.). The community was recorded predominantly in the range of cold water masses of Arctic and local origin.
0 500 1000 1500 2000 2500 Heli om etra gla cialis Stro ngy locent rotu s pa llidus Alcyo nidium sp. Ophi osco lex gla cialis Asc idiac ea g. sp. Ophi oph olis a culeat a Spo ngia g. sp. Icas teria s pano pla Cten odisc us c rispa tus Ophi acan tha bi den tata Chla mys island ica Sab inea s eptem carin ata Cros sast er pap pos us Hor mat hia d igita ta Pon taste r tenui spinu s Inde x of im por ta nc e K (Spongia g. spp.)
This group of stations, with sponges as a predominant species, was recorded at a wide range of depths (49–316 m) in coastal waters of Spitsbergen and on the slopes of the many trenches and banks in the south-eastern Barents Sea (see Figure 4.2.12). These stations are also characterized by high abundance of bryozoans and sea anemones. This fauna complex is not a typical community as it combines stations with highly diverse species composition. The only similarity among this station group is the large taxonomic group of animals being predominant. It should be noted that if dense local populations of sea-lily Heliometra glacialis
are distributed predominantly in Arctic waters then sponges communities are mainly occurring in waters of Atlantic origin.
P (Cucumaria frondosa)
The predominance in by-catches of the large commercial holothurian Cucumaria frondosa
was recorded at several stations in the Goose Bank and the North Kanin Bank as well as in the central part of the Spitsbergen Bank at depth less than 100 m (see Figure 4.2.12). By-catches of invertebrates in these areas are characterized by significantly high biomass which averaged 145±93 kg/trawling. The highest by-catches (up to 500 kg per 15 minute trawling) were
Figure 4.2.15. The structure of community Heliometra glacialis+ Strongylocentrotus pallidus. (“J” group of the stations). The fifteen most abundant taxa are given.
34
recorded in the Spitsbergen Bank. The main bulk (up to 330 kg) of these by-catches was made up by Cucumaria frondosa. The Cucumaria frondosa biomass, in by-catches at the stations in the south-eastern and north-western parts of the Barents Sea, differs significantly. On the eastern fishing banks it does not exceed tens kg per trawling, while on the Spitsbergen Bank it is estimated as hundreds kg per trawling. This fauna assemblage is characterized by the predominating suspension feeders and the wide distribution of epifauna organisms such as sponges, bryozoans, hydrozoans and ascidians (Figure 4.2.17, Table 4.2.1). Sea-urchins
Strongylocentrotus pallidus and S. droebachiensis as well as barnacles Balanus balanus and
B. crenatus also form dense, mixed, local populations in these particular areas.
0 1000 2000 3000 4000 5000 Spo ngi a g. sp. Bry ozoa g. s p. Act iniar ia g. sp. Stro ngy locent rotu s pa llidus Cten odi scus cris patu s Sab ine a s ept em carin ata Hor mat hia d igita ta Ophi acan tha bi den tata Pyc nogon ida g. s p. Ophi ura s arsi Ophi oph olis a culeat a Poly noid ae g. sp. Hen ricia sp. Bra da s p. Alc yonac ea g. sp. Inde x of im por ta nc e 0 1000 2000 3000 4000 5000 6000 7000 8000 Cuc umar ia frond osa Spo ngia g. spp. Stro ngy locent rotu s spp. Bal anu s sp. Hya s arane us Scler ocra ngon bor eas Act iniar ia g. sp. Pag urus pu bes cens Uras teria s linc kii Abie tinari a a biet ina Hiat ella ar ctic a Sab inea s eptem carin ata Lafoea frut icos a Ophi ura s arsi Inde x of im por ta nc e
Figure 4.2.16. The structure of community Spongia g. spp. (“К” group of the stations). The fifteen most abundant taxa are given.
Figure 4.2.17. The structure of
community Cucumaria frondosa
(“Р” group of the stations). The fifteen most abundant taxa are given.
35
Faunistical assemblages dominated by detritus feeders (B1, D, E, H, N)
The distribution of communities with detritus feeders predominant in biomass is shown in Figure 4.2.18. 10° 20° 30° 40° 50° 60° 69° 71° 73° 75° 77° 79° 81° B1 D D H B1 B1 B1 B1 E D H E B1 E N B1 B1 B1 B1 N N B1 H B1 N B1 N N N C D D D E E B1 E B1 E B1 E D N N N D E E EB1D E EE E E B1 D N N D N N B1 B1 E N N N N N N N H E E E H HH H N E N N E EХEE E E E E B1 E E
Figure 4.2.18. The distribution of faunistical assemblages dominated in biomass by detritus feeders. (The stations are marked as in Figure 4.2.11).
B1 (Molpadia borealis)
A community predominated with the large holothurian Molpadia borealis and the subdominant sea-star Ctenodiscus crispatus was found in the deep-water area of the Eastern Basin and at some stations in the eastern part of the Bear Island Trough, at depths more than 300m on muddy grounds (Figure 4.2.18, 4.2.19). Both the species are typical subsurface deposit feeders, and they form dense local populations in areas with soft muddy sediment, rich in organic fertilizer. The mean biomass of these species was 5,1±1,1 kg/trawling and 2,2±0,9 kg/trawling respectively. At some stations the biomass of these species in the by-catches reached 20 kg/trawl. The sea-star, subsurface deposit feeder Pontaster tenuispinus, the crangonid shrimp Sabinea septemcarinata, the brittle star Ophiacantha bidentata and the soft corals of the Nephteidae family are also characteristic taxa of this community. The described community is particular for the deep-water areas in the Eastern Basin (Figure 4.2.18).
E (Ctenodiscus crispatus)
The species composition of the community recorded in the eastern part of the Bear Island Trough (see Figure 4.2.18), is very similar to the described above community of Molpadia
36
quantitative ration of dominant taxa. In the Eastern Basin Molpadia borealis had the highest biomass while Ctenodiscus crispatus was subdominant, but in the Bear Island Channel
Ctenodiscus crispatus was dominant in biomass, frequency of occurrence, and index of
importance (Figure 4.2.20). In this area about half of the biomass was Ctenodiscus crispatus
which exceeded the mean biomass of Molpadia borealis several times.
0 500 1000 1500 2000 2500 3000 3500 Molpa dia bo reali s Cten odisc us c rispa tus Gor gonoc eph alus s p. Sab ine a sept em carin ata Stro ngy locent rotu s pa llidus Scler ocra ngon fero x Uras teria s linc kii Icas teria s p ano pla Ophi acan tha bi den tata Pon taste r tenui spinu s Hor mat hia d igita ta Sadu ria s abin i Colu s sab ini Alc yonac ea g. sp. Ophi ura s arsi Inde x of im por ta nc e 0 1000 2000 3000 4000 5000 6000 Cten odi scus cris patu s Molpa dia bo reali s Icas teria s p ano pla Sab ine a s ept em carin ata Hor mat hia d igita ta Asc idiac ea g. sp. Spo ngi a g. sp. Bra da s p. Ophi ura s arsi Pon tas ter t enui spinu s Alc yonac ea g. sp. Colu s sab ini Asta rte c rena ta Stro ngy locent rotu s pa llidus Sadu ria s abini Inde x of im por ta nc e
By-catches with similar species composition and ratio of species were also recorded at some stations in other deep-water areas of the Barents Sea. This was mainly on soft sediment in the deep-water troughs at the coasts of Murman, the southern island of Novaya Zemlya archipelago and north-east of Spitsbergen (see Figure 4.2.18).
Figure 4.2.19.. The structure of the
community dominated by Molpadia
borealis (“В1” group of the
stations). The fifteen most abundant taxa are given.
Figure 4.2.20. The structure of the community dominated by
Ctenodiscus crispatus (“E” group of the stations). The fifteen most abundant taxa are given.
37
D (Ctenodiscus crispatus + Sabinea septemcarinata)
The community, recorded in this group of stations, had a species composition which was very similar to the above mentioned community “E” Ctenodiscus crispatus, and may be regarded as its shallow-water variety (Table 4.2. 1). Specificity of this group of stations consists in the less pronounced dominance of Ctenodiscus crispatus and the high occurrence of crangonid shrimp Sabinea septemcarinata(Figure 4.2.21). The biomass (average 2,6±1,2 kg/trawling) of
Sabinea septemcarinata was slightly lower than the biomass of Ctenodiscus crispatus. At
some stations the biomass of Sabinea septemcarinata exceeded 10 kg/trawling.
0 500 1000 1500 2000 2500 3000 3500 Cten odi scus cris patu s Sab ine a s ept em carin ata Uras teria s linc kii Alc yonid ium sp. Co lus s abin i Clin ocar dium cili atum Hor mat hia d igita ta Ophi acan tha bi den tata Sadu ria s abini Alc yonac ea g. sp. Hen ricia sp. Buc cinum elat ior Ophi ura s arsi Stro ngy loc ent rotu s pa llidus Inde x of im por ta nc e
The by-catch stations with the above described correlation of species being predominant, were recorded both in the south-eastern Barents Sea (the South Novaya Zemlya Trough, the slopes of the Murman Rise, the North Kanin Bank and the Goose Bank) and in the north-western part of the Barents Sea and adjacent water, near the slopes of the Bear Island Channel and the Storfjord Channel (see Figure 4.2.18).
H (Ctenodiscus crispatus + Hormathia digitata)
The species community which was recorded at the stations in the mouth of the Storfjord Channel and deep-water troughs between the south-eastern banks (the Goose Trough, the Kanin Trough, Nord djupet) (see Figure 4.2.18), had a structure which was similar to the before described polydominant community (Figure 4.2.22). Dominant species of the community are Ctenodiscus crispatus and the sea anemone Hormathia digitata. Eventhough both species have a small size, their biomass reached several kg per 15 minute trawling. Sea-stars of the Henricia genera and Icasterias panopla are regarded as subdominants. The long list of typical species of this community includes brittle star Ophiura sarsi, sea-star Pontaster
tenuispinus, Nephtheidae soft corals, bivalves Astarte crenata, polychaetes Brada sp., and the
amphipoda Epimeria loricata.
Figure 4.2.21. The structure of the community Ctenodiscus
crispatus+Sabinea septemcarinata (“D” group of the stations). The fifteen most abundant taxa are given.
38
A characteristic of this species assemblage is the occurrence of the large boreal sea-star
Hippasteria phrygiana at some stations, both in the northern and southern areas of
distribution. Occurrence of this species in by-catches is the clear indicator of the Atlantic boreal fauna distribution along deep-water troughs with waters of North Atlantic Current.
0 200 400 600 800 1000 1200 1400 1600 1800 Cten odi scus cris patu s Hor mat hia d igita ta Hen ricia sp. Icas teria s p ano pla Pon tas ter t enui spinu s Radi ella g rim aldi Act ino stol a s p. Ophi ura s arsi Bat hyar ca gla cialis Pha kellia sp. Alc yonac ea g. sp. Nept une a de spec ta Colu s s abin i Ro ssia sp. Asta rte c rena ta Inde x of im por ta nc e N (Strongylocentrotus pallidus)
The dense local populations of the sea-urchin Strongylocentrotus pallidus form well-structured communities with a pronounced monodominant structure (Figure 4.2.23). This community occurs on coarse and mixed sediment of coastal shallows and local bottom rises in the open sea – north of Kolguev Island, on the Novaya Zemlya Bank, the Great (Perseus) Bank and the Spitsbergen Bank (see Figure 4.2.18).
0 1000 2000 3000 4000 5000 6000 Stro ngy locent rotu s pa llidus Gor gonoc eph alus s p. Sab ine a s eptem carin ata Cros sast er pap pos us Bal anu s sp. Spo ngia g. sp. Hor mat hia d igita ta Cten odisc us c rispa tus Uras teria s linc kii Heli om etra gla cialis Chla mys island ica Scler ocra ngon bor eas Hya s a rane us Ophi acan tha bi den tata Ophi oph olis a culeat a Inde x of im por ta nc e
The community was registered at depths of 60–258 m (in average 134±14 m). Sea-urchins biomass in by-catches reached up to 68 kg per 15 minute trawling and averages 14,1±3,1
Figure 4.2.22. The structure of the community Ctenodiscus
crispatus+Hormathia digitata (“H” group of the stations). The fifteen most abundant taxa are given.
Figure 4.2.23. The structure of the community dominated by
Strongylocentrotus pallidus(“N” group of the stations). The fifteen most abundant taxa are given.
39
kg/trawling in the area of the community distribution. The brittle stars Ophiacantha bidentata
and Gorgonocephalus spp., the soft corals of the family Nephteidae, the crangonid shrimp
Sabinea septemcarinata and the scallop Chlamys islandica are typical species of this
community.
Faunistical assemblages predominated by carnivorous species (A, I, L, M, O)
The distribution of communities where carnivorous species are predominant in biomass is shown in Figure 4.2.24. 10° 20° 30° 40° 50° 60° 69° 71° 73° 75° 77° 79° 81° A A A A A L L L M M L L A I I I A I I A L A AA A A A A A A AA A A M A O O O O O O O O O I M M M M A L L L L A L L LL L L A L L
Figure 4.2.24. The distribution of faunistical assemblages dominated in biomass by carnivorous species. (The stations are marked as in Figure 4.2.11).
A (Paralithodes camtschaticus)
The stations, combined into the cluster "A", are compactly located in the coastal zone of the southern part of the Barents Sea and clearly mark the area of the red king crab distribution. This fauna assemblage is associated with coarse and mixed sediment of the coastal shoal (Table 4.2. 1, Figure 4.2.24). The main part of the by-catches biomass on these stations belongs to the red king crab (Figure 4.2.25). According to the data of the three years of observation, the biomass of king crab in by-catches average 71,5±33,0 kg/15 min of trawling. The contribution of the others species to the total biomass of by-catches is considerably less. Usually its biomass do not exceed 15 kg per 15 min of trawling and average about 1,5 kg/15 min of trawling. Besides the Paralithodes camtschaticus the others characteristic species of this assemblage are the sponge Suberites ficus, the sea star Asterias rubens, the sea anemone