Timelines: An Interactive System for the
Collection and Visualization of Temporal Data
Beverly L. HarrisonDept. of Industrial Engineering University of Toronto
4 Taddlecreek Road Toronto, Ontario, Canada
M5S 1A4
Russell Owen Dynamic Graphics Project,
CSRI
University of Toronto 10 King's College Road Toronto, Ontario, Canada
M5S 1A4
Ronald M. Baecker Dynamic Graphics Project,
CSRI
University of Toronto 10 King’s College Road Toronto, Ontario, Canada
M5S 1A4
A b s t r a c t
Human–Computer Interaction (HCI) researchers collect, analyze, and interpret information about user behavior in order to make inferences about the systems they are designing. This paper describes four paradigm shifts in HCI research and discusses how each influences data collection and analysis. Based on these trends the implications for tool design are outlined. We then describe the Timelines system, which was created to address both these paradigm shifts and two years of user testing results from the VANNA system [4, 5, 6]. The Timelines system is an interactive data collection and visualization tool which supports both quantitative and qualitative analysis, and exploratory sequential data analysis. It accepts many diverse types of temporal data and provides the user with powerful data manipulation and color, graphical visualization tools. We summarize four representative case studies which reflect different methodological approaches and research goals, typical of our user community. From this the implications for the design of our system (and for data collection and analysis tools in general) are described.
Keywords: video analysis, temporal data, data analysis, graphical visualization
Introduction
HCI researchers collect and analyze information about user behavior in order to better understand user intentions, goals, and work processes, thereby allowing designers to create better, more suitable systems. Video (and audio) recordings have played an important role in capturing the complex human–system interactions in detail, preserving both the contextual and temporal dependencies of these interactions. Keystroke logs or system activity logs provide additional information about the sequence of actions carried out by users and the system responses to these actions. Usability data and observer notes inform designers about what went wrong and why.
The consequence of these methodologies is that HCI researchers are drowning in rivers of video tape, are buried under mountains of system logs, and cannot easily assimilate or integrate these data to draw inferences about either user behavior or the design implications for their systems. Thus the tools to collect and analyze these data play a critical role in not only determining what we can collect, measure, or integrate, but also how easily and accurately we can interpret these data.
The requirements of data collection and analysis tools have changed over time since the "early" systems were created [e.g., 4, 5, 12, 14]. We illustrate one method of addressing the issues raised by describing the results of our work in temporal data collection and analysis over the past four years. (For a more detailed review of others systems and tools refer to 4, 5, 9.)
Based in part on several years of work with the VANNA system [4, 5, 6], we have developed the Timelines system. In this paper, we describe the kinds of multi-stream data Timeline users have collected such as, video records, audio records, observer notes, verbal protocol analysis, or system activity logs. The common integrating element is time, with the preservation of the sequential dependencies (and hence the contextual dependencies). We also describe how Timelines supports the combination of multiple data streams, qualitative and quantitative analyses, and the integration of visualization tools for data exploration. These are discussed within the context of supporting the recent evolutionary trends in HCI research methods. Case studies are presented which reflect the diverse user group, their needs, and the design implications of the testing results.
Trends in HCI Research Paradigms
This section discusses the influences of four fundamental paradigms shifts as they relate to data collection and analysis to support HCI research. Each of the paradigms has evolved to address new requirements, new research methodologies, and contributions from other disciplines. The first of
To appear in the Proceedings of Graphics Interface’94, May 16-20, 1994, Banff, Alberta
these trends reflects changes in the types of data collected about user behavior and the emergence of ethnomethodological approaches to studying users. The second paradigm shift reflects a change in the statistical methods employed to analyze the data collected, where the emphasis is now placed on understanding sequential, temporal dependencies. The third shift reflects a change from analysis to support confirmatory hypothesis testing to exploratory insight attaining strategies, used to formulate hypotheses. Finally, the fourth paradigm shift reflects the co-dependence of quantitative analysis with qualitative analysis, where each complements and supports the other, instead of existing independently on dissociated data sets.
Research in HCI has long relied upon information about and from "users" to design systems which better match the capabilities and intentions of the people for whom the technologies are being designed. Initially psychological methodologies [e.g., 1, 2, 17, 25] were employed to determine human perceptual, cognitive, motor, and attentional limits. Subsequently, usability studies provided approximations of how the systems (or prototypes of these systems) would respond in slightly more realistic task settings with people who more realistically represented the target users [e.g., 11, 16]. The errors observed in these simulations provide useful feedback about specific aspects of a particular design, allowing the problems to be fixed by iterative design. Most recently, methods in anthropology and sociology are being employed to study "situated activities" [23], i.e., people observed as they carry out real tasks in complex real world environments. Researchers attempt to determine how users collaborate and coordinate tasks, what they communicate about and to whom, work contexts, and how technological mediation and tools change these work processes.
Our ability to form insights which can then be used to infer meaningful design implications is greatly influenced by the capabilities of the tools used to manipulate and analyze the rich and varied data we collect. In the past traditional statistical methods such as analysis of variance and split plots, correlation, cluster analysis, and factor analysis have been applied to try and understand the "meaning" of the data. To capture the rich collection of data resulting from interactions between humans and computers and to facilitate the fine grained analysis required, video has become the medium of choice. Using a common temporal theme, video can be combined with other data such as, keystroke logs or system activity logs, observer notes, or verbal protocols. The resulting data set is sequential, i.e., it contains a sequence of events that may be encoded in terms of one or more time series. Thus techniques such as time series analysis, Markov analysis, and lag sequential analysis are being
adapted to the needs of video data interpretation [9, 13, 18].
The complexity of the interactions that occur in such data is also leading to an emphasis on exploratory, rather than confirmatory, analyses. Exploratory Data Analysis (EDA) [24] is concerned with developing insights about processes through examining the outputs or data that they generate. This exploration is quite different from the directed data collection of hypothesis–based (confirmatory) analyses. EDA allows researchers to formulate hypotheses and visualize relationships between data that might otherwise have been overlooked. This exploratory strategy is ideally suited to studies in HCI where interactions are complex, outcomes are often unpredictable, and hypotheses may be non-intuitive or difficult to generate. Exploratory Sequential Data Analysis (ESDA) techniques are needed to achieve insight concerning the context of the interactions and the sequential coherence of the resulting events [22]. The summarized data then consists of information about the situational context, temporal dependencies and sequencing, human operator responses and performance, and system responses and states.
Some of the data collected is quantitative, such as human performance measures, error counts, and task completion times. Some of the data collected is qualitative, such as factual descriptions of meaningful incidents and events that have been observed. There are a number of reasons why the use of qualitative analysis may be both desirable and necessary. Frequently, important observational information is inherently categorical in nature and cannot be reasonably reduced to a number scaling. Qualitative data also allows a richness of description that is not otherwise possible. In addition, complex interactions between humans and computers often lead to unexpected patterns of behavior. Thus open-ended systems of coding are needed to capture the interaction fully. Typically, such open-ended coding is qualitative in nature. Qualitative data may be used to support or explain the phenomena suggested by the quantitative data and may be analyzed in terms of frequencies, sequencing, patterns, and inter-relationships. Of equal importance, quantitative data can support phenomena observed or recorded in the qualitative data to determine whether such phenomena occur with regularity and under which conditions.
From the above assessments of the evolution in HCI research, we can draw several inferences about the nature of the tools that we need to capture and manipulate human–computer interaction data. The tools need to support multi–stream, temporal data from diverse sources and at varying levels of detail. We need to augment traditional statistical methods with methods that reflect the dynamic temporal
analysis or lag sequential analysis). We need to support not only confirmatory analysis but also exploratory analysis through graphical visualizations and more powerful data manipulation tools. Finally, we need to support both quantitative and qualitative analyses and allow users to smoothly move from one to the other.
The VANNA and Timelines Systems
Our laboratory has been developing tools for video annotation and analysis research over the past four years. We conducted extensive reviews of existing automated systems and interviewed the users of some of these systems [e.g., 10, 12, 13, 14, 19, 20, 23]. Task analyses were done to study the kinds of hand written notes people used when they had no automated tools. From this background research, we derived a set of design criteria [4, 6]. We then formulated the design features and functions which we built into a computer-based system [4, 5, 6, 9]. The VANNA (Video ANNotation and Analysis) system has been used extensively for the past two years to annotate a variety of temporal data such as video, audio, communication network data, keystroke logs, and verbal transcriptions. It has been used by psychologists, anthropologists, usability experts, engineers, ergonomists, and computer scientists. VANNA was designed to work both as a desktop system and as a portable field system, for real-time note taking and for detailed off-line analyses. User feedback led to numerous iterations and changes in the system functionality and in the user interface. Our current system, Timelines, was completed in the Spring of 1993.
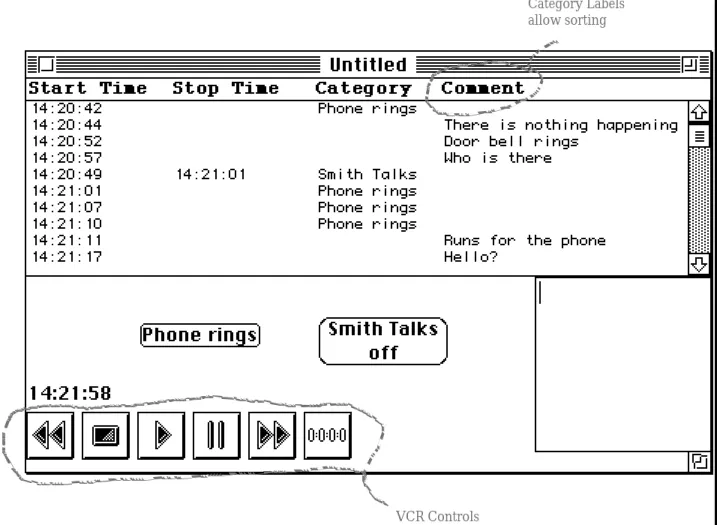
In the Timelines system we have integrated the data capture tools, the video device controls, and the resulting data file view into a single screen (Figure 1). New elements are entered, viewed, edited, and manipulated within this same view. The data may be created from within the Timelines system or it may be imported from any outside source as an ASCII file with column–based formatting and time stamps. In this way the data capture tools can easily be substituted with customized external tools (e.g., keystroke log capturing tools, eye movement recorder tools, communication network logs). The Timelines data capture tool was designed to facilitate video analysis. All data is merged into a scrolling column–based view which can then be sorted, searched, color highlighted, and plotted. The search tools and visualization tools can be applied to any data file or combination of data files.
The system was originally created to support
video data collection and analysis for both software
usability testing and behavioral studies in Computer Supported Cooperative Work (CSCW). It has since
been used in a wide range of applications, though it is still extensively used in situations where video analysis plays a key role. In addition to experiments, we also envisaged real time "note taking" during conferences, seminars, or classes. The system has been used in these contexts as well. We designed the system to support a variety of input devices including a touch screen, digital stylus, mouse, and keyboard. The system supports both real-time annotation and the detailed analysis of video data in desktop and portable versions.
C ap t ur i ng t he d at a
Users define their own index markers (event markers) using the "New Event" menu item and assign each event a unique name and optional keystroke equivalency. A single button press (or keystroke) immediately creates an event label and links it to the corresponding timed location in the video. These system actions are used to capture the instantaneous occurrence of important events in the video, which can reflect ratings of behavioral data such as mood and mood changes, pauses in conversation, overlaps in speech, etc. Button presses are typically used to capture frequently occurring, pre-defined events.
To capture events having durations, an interval is used. Interval markers also have user defined labels included in their appearance is an indication of their current status. Intervals which are activated show the time at which they were started. Intervals that are not currently active show an "off" state. Users create intervals using the "New Interval" menu item and then label each interval. Intervals may be set up to be mutually exclusive, where starting one interval automatically stops other active intervals.
Textual comments may be entered either alone or in conjunction with an index or interval. The comment window is variable length, scrollable and editable. The comment field is typically used to capture observational data or notes about infrequent or unpredictable events. Verbal transcriptions may be thought of as a special case of commenting and are therefore entered in a similar manner.
M a n i p u l a t i n g t h e d a t a
As each event, interval, or comment is entered it appears highlighted as a new item at the bottom of the data log, shown in the upper half of the Timelines screen. This is a scrolling list of all of the data items formatted into the 4 columns shown. Any four column ASCII data file may be loaded into the system and subsequently manipulated.
The data manipulation tools allow users to sort the file, create data subsets, and apply colors to groups of data items. To sort the file, users click on the heading of the column to be used as the sort key. To
To appear in the Proceedings of Graphics Interface’94, May 16-20, 1994, Banff, Alberta
VCR Controls
Category Labels allow sorting
Figure 1. Timelines Data Capture and File View Window create multiple views or subsets of the data file, users
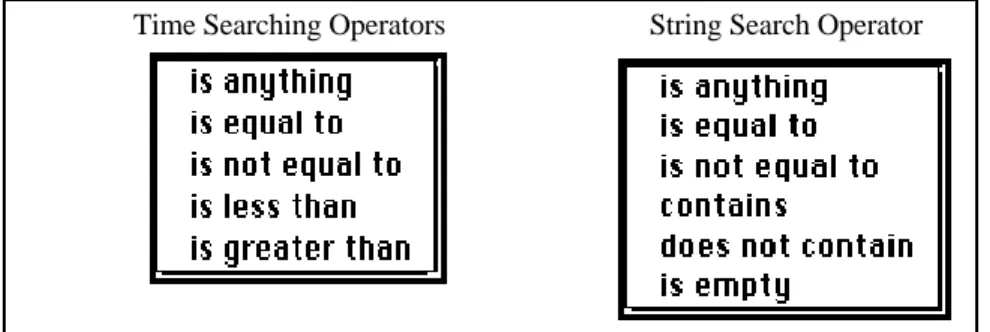
select items which match specified criteria. Filtering and searching is provided through a number of operations which may be performed on any one of the four columns (see Figure 2). These operations are structured as <field name><operator><value specified by the user> where the operators are those shown.
The results of each search are highlighted in the data file. While highlighted, user may apply any color to those items to distinguish them from other
data elements. Several default colors are provided along with a flexible "color wheel", permitting users to create new colors. This allows users to create secondary coding schemes should they wish, based on hue, saturation, or other color parameters. For example, in data which rank people's moods, colors could change from cool shades of blue (indicating calm moods) to deep reds (indicating frustration or anger). Once applied, these color mappings will be used in all subsequent graphing and summarization.
Figure 2. Timelines Search Operators Timelines allows user to create subsets of the data
file through use of "Hide" and "Reveal" functions. Users set up the search criteria to find items they wish to temporarily remove from the active data set. The results of a search are returned as highlighted items in the data file. Users then choose the "Hide" option and these items are temporarily
hidden from view. The "Reveal" option will restore the data file to its original state, i.e., showing all data elements. Only the data which is currently visible will be used in subsequent analyses.
Visualizing the data
The system supports two forms of data summaries. The first is a quantitative summary of the number of each type of "item" in the data file. This includes the total number of entries in the file as a
whole, the number of user defined categories, and the number of colors used. For each event type, interval type, and color the total number of occurrences are displayed. Intervals additionally have a cumulative and average duration. Summaries are calculated for the currently displayed data set (this excludes items which may have been hidden).
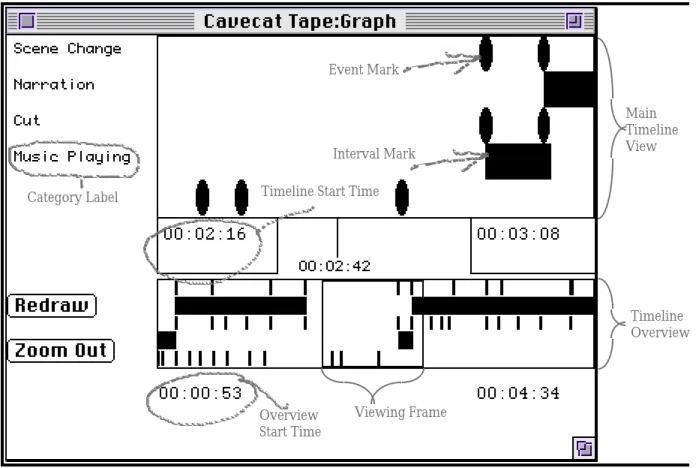
Alternatively, users may produce a graphical visualization which plots the categories (events and intervals) on the y-axis and time along the x-axis (Figure 3). If color was applied to certain data items this will be reflected in the graphical output. Again hidden items will be excluded from the visualization, thereby allowing users to create and display subsets of the original data file. Events are shown as short circular marks, while intervals are shown as bars indicating their duration.
Viewing Frame Overview Start Time Main Timeline View Timeline Start Time
Interval Mark Event Mark
Category Label
Timeline Overview
Figure 3. Timelines Graphical Visualization An overview window is provided which lets the
users zoom in on parts of the graphical output to see more detail, scroll along the time line to see further into the file, or zoom out to see an overview of the data with less detail. The categories plotted along the y-axis may be re-ordered, or deleted (temporary removal).
The aligned time lines allow users to visually compare streams of data for trends and patterns. Any item in the graph may be selected and the corresponding item in the data file will be highlighted. The corresponding video location can then be automatically found and played back to see the original context for the item of interest. This allows users to smoothly move between levels of detail and retrieve original data at any time. Timelines graphical visualizations can be saved to files.
Four Case Studies on System Usage
User testing for VANNA and Timelines has spanned many varied applications and disciplines. These systems have been used by clinical and developmental psychologists, anthropologists, usability experts, engineers, ergonomists, and computer scientists. In this section we briefly describe some representative case studies and methodologies.
In the next section we discuss the implications these studies had on our system's evolution.
The first user study of the VANNA system is a detailed unobtrusive observation of real users performing real work with their own goals and objectives to meet. The system was used for detailed analysis of video recorded meetings to determine the differences in characteristics of between site, video mediated communication versus within site, face to face communication [7,8]. Data was collected in one of three formats: hand written notes made by the observer during the meeting, a video and audio recording of the meeting itself, and the questionnaires filled out by the meeting participants. Event markers were used to count instances of simultaneous speech within a site and across sites, turn interruptions, failed turn attempts, gestures used to smooth or facilitate conversation, and gestures or movements used to provide visual feedback. Comments were used to elaborate on the degree of disruption for simultaneous speech or pauses. The type of gesture and its purpose was also described by a typed comment. Interval markers were used to provide approximate measures of the time spent on task related work versus social interaction. The questionnaire data (typically Likert adjective scale ratings) were then compiled and
summary information gave a rough indication of the density of the data over the course of the meeting and reflected the meeting progression and how the communication patterns evolved.
The second representative study (also using the VANNA system) reflects a typical usability test. The observer tested the usability of a complex fax machine and the corresponding user documentation [3]. Users were given a series of tasks to complete and were video taped performing these tasks. They were timed on each task and were asked to think aloud in order to understand the process they applied when carrying out each task. Based on pilot testing, a number of events were pre-defined such as: "refers to manual", "asks for hint", "makes an error of type X". Other events occurred at random times and were not predictable, for example, "subject cheers after successfully completing the task", "subject kicks the machine". These were captured using open ended comments. Intervals were set up to time each of the tasks (e.g., send a fax, photocopy a document). The tester also made use of the comment field both for his own notes and to transcribe the user's think aloud protocol. One of the useful "visualization" mechanisms in usability testing is the ability to examine similar problems back-to-back (i.e., playback-to-back from the video). This allowed the tester to make comparisons across subjects thereby gaining insights into possible causes and the severity of observed problems, answering questions such as the following: Did all subjects react in the same way to the problem? How did each subject arrive at that particular problem state? What did the subjects attempt in order to correct the problem? This also allowed tester to use the system as a tool to present compelling evidence of problems to equipment designers.
The third case study illustrates how the Timelines system handles time stamped data generated externally by other computer systems and subsequently imported. In this study, we wished to examine time stamped data collected automatically by a Unix workstation acting as a server for a computer controlled audio-video network. This data represented the usage of our University of Toronto media space system [15] over a period of one week. Using the searching and hiding functions outlined above, different views of the data file were created, using various colors to distinguish the items of interest in each view. The items plotted were colored based on the media space action requested (e.g., logins were green, glances were yellow, connection requests were blue). Using this graphical representation one could clearly see the evenings when there was no media space activity or which people were most active at certain times during the day. As a result of using the graphical visualization we observed usage patterns of the media space system which formerly went unnoticed. The system supported a
one–way video “glance” feature (a peek into someone’s office). The recipient was forewarned by an audio tone but saw no images (this was felt to be less disruptive). The graphical plot showed then whenever users
received a video glance they initiated a series of
glances to determine who just glanced in (a cascading effect). (The glance feature was later changed to indicate who had looked in.)
The final study (again using the Timelines system) reflects detailed studies of infant behavior by developmental psychologists. These researchers recorded overall movement (rated by degree), various facial expressions, vocal expressions, and gaze directions for a number of infants at 3 month intervals. They wished to understand which of the data elements appeared to be correlated and how each element evolved as the child developed. Mutually exclusive intervals were created to facilitate data capture such as children appearing distressed (cannot be simultaneously happy or laughing). The graphical plots and summaries were used extensively to detect patterns within the data. By zooming in on a smaller time segment and removing several categories from the y-axis, clustering of events became visible. This data was also used to navigate the tape to find salient sections. The researchers are also applying pre–determined rules to merge data files from multiple judges (inter-judge reliability measures).
Implications for our design
In the early observational studies or usability studies, handwritten notes were either manually added to the data file or were used to locate the previously noted items on the video tape so that they could be entered into the system. This lack of initial integration slowed the data collection process considerably. A touch typist could have entered similarly brief and abbreviated notes on a computer had one been available. Portable versions of the systems were created to better support this type of active field observation. Testing on real time note taking, conducted over the last year, shows that it is possible to capture simple, abbreviated forms of data during observations or testing.
The analysis of the video data also proved very time consuming. While much of this resulted from the nature of the studies, other problems were a result of inadequate functionality within the tools. For instance, intervals are often mutually exclusive. That is, the occurrence of one type of interval precludes the occurrence of another. We now have a "mutually exclusive" capability for marking intervals to address this problem. We do not yet have a means of applying rules to automatically merge multiple judges observations.
It has been shown in a number of our case studies that hierarchic structures within the categories are
To appear in the Proceedings of Graphics Interface’94, May 16-20, 1994, Banff, Alberta
necessary if we are to adequately support the needs of users, in particular for data resulting from controlled experiments. While some versions of the VANNA system support this, Timelines currently has no function for creating and identifying hierarchic structures.
In our analysis tools, better mechanisms for entering and manipulating verbal protocol data and conversation analysis data are needed. Thus far, we have had insufficient numbers of users doing research that requires this type of analysis to provide us with feedback and requirements. While it seems that supporting hierarchic structures would facilitate tagging speech acts with speaker identifiers, we believe that there are many subtle and important aspects in both conversation analysis and verbal protocol analysis that we have not begun to address. This has implications for the number and way in which we have been handling streams of data within our system.
We have not incorporated statistical analysis tools. Currently users may export the Timelines data file into another package (e.g., StatView™, SuperANOVA™, or Excel™) and carry out the statistical analyses through the other package. While we do not wish to re-implement the functionality offered by these commercially available packages, we do wish to make their integration more seamless. We are continuing work on graphical representations for time based statistical analyses, not supported by these commercial packages.
Conclusions
We have described several recent trends in HCI research which changes both the type of data collected about user behavior and the types of analyses required. Based on many iterations of VANNA system, our understanding of other systems, and several years of user testing we have developed the Timelines system. This system illustrates ways in which tools can support simple quantitative data analysis while allowing users to smoothly move to more qualitative graphical representations for data exploration within the same tool. We have presented several diverse but typical user studies which reflect the types of features that different disciplines require. Despite the methodological differences, there are a number of common requirements across disciplines as reflected by the usage of our system.
We believe that tools can and should reflect the emerging trends in HCI research including integration of detailed qualitative data, quantitative analyses, and visual representations to support data exploration. Our initial results indicate that graphical visualizations are powerful exploratory tools, particularly in large data files. The ability to create subsets or alternate views of this data file and redraw the visualizations
appears to provide users with substantial flexibility. It has also encouraged our users to think of "temporal data analysis" in new ways, reinforcing the idea of exploratory data analysis for more general temporal sequential data.
Acknowledgments
We would like to thank Mark Chignell for his support and input for the development of the VANNA and Timelines systems. Support for our research laboratory is gratefully acknowledged from: the Information Technology Research Center of Excellence (ITRC) of Ontario, the National Science and Engineering Research Council (NSERC), the Ontario Telepresence Project, Bell-Northern Research Ltd., the Institute for Robotics and Intelligent Systems (IRIS) of Canada, and by Apple Computer. References
1. Barnard, P.J. (1987). Cognitive resources and the learning of human-computer dialogs. In J.M. Carroll (Ed.), Interfacing Thought: Cognitive
Aspects of Human-Computer Interaction, pp.
112-158. Cambridge, Massachusetts: MIT Press. 2. Card, S. K., Moran, T. P., and Newell, A.
(1983). The Psychology of Human-Computer
Interaction. Hillsdale, N.J.: Erlbaum.
3. Chignell, M. H., and Valdez, J. F. (1991). The Role of Truncated Experiments and Field Experiments in Usability Analysis. Proceedings
of the IEEE International Conference on Systems, Man, and Cybernetics, Volume 2,
1349-1353.
4. Harrison, B. L. (1991a). The Annotation and
Analysis of Video Documents. M.A.Sc. Thesis,
Dept. of Industrial Engineering, University of Toronto. April, 1991.
5. Harrison, B. L. (1991b). Video Annotation and Multimedia Interfaces: From Theory to Practice.
Proceedings of the Human Factors Society 35th Annual Conference. San Francisco, CA. September, 1991.
6. Harrison, B. L. and Baecker, R. M. (1992) Designing Video Annotation and Analysis Systems. Proceedings of the Graphics Interface
‘92 Conference. Vancouver, B.C. May 11-15,
1992. pp. 157-166.
7. Harrison, B. L., Chignell, M. H., and Baecker, R. M. (1992a). Out of Site, Still in Mind? A Case Study in Video Mediated Communication.
Proceedings of the Human Factors Society 36th Annual Conference. Atlanta, GA. October
12-18, 1992. pp. 242-246.
8. Harrison, B. L., Chignell, M. H., and Baecker, R. M. (1992b). Do Perceptions Match Reality? A Comparison of Subjective and Objective Measure
in Video Mediated Communication. Proceedings
of the Human Factors Association of Canada 24th Annual Conference. October 25-28, 1992.
Hamilton, Ontario. pp. 21-35.
9. Harrison, B. L. (1994). Multimedia Tools for Social and Interactional Data Collection and Analysis. To appear in The Social and
Interactional Dimensions of Human–Computer Interaction. Peter Thomas (Ed). Cambridge
University Press.
10. Hoiem, D. E. and Sullivan, K. D. (1993). Designing and Using Integrated Data Collection and Analysis Tools: Challenges and Considerations. To appear in Behavior and
Information Technology, Special Issue on Usability Laboratories, Vol. 13, No. 2 (1994) 11. Karat, C.M. (1990). Cost-benefit Analysis of
Iterative Usability Testing. Interact '90, Proceedings of the IFIP TC 13 Third International Conference on Human-Computer Interaction. August, 1990.
12. Kennedy, S. (1989). Using video in the BNR usability lab. SIGCHI Bulletin, 21(2), 92-95. 13. Losada, M. and Markovitch, S., (1990).
“GroupAnalyzer: A System for Dynamic Analysis of Group Interaction”, Proceedings of the 23rd
Annual Hawaii International Conference on System Sciences, IEEE Computer Society,
101-110.
14. Mackay, W.E. (1989). EVA: An experimental video annotator for symbolic analysis of video data. SIGCHI Bulletin, 21(2), 68-71.
15. Mantei, M. M., Baecker, R. M., Sellen, A. J., Buxton, W. A. S., Milligan, T. (1991). Experiences in the Use of a Media Space.
Proceedings of Human Factors in Computing
(CHI '91), p. 203-209.
16. Nielsen, J. (1993). Usability Engineering. Academic Press: San Diego, CA.
17. Norman, D.A. and Draper, S.W. (1986). User
Centered System Design: New Perspectives on Human-Computer Interaction. Hillsdale, N.J.:
Erlbaum.
18. Olson, G. M. and Olson, J. S. (1991). User-centered Design of Collaboration Technology.
Journal of Organizational Computing. 1. pp.
61-83.
19. Potel, M.J., Sayre, R.E. and MacKay, S.A., (1980). “Graphics Input Tools for Interactive Motion Analysis,” Computer Graphics and
Image Processing 14, 1988, 1-23.
20. Roschelle, J. and Goldman, S. (1991). VideoNoter: A Productivity Tool for Video Data Analysis. Behavior Research Methods, Instruments and Computers. Vol 23, pp.
219-244.
21. Sanderson, P.M. (1993). Designing for simplicity of inference in observational studies of process control: ESDA and MacSHAPA. Proceedings of
the Fourth European Conference on Cognitive Science Approaches to Process Control (CSAPC '93): Designing for Simplicity .
22. Sanderson, P. and Fisher, C. (1994). Introduction to the Special Issue on Exploratory Sequential Data Analysis, HCI Journal, Vol. 6, No. 4. 23. Suchman, L.A. (1987). Plans and Situated
Actions: The Problem of Human-Machine Communication. Cambridge: Cambridge University Press.
24. Tukey, J.W. (1977). Exploratory Data Analysis. Reading, MA: Addison-Wesley.
25. Wickens, C.D. (1992) Engineering Psychology
and Human Performance, Second Edition.