Performance Assessment of the Optimum Feature
Extraction for Upper-limb Stroke Rehabilitation
using Angular Separation Method
Mohd Saiful Hazam Majid
1,2,3, Wan Khairunizam
1,2, Hashimah Ali
2, I. Zunaidi
2, Shahriman AB
2, Zuradzman
MR
2, Hazry D
2and Mohd Asri Ariffin
41Advance Computing and Sustainable Research Group (AICOS), UniMAP,
2School of Mechatronic Engineering, Universiti Malaysia Perlis (UniMAP), Pauh Putra Campus, 02600 Arau, Perlis, Malaysia.
3Bahagian Sumber Manusia, Majlis Amanah Rakyat (MARA)
4School of Health Sciences Kampus Kesihatan Universiti Sains Malaysia, 16150 Kubang Kerian, Kelantan, Malaysia. [email protected]
Abstract—Most of the human everyday activities will require
the use of their upper-limb muscles. The pattern of upper-limb muscle movement can be used to estimate upper-limb motions. Fundamental arm movement which is part of upper-limb muscle rehabilitation activity has been studied in order to investigate the time domain features, frequency domain, and time-frequency domain from the surface electromyogram (sEMG) signal of the upper-limb muscle. The relationship of electromyogram (EMG) signal and the rehabilitation exercise of related upper limb muscles movements are analyzed in this study. Then the features from the three domains were compared using Angular Separation Method to determine optimal feature. The result shows that MinWT has the best value of similarity which is 0.98, followed by a MeanWT feature which resulted in 0.91 of similarity. These results of EMG signal feature extraction can be used later in the study of human upper-limb muscle especially for analyzing EMG signal from patient undergone a rehabilitation treatment.
Index Terms—Angular Separation Method; Electromyogram
(EMG); Feature Extraction, Rehabilitation; Upper-limb.
I. INTRODUCTION
According to National Stroke Association of Malaysia (Nasam) [1], a large number of new stroke patient listed in Malaysia each year with an estimation of 40,000 people. Stroke patient could experience one side of their body to become paralyzed, a medical condition which is called hemiplegia, or one side of their body to become weak, a condition termed as hemiparesis. These conditions will effect the quality of life of the patients to perform daily activities such as eating, drinking, brushing teeth, combing hair and washing face. The main goal of stroke rehabilitation is to regain independence and improve life’s quality [2]. Specifically, upper-limb rehabilitation will aim stroke patient to be able to control their limb and have stronger and healthier muscle so that they will be able to perform their everyday task without being dependent of others and thus will get their quality of life back. Consequently, the optimum method needs to be selected to provide the appropriate and the good result of stroke rehabilitation. In this research, the surface electromyography (sEMG) signals of stroke patient performing upper-limb rehabilitation will be analyzed and optimum muscle and feature extraction will be selected.
The upper-limb rehabilitation will be done based on fundamental arm movement and functional arm movement. Among the objective is for the stroke patient to regain its muscle strength and coordination so that they can function as normal as before the stroke attack and gain quality of life. The research of using sEMG signal to study muscle performance during upper-limb rehabilitation has yet to be explored especially in the aspect of determining the best muscle to be monitored and to be evaluated. Furthermore, in a recent trend where rehabilitation is to be performed at home or without hospitalization, the flexible and user-friendly rehabilitation system needs to be designed such as the selection of optimum muscle to monitor patient performance and progress. In addition, the selection of optimum feature extraction could reduce the complexity of the system and calculation time.
Monitoring of sEMG signal is the main feature of this upper-limb rehabilitation research works. Electromyography is the study of muscle function through analysis of the electrical signals emanated during muscular contractions and activation of the muscle [3]. So studies of EMG are for the purposes of analyzing the relationship of muscular function to movement of the body segments and evaluate the timing of muscle activity as well as muscle activation pattern with regard to the movements of muscle [3]. There are two types of electrodes used to record EMG signal from a person which are fine wire electrodes and surface electrodes hence the name surface EMG coming from the fact that surface electrodes techniques are used for signal recording. Further information on how the sEMG signal being acquired and processed will be discussed in the next section.
This paper presents a performance assessment of the feature extraction method for the upper-limb stroke rehabilitation. Section II describes the background study of feature extraction technique used in sEMG signal processing. Sections III contains methodology which describes the proposed work, experimental setup and signals processing technique used. Results and discussion explained in Section IV while conclusions discussed in Section V.
II. LITERATURE REVIEW
Feature extraction is the transformation of raw signals into a set of parameters that represent the signal. This is necessary
to minimize the complexity of implementation and to reduce the cost of information. Generally, features extraction from sEMG signal can be obtained in the time domain, frequency domain and time-frequency domain [4]. The advantages of using time domain in parameters extraction are easy and quick. Besides, it has lower computational complexity [5]. Based on numerous studies, the selection of parameters in time domain ought to be carefully considered. It was found that a lot of redundant time domain parameters were used to extract muscle fatigue signals, but the results were not reliable because it has lower accuracy [4]. However according to Fernando D Farfán in his paper, in time domain there are two parameters that are commonly used in EMG feature extraction which are the root-mean-squared (RMS) value and the average rectified value. According to him also, both parameters are good where EMG signal amplitude could be obtained from them [6].
On the other hand, processing EMG signal in frequency domain would be required if the signal’s frequency information is needed for example in studying muscle fatigue. In this case feature like power spectral density (PSD) in frequency domain could be used [7-9]. However, there is also the drawback of analyzing EMG signal using frequency domain where time information is excluded.
To move on further, there is also research on presenting feature extraction in time domain specifically using Wavelet Transform analysis [7, 10, 11]. The time-frequency domain analysis is said to be the solution which cannot be solved by time domain analysis which is lack of frequency information and to be the solution which cannot be settled by frequency domain analysis which is lack of timely information. In fact since the nature of EMG signal is a non-stationary signal, so the time domain analysis will be the best tool to process this particular biomedical signal [12]. According to S. Sharma et. al. in their paper [13] however, a high-dimensional feature vector will be produced if signal analysis is performed using Wavelet Transform. Since among the objective of the designed technique is to reduce time-consuming, an increase in high-dimensional feature vector could mean an increase in computational time thus it is not desired. As a result, they advised in wavelet analysis; it is important to select an optimal dimensionality reduction method to solve the problems.
So in conclusion, there are pros and cons of feature extraction in the three domains. However, the research in this area of determining best feature will be much according to the objective of their research. For this study, 17 features from the three domains have been applied to find an optimal feature that will be used later in our research project which is designing an upper-limb rehabilitation system for post stroke patient using sEMG signal as patient improvement indicator. Thus the selection of optimal method, hence simpler and time efficient systems is highly desired. So for this study, root mean square, integral of EMG, simple square integral, mean absolute value and modified mean absolute value of time domain are applied. Feature such as auto regressive, total power and mean frequency of frequency domain are also applied for comparison. Besides feature in the previous two domains, feature in time frequency domain are applied to justify the optimal results. Some researcher use a method such as Euclidean Distance to select optimal feature [14], but in this study, we analyze and compare the extracted features using Angular Separation method.
III. METHODOLOGY
A. Flowchart of the Proposed Work
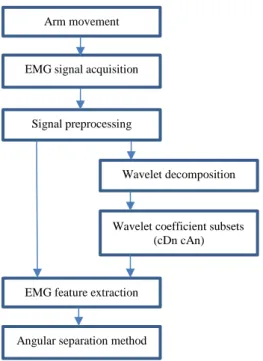
Figure 1 shows the flowchart of the proposed work for this research. Subjects were asked to perform fundamental arm movement which is elbow flexion four times to record sEMG signal from bicep brachii muscle. The signals were then being extracted to obtain 17 features and consecutively the features will be further analyzed using Angular Separation Method to find optimum one.
Figure 1: Flowchart of the proposed work
B. Experimental Protocol a. Subject
The subject selected in this study were coming from the healthy male subject, five person ages between 21 to 27 years old. To further narrow the scope, only right-handed subject were selected.
b. System Design
This fundamental EMG bio-amplifier system has been used as equipment for acquiring sEMG signal. Figure 1 also can be regarded as the block diagram of the system for this experiment.
These electrodes of type silver-silver-chloride (Ag/AgCl) self-adhesive were used in the designs that were placed on subject’s skin to capture the sEMG voltage signal. In the study, muscle belly of bicep brachii muscle were selected as the placement of electrodes while reference electrode were placed at the bony area of subject’s other hand. The Ag/AgCl electrodes are chosen for this experiment due to their half-cell potential is closer to zero. A total of three Ag/AgCl electrodes were used in this experiment for each subject. Figure 2 shows the electrodes placement of the subject muscle.
Arm movement
EMG signal acquisition
Signal preprocessing
EMG feature extraction
Wavelet decomposition
Wavelet coefficient subsets (cDn cAn)
Figure 2: Electrodes placement on bicep muscle
The placement of surface electrodes is among the crucial issue in EMG signal recording. According to Ahamed et. al. in their paper[15], the best result could be obtained if the electrodes were placed at muscle belly of the selected muscle. Besides electrodes placement skin preparation prior to any experiment recording is also important and has to be neatly prepared to avoid unwanted noise in the recorded data. So, in this study, electrodes placement and skin preparation were done in according to the procedure specified by SENIAM (Surface Electromyography for the Noninvasive Assessment of Muscles) and ISEK (International Society of Electrophysiology and Kinesiology).
Subsequently, the signal was amplified and recorded by using PHYWE COBRA3 bio-amplifier depicted in Figure 3 at a sampling frequency of 1 kHz. The signal was then transferred and processed by MATLAB software in a personal computer whereas among the early process is rectification and filtration. Further elaboration on the technique will be discussed in the next section.
Figure 3: Bio amplifier PHYWE COBRA3
C. Signal Processing
In this experiment, subjects were asked to perform fundamental arm movement which is elbow flexion for four times. Each subject performs two trial of the fundamental movement and data were recorded while the subject performs the movement in sitting position where their hand were rested on a table initially. EMG data obtained from two electrodes placed on the muscle belly of bicep brachii of each subject.
In the rectification process, all the negative values of the signal were translated to positive values for the next process. This is to ensure that that data will not be zero if the averaging of the mean were to take in the next step. For the filtration process, the Butterworth low pass filter of the order of five has been used in accordance with previous literature and the cut-off frequency was set at 10 Hz to attenuate noise. Later, the linear envelope of the signal as described by R. Suhaimi et. al. in their paper [16] was obtained.
Afterwards seven-time domain variables are measured as a function of time [17]. Because of their computational simplicity, time domain features or linear techniques are the most popular in EMG pattern recognition. Integrated EMG
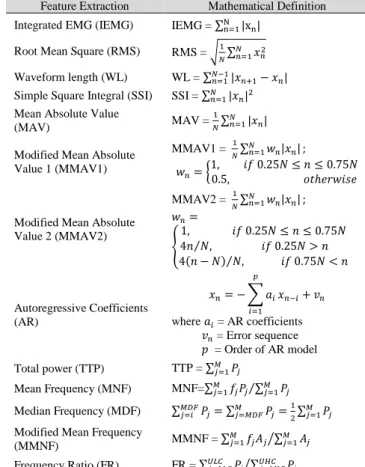
(IEMG), Root mean square (RMS), Waveform length (WL), Simple square integral (SSI), Mean absolute value (MAV), Modified mean absolute value 1 (MMAV1), Modified mean absolute value 2 (MMAV2) of EMG are used to test the performance. All of them can be done in real-time and electronically and it is simple for implementation. Features in this group are normally used for onset detection, muscle contraction and muscle activity detection. Moreover, features in the frequency domain are used to represent the detect muscle fatigue and neural abnormalities, and sometime are used in EMG pattern recognition. Six features in frequency spectrum are performed namely Autoregressive coefficients (AR), Total power (TTP), Mean frequency (MNF), Median frequencies (MDF), Modified mean frequencies (MMNF) and Frequency ratio (FR) [17,18]. Table 1 shows the mathematical definition of features in the time domain and frequency domain that has been applied in this study.
Table 1
Mathematical definitions of 13 sEMG feature extraction methods. Let xn
represents the nth sample of the sEMG signal (S). N denotes the length of
the sEMG signal. wn is the continuous weighting window function. The
threshold is used to avoid low-voltage fluctuations or background noises. Pj
is the sEMG power spectrum at frequency bin j. Aj is the sEMG amplitude
spectrum at frequency bin j. fj is the frequency of the sEMG power
spectrum at frequency bin j. M is the length of the frequency bin [17,18]
Feature Extraction Mathematical Definition
Integrated EMG (IEMG) IEMG = ∑Nn=1|xn|
Root Mean Square (RMS) RMS = √𝑁1∑𝑁𝑛=1𝑥𝑛2
Waveform length (WL) WL = ∑𝑁−1𝑛=1|𝑥𝑛+1− 𝑥𝑛|
Simple Square Integral (SSI) SSI = ∑𝑁𝑛=1|𝑥𝑛|2
Mean Absolute Value
(MAV) MAV =
1 𝑁∑ |𝑥𝑛|
𝑁 𝑛=1 Modified Mean Absolute
Value 1 (MMAV1) MMAV1 = 1 𝑁∑ 𝑤𝑛|𝑥𝑛| 𝑁 𝑛=1 ; 𝑤𝑛= {1,0.5, 𝑜𝑡ℎ𝑒𝑟𝑤𝑖𝑠𝑒𝑖𝑓 0.25𝑁 ≤ 𝑛 ≤ 0.75𝑁
Modified Mean Absolute Value 2 (MMAV2) MMAV2 = 1 𝑁∑ 𝑤𝑛|𝑥𝑛| 𝑁 𝑛=1 ; 𝑤𝑛= { 1, 𝑖𝑓 0.25𝑁 ≤ 𝑛 ≤ 0.75𝑁 4𝑛 𝑁,⁄ 𝑖𝑓 0.25𝑁 > 𝑛 4(𝑛 − 𝑁) 𝑁, 𝑖𝑓 0.75𝑁 < 𝑛⁄ Autoregressive Coefficients (AR) 𝑥𝑛= − ∑ 𝑎𝑖 𝑝 𝑖=1 𝑥𝑛−𝑖+ 𝑣𝑛 where 𝑎𝑖 = AR coefficients 𝑣𝑛 = Error sequence 𝑝 = Order of AR model Total power (TTP) TTP = ∑𝑀𝑗=1𝑃𝑗 Mean Frequency (MNF) MNF=∑𝑀𝑗=1𝑓𝑗𝑃𝑗⁄∑𝑀𝑗=1𝑃𝑗 Median Frequency (MDF) ∑𝑀𝐷𝐹𝑗=𝑖 𝑃𝑗= ∑𝑀𝑗=𝑀𝐷𝐹𝑃𝑗=12∑𝑀𝑗=1𝑃𝑗
Modified Mean Frequency
(MMNF) MMNF = ∑ 𝑓𝑗𝐴𝑗
𝑀
𝑗=1 ⁄∑𝑀𝑗=1𝐴𝑗
Frequency Ratio (FR) FR = ∑𝑈𝐿𝐶𝑗=𝐿𝐿𝐶𝑃𝑗⁄∑𝑈𝐻𝐶𝑗=𝐿𝐻𝐶𝑃𝑗
Besides features in Table 1, features in time-frequency domain were used to do the non-stationary signal analysis [19]. This is due to the drawbacks of time domain feature extraction where the result is not consistent with the non-stationary nature of EMG signal as according to comment by F. A. Mahdavi and his friends in their research paper [12] while features extracted in the frequency domain has the problem of not having access of time domain. So four extracted features in time-frequency domain that were
derived from Wavelet Transform analysis are Minimum value, Maximum value, Mean, and Standard Deviation.
Wavelet analysis based feature extraction for EMG pattern classification usually requires using best Mother Wavelet to uplift the functionality of EMG classification. Some other researchers had used db2 considering the good operation of Daubechies family in EMG feature extraction [12], but in this study, db7 is used.
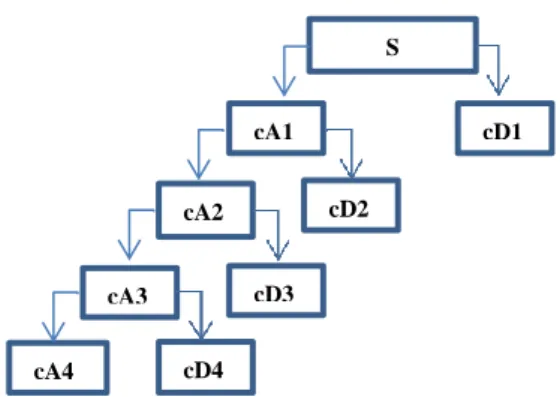
Four levels' decomposition (see Figure 4) of the signal was performed using Mallat algorithm. cA is low-frequency components of the signals, often called approximations. cD is the high-frequency components, called details. After the wavelet transforms, the low frequency and the high frequency are separated from the signal (S) to obtain approximate values (cA) and detail values (cD), respectively, as demonstrated in Figure 4. From the figure, a one-dimensional wavelet is used to decompose an original signal into four levels [18] that can be represented in Equation (1).
Figure 4: Four levels wavelet decomposition tree
S = cA5 + cD1 + cD2 + cD3 + cD4 (1)
From here, the feature extractions were accomplished by using Minimum value (MinWT), Maximum value (MaxWT), Mean (MeanWT), and Standard Deviation (SDWT).
In this study, prior to feature extraction step the preprocessed EMG signal will first be segmented to 256ms adjacent windowing technique as suggested in [12]. This is done to create extracted feature waveform from the sEMG signal so that the waveform is easier to visualize by the researcher for further analysis. In this case, the extracted feature waveforms will be compared in the next method to determine the optimum feature. Furthermore, the windowing technique for EMG signal analysis could also be used to avoid more information losses while performing feature extraction on the whole signal data points.
The final step in the signal processing stage is the Angular Separation Method. This method has been used to evaluate which feature gives the best similarity measurement result. According to Kardi Teknomo in [20] the formula of Angular Separation can be expressed as:
𝑆
𝑖𝑗=
∑ 𝜒𝑖𝑘 × 𝜒𝑗𝑘 𝑛 𝑘=1 √(∑𝑛 𝜒𝑗𝑘2 𝑘=1 ×∑𝑛𝑟=1𝜒𝑗𝑟2) (2)where: 𝜒𝑖𝑘 = Element kth of signal i 𝜒𝑗𝑘 = Element kth of signal j
In this research, the two extracted EMG signal for each feature recorded on either same subject with a different trial
or from two different subjects were analyzed using Equation (2). Results of the experiment and the comparison between features are discussed in the next section.
IV. RESULTS AND DISCUSSION
The result of the filtered signal is the removal of the unwanted noise from raw EMG signal such as movement artifact, DC offset as well as to attain only the desired sEMG frequency where the pass band lies in 10 to 500 Hz. Among the goal of the research is to study muscle activation pattern that is the pattern of the onset of the EMG amplitude when there is a contraction where the muscle involves, in this case, is the bicep brachii muscle. So from graph depicted in Figure 5, its can be seen that the amplitude arises to its maximum value 4 times hence the subject flexed their elbow four consecutive times. The timing for each contraction to occur was not measured specifically because our goal is to do rehabilitation on real stroke patient where only amplitude pattern will be monitored. In this figure, there is four peaks of amplitude, and the highest is 0.21 mV. The peak voltage differs between the four peaks due to the inconsistency of muscle contraction and force produce by subject’s hand movement probably due unfamiliarity with the exercise and the muscle fatigue [21].
The main result for this paper was tabulated in Table 2 where 17 features extraction techniques were applied to gain useful information of the recorded EMG signal. At a time two EMG signals were analyzed to obtain two versions of each feature. Then they will be analyzed using angular separation method to check similarities between the waveforms where the most similar waveform comparison will get the result almost to 1.0. In the table, for angular separation result between different subjects waveform, feature MinWT gave the highest score which is 0.98 followed by 0.91 by MeanWT. Similarly the result for waveform extracted from EMG signal of the same subject with two trials, MinWT gave the highest score which is 0.97 while MeanWT gave 0.95. The consistency of the result was obtained when angular separation method was applied to compare extracted features with more subjects and more trials.
So in future, if less computational time is required and the optimum result is desired in EMG signal processing, MinWT will be the best-selected feature to extract. Next would be the MeanWT features.
Figure 5: Filtered EMG signal for bicep muscle contraction
0 0.5 1 1.5 2 2.5 x 10⁴ 0 0.05 0.1 0.15 0.2 0.25
Filtered EMG Signal
sample a m pl it ude (m V ) S cA1 cD1 cD2 cA2 cD3 cA3 cD4 cA4
Table 2
Angular Separation Result of 17 Features Extracted from EMG Signal
Feature Angular Separation Result Between Different Subject Angular Separation Result Between Different Trial for a
Subject IEMG 0.64 0.70 RMS 0.64 0.70 WL 0.62 0.60 SSI 0.51 0.63 MAV 0.64 0.70 MMAV1 0.64 0.70 MMAV2 0.62 0.72 AR 0.82 0.87 TTP 0.51 0.62 MNF 0.77 0.71 MDF 0.51 0.62 MMNF 0.76 0.65 FR 0.63 0.39 MinWT 0.98 0.97 MaxWT 0.46 0.46 MeanWT 0.91 0.95 SDWT 0.47 0.49 V. CONCLUSION
This research paper presents a method to determine optimum feature extraction of sEMG signals acquired from five healthy subjects performing fundamental arm movement. Seventeen popular feature extractions from the time domain, frequency domain and time-frequency domain have been tested. By using angular separation technique, the result shows that MinWT gives the optimum result and can be used for further upper limb rehabilitation activity. These two results will now be used in further research work of upper limb rehabilitation such as in developing rehabilitation system using virtual reality environment.
ACKNOWLEDGMENT
This work was supported by UniMAP Advance Computing and Sustainable Research Group (AICOS) and School Of Mechatronics Engineering, Universiti Malaysia Perlis (UniMAP). The authors would like to thank all members of the groups in providing support material and moral support. Last but not least, the authors would like to thank Majlis Amanah Rakyat (MARA) for their support in making this study a success.
REFERENCES
[1] "Stroke in Malaysia: What is a stroke?" Retrieved from
http://www.nasam.org/english/prevention-what_is_a_stroke.php, 2017.
[2] W. Chuanchu, P. Kok Soon, A. Kai Keng, G. Cuntai, Z. Haihong, L.
Rongsheng, K. S. G. Chua, A. Beng Ti, and C. W. K. Kuah, "A feasibility study of non-invasive motor-imagery BCI-based robotic rehabilitation for Stroke patients," in 4th International IEEE/EMBS Conference on Neural Engineering, 2009., 2009, pp. 271-274.
[3] G. S. Rash, “Electromyography Fundamentals,” Retrieved from
papers3://publication/uuid/F8E3A390-2C75-42E6-9F0C-768A97087B38, 2008.
[4] Phinyomark, A., Phukpattaranont, P. & Limsakul, C (2012). Feature
reduction and selection for EMG signal classification. International Journal of Physical Sciences. 39(1), 7420-7431.
[5] Wan Daud, W. A. B., Yahya, A. B., Horng, , C. S., Sulaima, M. F. &
Sudirman, R. (2013). Feature Extraction of Electromyography Signals in Time Domain on Biceps Brachii Muscle. International; Journal of Modeling and Optimization. 3(6), 3-7.
[6] Fernando D Farfán, Julio C Politti and Carmelo J Felice, “Evaluation
of EMG processing techniques using Information Theory,” published in BioMedical Engineering OnLine, 2010, DOI: 10.1186/1475-925X-9-72
[7] C. J. DeLuca. (1997) Surface Electromyography Detection and
Recording [Online]http://www.delsys.com/library/tutorials.htm
[8] S. Kumar and A. Mital, Electromyography in Ergonomics. London,
U.K.: Taylor and Francis, 1996.
[9] J. S. Lee. (1998, Oct.) “EMG page”. [Online]. Available:
http://home.earthlink.net/~leejs/EMG.html
[10] Dinesh Kant Kumar, Nemuel D. Pah, and Alan Bradley, “Wavelet
Analysis of Surface Electromyography to Determine Muscle Fatigue,” published in IEEE TRANSACTIONS ON NEURAL SYSTEMS AND REHABILITATION ENGINEERING, 2003, Vol. 11, ISSN Print: 1534-4320.
[11] M.H. Pope, et. al., “Evaluation of low back muscle surface EMG
signals using wavelets,” published in Clinical Biomechanics, 2000, Vol. 15, https://doi.org/10.1016/S0268-0033(00)00024-3.
[12] F. A. Mahdavi, S. A. Ahmad, M. H. Marhaban, M. R.
Akbarzadeh-T, “Surface Electromyography Feature Extraction Based on Wavelet Transform,” International Journal of Integrated Engineering, Vol. 4, No. 3, 2012, pp. 1-7.
[13] Sachin Sharma, Gaurav Kumar, Sandeep Kumar, Debasis
Mohapatra, “Techniques for Feature Extraction from EMG Signal,” published in International Journal of Advanced Research in Computer Science and Software Engineering, 2012, Vol. 2, ISSN: 2277 128X.
[14] A. Phinyomark, S. Hirunviriya, C. Limsakul, P. Phukpattaranont,
“Evaluation of EMG Feature Extraction for Hand Movement Recognition Based on Euclidean Distance and Standard Deviation,” International Conference on Electrical Engineering/Electronics Computer Telecommunications and Information Technology (ECTI-CON), 2010, Vol. 1, Issue 1, 2009, ISSN: 2151-9617.
[15] Nizam Uddin Ahamed, K. Sundaraj, R. B. Ahmad, S. A. M. Matiur
Rahaman, M. A. Islam, M. A. Ali, “Variability in surface electromyography of right arm biceps brachii muscles between male adolescent, vicenarian and tricenarian with distinct electrode placement,” published in IEEE Conference on Sustainable Utilization and Development in Engineering and Technology (STUDENT), 2012, ISSN Print: 1985-5753.
[16] R. Suhaimi, Aswad A.R, Nazrul H. ADNAN, Fakhrul Asyraf,
Khairunizam WAN, D. Hazry, Shahriman AB, Juliana A. Abu Bakar, Zuradzman M. Razlan, “Analysis of EMG-Based Muscle Activity for Stroke Rehabilitation,” 2nd International Conference on Electronic Design (ICED 2014), pp.167-170, 19-21 August 2014, Penang, Malaysia.
[17] A. Phinyomark, A. Nuidod, P. Phukpattaranont, and C. Limsakul,
“Feature Extraction and Reduction of Wavelet Transform Coefficients for EMG Pattern Classification,” Elektronika IR Elektrotechnika, Vol. 122, No. 6, 2012, ISSN Print: 1392 – 1215, ISSN Online: 2029 – 5731.
[18] A. Phinyomark, C. Limsakul, and P. Phukpattaranont, “A Novel
Feature Extraction for Robust EMG Pattern Recognition,” Journal of Computing, Vol. 1, Issue 1, 2009, ISSN: 2151-9617.
[19] K. Mahaphonchaikul, D. Sueaseenak, C. Pintavirooj, M.
Sangworasil, S. Tungjitkusolmun, “EMG Signal Feature Extraction Based on Wavelet Transform,” The 2010 ECTI International Conference on Electrical Engineering/Electronics, Computer, Telecommunications and Information Technology, 2010, ISBN Electronic: 978-1-4244-5607-9.
[20] Kardi Teknomo, “Angular Separation,” Retrieved from
http://people.revoledu.com/kardi/tutorial/Similarity/AngularSeparati on.html, 2015.
[21] M. G. Benedetti, V. Agostini, M. Knaflitz and P. Bonato,
“Applications of EMG in Clinical and Sports Medicine: Muscle Activation Patterns During Level Walking and Stair Ambulation,” book edited by Catriona Steele,2012, ISBN 978-953-307-798-7.