254
© Global Society of Scientific Research and Researchers http://asrjetsjournal.org/
Lung Cancer Detection and Analysis Using Data Mining
Techniques, Principal Component Analysis and Artificial
Neural Network
Kassimu Juma
a*, Ma He
b, Yue Zhao
caMaster Student, Northeastern University, Shenyang, China bAssociate Professor, Northeastern University, Shenyang, China
cProfessor, Northeastern University, Shenyang, China aEmail: [email protected]
bEmail: [email protected]
Abstract
The successful diagnosis of lung cancer disease in early time increases the percentage of patient survival. Effective ways for predict and treat lung cancer remain challenges due to lack of effective ways of detection the lung nodules which causes by their arbitrariness in shape, size and texture. In this paper, image processing is used for image pre-processing, image segmentation and feature extraction. Artificial neural network (ANN) have been employed to learn extracted feature for nodule detection such as shape, size, volume.While principal component analysis were employed for multivariate data processing, it used to detect the complexity of interrelationships between diverse patient, disease and treatment variables.MATLAB have been used for all procedure in processing lung image and artificial neural network for train features extracted. XLSTART software was used for principal component analysis. The lung cancer database which contains the images classify lung image into two kinds:1)Normal with no nodule and 2)nodule image such as benign or malignant.Therefore,by using the proposed method the accuracy obtained was 76%.
Keywords: Artificial Neural Network (ANN); Feature Extraction; Lung Database; Principal Component
Analysis (PCA); Region of Interest (ROI); Thresholding.
--- * Corresponding author.
255
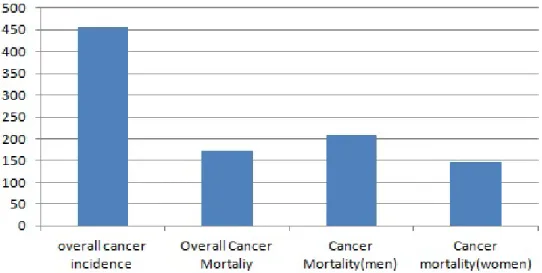
1. IntroductionLung cancer is the growth of nodule which take the shape of round object.However,these nodules that can be seen in CT-scan may not all be a lung cancer, it can be other disease such as pneumonia, tuberculosis or calcified franuloma.The lung cancer nodule is approximately round shape having the maximum diameter of 30mm[11].The detection of lung nodule is easy for isolated nodule in Ct-images and is most difficult for nodules which is attached to the pleural of vascular[11].The lung cancer is the most common cancer among a men diagnosed in 2012 with mainly cases from Asia and Africa[10].Figure-1 provides the facts of lung cancer per 100,000cases.
Figure 1: Lung cancer statistics.
The aim of this work is to create the system that will be able to identify the lung as cancer or no-cancer at early stage of the diagnosis by applying some image technique as shown in method propsed.And predicting the patient by using artificial neural network and identify the similarity and dissimilarity of patient variables by using principal component analysis.
2. Proposed Method
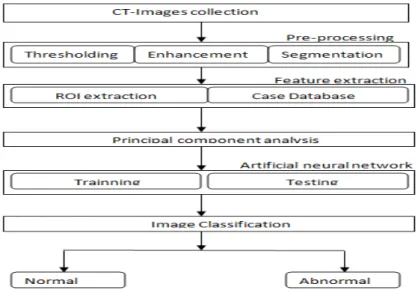
Our paper work aims to apply some data mining techniques in the form of CT-images for diagnosis of lung cancer in early stage. So we classify these images as normal or abnormal. The proposed methods(algorithm) consists of three stages as shown in figure-2.In the first stage, we applied pre-processing techniques to the images to get the better quality of data before feature extraction. Lung segmentation procedure to isolate lung from lung CT-images. Features are extracted from the cleaned images. The extracted features are stored in database for further classification. In second stage, we use ANN to train the features and classify the image. It classifies the image into a normal or abnormal.Onces a nodule has detected as normal the lung is classifies as non cancer and if is abnormal is classifies as lung cancer. In the third stage, we applied the principal component analysis to analyze the intercorrelation and multicolinearity among independent variables.
256
Figure 2: Stages for lung classification.
2.1. Image Pre-processing
In pre-processing stage, we begin by enhancing images so as to improve the lung image interpretability for human viewers. Image pre-processing involved thresholding, enhancement and segmentation. The DICOM image was converted to binary image by using a thresholding method. A global threshold can be used to convert intensity to binary image. It utilizes Otsu’s method, it slides to change the threshold values to minimize or maximize the intra-class variance of black and white pixels [1].Figure-3(a).
2.2. Image Enhancement
Image enhancement is the converting of image into better human perception of image information and interpretability. The enhancement method can be applied to image without spoil image; It categorized into two types, these are.
i) Spatial domain method
ii) Frequency domain method
In spatial domain method, the values of pixel are manipulated to achieve desired enhancement. In frequency domain, image is transferred to frequency domain by means of Fourier transformation and then reverse the Fourier transformation to get the resulted image [6]. Enhancement are performed to modify the image brightness, contrast and distribution of gray level.Figure-3(b)
2.3. Image Segmentation
The description and recognition of the lung nodule depend mostly on the segmentation result. We used thresholding segmentation techniques. Thresholding is the best method for image segmentation. The segmented
257
images through thresholding have been proposed because of the approximate intensity value between the lung nodule and unwanted background region. It creates an output image of the same size.Figure-3(c).
2.4. Feature Extraction
The nodule feature extraction is needed in our work, by using image processing algorithms we successful extract the features from the lung nodule. These extracted features were organized in database and it finally used to identify the lung as cancer or non-cancer [2]. Extracted features are considered as the factors for classification. In our system it involves two processing steps of extraction.
1) Extraction of unwanted lung and Region of interest by using thresholding we were able to identify the region of interest, and we use the freehand to crop the region of interest by selecting the region and double click on it. Figure-3(d).
2) Extraction of feature parameters.
These features were extracted from region of interest and it was used for classification process. The region extracted is shown in: Figure-3(e).
a)Area: It is the exactly number of pixels in ROI
𝐴𝐴𝐴𝐴𝐴𝐴𝐴𝐴=𝜋𝜋𝐴𝐴2 (1)
b) Diameter: is the distance between the circles through the center of the circle at the region of interest.
Diameter=√(4*Area)/ 𝜋𝜋 (2) c) Perimeter: It is the total distance around the region of interest.
Perimeter=2𝜋𝜋r (3)
d) Roundness (eccentricity): Is the circularity of the shape of the ROI and it is must be 1 for the circle or less than one for other shape.
Roundness= 4𝜋𝜋A perimeter2 . (4) e) Volume: 𝑣𝑣=4 3∗ 𝜋𝜋r3 (5) f) Centroid: x,y g) Mean intensity:
258
a) Original image b) Binary thresholding c) Image segmentation
d) Free hand selection d) Unwanted region e) Region of interest
Figure 3
2.5. Database
We built a case database which used to store all features that extracted from the image. We created our database by using mysql database. All features extracted were organized in database before selected some features and organized in dataset for further data analysis.Figure-4.
Figure 4: Mysql database used for stored extracted features.
2.6. Features Analysis
2.6.1. Artificial neural network
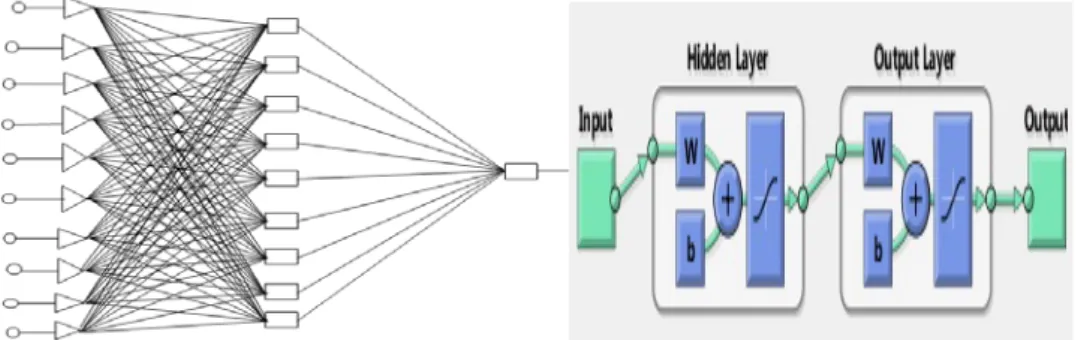
Artificial neural network is a mathematical model for computing biology neural networks. ANN is adapting and changes according to the information given to the network during the learning phase [1]. The neural network consists input layer, hidden layer and output layer. The number of input nodes in the input layer is equal to the number of attribute element in the dataset. In our system, the input layer had 6 nodes, In the hidden layer, we choice 10 nodes while the output layer consists of 6 nodes. The output node is considered in classifying the image. It classifies the image as cancer or non-cancer. We used feed-forward network with tan-sigmoid transfer function to generate the output.Figure-6. The input values were between +1 and -1 .Back-propagation was used
259
in the training phase to correct the error. The weight was fixed and adjusted to minimize the error and finally the better output was produced. Input features were separated into three sets:
• 75% are used for training
• 15% are used for validating the network and
• Last 15% for testing the network.
The network is adjusted until the out matches the target. The flow chart in figure-6 shows the brief description of feed forward back propagation algorithm for diagnosing lung cancer.
Figure 5: Architecture of neural network
Table 1: Showing Mean square error, regression and division of sample
Training Validation Testing
Classification% 60 20 20
Sample 48 16 16
MSE 1.91572e-1 1.91317e-1 2.34507e-1 R% 22.91666e-0 18.75000e-0 25.00000e-0
260
Our dataset consist of 80 patients, we classified the CT-image to either cancer or non-cancer. The network was adjusted by comparing the output and the target data. It will repeat until the network output matches the target data. The weight is adjusted to reduce the mean square error (MSE) between the output and the target value. Error value is shown in table-1.
2.6.2. Principal component Analysis (PCA)
Principal component analysis is a statistical method which was used to determine the projection of individual input variables, similarity and dissimilarities among the data.
Table 2: Covariance matrix
Variables Diameter
[mm]
Volume[mm3] Area[mm2] Perimete
r[mm] NoduleMass[g] PathologyD.M [mm] Diameter[mm] 64.0444053 75406.374 2670.782 201.099 77.980 62.167 Volume[mm3] 75406.374 96011343.17 3282545.697 236776.014 99932.532 72276.656 Area[mm2] 2670.782 3282545.697 114046.676 8386.257 3407.036 2576.530 Perimeter[mm] 201.099 236776.014 8386.257 631.45222 244.856 195.206 NoduleMass[g] 77.980 99932.532 3407.036 244.856 104.5081 74.568 PathologyD.M[mm] 62.167 72276.656 2576.530 195.206 74.568 84.43609
The principal component analysis of the 6*80 data matrix was performed by means of XLSTAT run on person computer. The following steps were considered when passing features to PCA.
i) Calculate the standard deviation of the features extracted and its mean using XLSTART. ii) Calculate the coefficients of the principal components and variances by calculating Eigen values. iii) Calculate the covariance matrix and extract the diagonal element which used to store the variance. iv) The maximum variance the maximum information content and the better for classification.
Table 3: Eigen values
PC1 PC2
Eigen Value 96124374.345 1874.635
Variability 99.998 0.002
261
Table 4: Eigenvectors. PC1 PC2 Diameter[mm] 0.001 0.050 Volume[mm3] 0.999 -0.034 Area[mm2] 0.034 0.984 Perimeter[mm] 0.002 0.158 NoduleMass[g] 0.001 -0.005 PathologyD.M[mm] 0.001 0.0583. Result and Discussion
The proposed system detect whether the lung image had cancer or non-cancer. The result obtained from the classification process of the lung image as shown in table-6.The classification accuracy varies due to the features of each image used. From the result obtain by using artificial neural network .It is showed that the has successful classifying the CT-lung image with high accuracy. In changing the number of neuron of the network, the best network obtained was that of 15 neuron which were chosen for the next variation of parameters. By using the PCA we obtained the similarity and dissimilarity of information provided by the feature variables. The more similar the variables the more effect of the variables in system for cancer detection. The table-2 shows the Covariance matrix of data in the system regarding their similarity. The distribution of patients on a plane with PC1 and PC2 can be obtained in the same way as the distribution of variables. The individual distribution in Eigenvector is shown in table-4 .The successful network has been developed and ready for the classification.
Table 5: Classification for different size of data
Size of individual data
(Training:validation:testing) Number of neuron Training classification Validation classification Testing classification 56:12:12 10 0.732 0.917 0.667 48:16:16 15 0.771 0.813 0.750 40:20:20 20 0.775 0.700 0.750
Table 6: Final result of ANN used
Recurrence No recurrence Classification%
Total 27 53 76
Correct 20 41 75
262
3.1. ClassificationLung nodule is a smallest growth in the lung .Cancer nodule tend to be larger than 30mm, and less than 33mm is non cancer nodule. The lung cancer nodule has the round shape.CT-used to identify the change in shape and size we extracted the features for identification in segmentation stage.
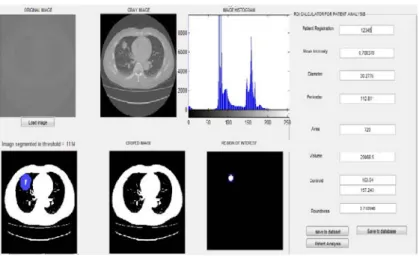
For abnormal lung.
Figure 7: Abnormal lung.
We firstly load the lung image and extract the features, and then we store the extracted features to the database. After we select some important features and add to the existing dataset and then we train them by using artificial neural network so as to identify whether the lung image is normal or abnormal. Figure-.
For Normal Lung.
Figure 8: Normal lung.
263
4. ConclusionLung cancer is the most dangerous cancer to a men and mostly growth all over the world as diagnosed in 2012.This shows the importance of diagnosis the lung cancer in early stage to reduce the percentage of its spreading. The diagnosis of lung cancer needs an efficient system to perform the best diagnosis. To obtain the high accuracy result, in our system we divided our work in four stages :1)image pre-processing, 2)image enhancement 3)image segmentation 4)features extraction 5)Data classification using the artificial neural network and last 6)we use the features analysis by using PCA to identify the contribution of variables factors.
Acknowledgements
First of all, I praise to the almighty God for providing me this opportunity and granting me the ability to successfully completing this work. This paper is successful completed in its current form because of the assistance and guidance from several people. I would like to sincere thanks to all of them.
I have no proper words to express my deep gratitude and respect to my first supervisor, Professor Zhao yue,for accepting me to be her student, she has inspired me and helped me to realize the exactly what do I want in my study and life in general and to work hard on it.
I would like to thanks my second supervisor, professor Ma He, the door was opened all the time for me whatever I have the problem or question about my research and writing. Thanks for your excellent technical assistance and suggestions, am grateful for your assisting me in different ways and kindly answer to my questions.
Finally, I would like to thank my parents, for all their support and unconditional love, sacrifice and
consideration throughout my years of study here in Northeastern University. It’s their unselfish care that helps
me finish this paper successfully. Thank you.
Reference
[1] Ge, Zhanyu, Berkman Sahiner, Heang-Ping Chan, Lubomir M. Hadjiiski, Jun Wei, Naama Bogot, et al. "Computer-aided detection of lung nodules: false positive reduction using a 3D gradient field method." In Medical Imaging 2004, pp. 1076-1082, 2004 May 12.
[2] Taylor, Stuart A., Rebecca Greenhalgh, Rajapandian Ilangovan, Emily Tam, Vikram A. Sahni, et al "CT Colonography and Computer-aided Detection: Effect of False-Positive Results on Reader Specificity and Reading Efficiency in a Low-Prevalence Screening Population 1." Radiology 247, no. 1 (2008): pp.133-140. 2008 Apr.
[3] Li, F. Engelmann, R. Metz, C.E. Doi, K. and MacMahon, H. “Lung Cancers Missed on Chest Radiographs: Results Obtained with a Commercial Computer-aided Detection Program” 1. Radiology, 246(1), pp.273-280, 2008 Jan.
264
[4] Endo, M, Aramaki, T., Asakura, K., Moriguchi, M., Akimaru, M., Osawa, A., Hisanaga, et al.” Content-based image-retrieval system in chest computed tomography for a solitary pulmonary nodule: method and preliminary experiments”.International journal of computer assisted radiology and surgery, 7(2), pp.331-338. 2012 Mar 1.
[5] The DICOM standards Committee.DICOM homepage http://medical.nema.org/,September 2004.
[6] Disha Sharma,Gagandeep Jindal,”Computer Aided Diagnosis System for Detection of Lung Cancer in CT scan images”,International Journal of Computer and Electrical Engineering,Vol.3,No.5, p.714.October 2011
[7] Penedo.M.G,Carreira.M.J,Mosquera.A and Cabello.D,”Computer-aided diagnosis:a neuralnetwork-based approach to lung nodule detection”,IEEE Transactions on Medical Imaging,vol:17,pp:872-880,1998
[8] Mr.Vijay A.Gajdhane,prof.Deshpande L.M,”Detection of Lung Cncer Nodule on Computer Tomography Images by using Image Processing”.
[9] National Cancer Institute.Retrieved 14 January,2015,from http://www.cancer.gov/about-cancer/what-is-cancer/statistics.
[10] Kausar, N., Samir, B.B. and Kuleev, R. “LUNG CANCER DETECTION USING SUPERVISED CLASSIFICATION WITH CLUSTER VARIABILITY ON RADIOGRAPHS DATA”. Women, 25, pp.19-04.2006
[11] Adam, B., Jerzy, Z., Jerzy, K. and Roman, K. A “principal component analysis of patients, disease and treatment variables: a new prognostic tool in breast cancer after mastectomy”. Reports of Practical Oncology & Radiotherapy, 5(3), pp.83-89. 2000 Nov.
[12] Floyd, C.E., Lo, J.Y., Yun, A.J., Sullivan, D.C. and Kornguth, P.J. “Prediction of breast cancer malignancy using an artificial neural network”.Cancer, 74(11), pp.2944-2948. 1994 Dec.
[13] Cox, G. S., F. J. Hoare, and G. de Jager. "Experiments in lung cancer nodule detection using texture analysis and neural network classifiers." InThird South African Workshop on Pattern Recognition, vol. 31. 1992.
[14] M.G.Penedo,M.J.Carreira,A.Mosquera and D.Cabello,”Computer aided diagnosis:A neural network based approach to lung nodule detection”,IEEE Trans.on Medical Imaging ,vol.17,N6.pp.872-880,1998.
[15] Anirudh, Rushil, Jayaraman J. Thiagarajan, Timo Bremer, and Hyojin Kim. "Lung nodule detection using 3D convolutional neural networks trained on weakly labeled data." In SPIE Medical Imaging, pp.
265
978532-978532. International Society for Optics and Photonics, 2016.
[16] Stefan Diederich et al.,”screening for early lung cancer with low-dose spiral CT:prevalence in 817 asymptomatic smokers”,Radiology,vol.222,no.3,pp.773-781,2002.
[17] Ashis Kumar Dhara,Chanukya Krishna chama and Sudipta Mukhopadhyay,”Content-based image retrieval system for differential diagnosis of lung cancer”.
[18] Zhou, Z.H., Jiang, Y., Yang, Y.B. and Chen, S.F. “Lung cancer cell identification based on artificial neural network ensembles”. Artificial Intelligence in Medicine, 24(1), pp.25-36. 2002 Jan 31.
[19] M.Gomathi and P.Thangaraj,”computer Aided Medical Diagnosis system for detection of lung cancer nodule a survey,”The Library,pp.3-12,2012.
[20] A.A.Abdullah and S.M.Shaharum,”Lung cancer cell Classification Method using artificial neural network”,information engineering letters,vol.2,1,pp.49-59,2012
[21] Y.Singh and A.S.Chauhan,”Neural networks in data mining,”Journal of Theoretiecal and Applied Information Technology,2005-2009.
[22] M.H.Beale,M.T.Hagan and H.B.Demuth,”Neural Network”,The mathWorks,1992-2012.
[23] Zubi, Z.S. and Saad, R.A. Improves Treatment Programs of Lung Cancer Using Data Mining Techniques. Journal of Software Engineering and Applications, 7(2), p.69,2014 Feb.