Forecasting regional labour-market developments
by occupation and education
*Frank Cörvers
**and Maud Hensen
Abstract
The paper presents a model that covers the whole regional labour market with regard to detailed occupational groups and types of education. In drawing up regional labour-market forecasts, an approach was chosen in which regional forecasts of employment growth per sector of industry, the age composition and the participation rates at the regional level and the regional distribution of working youngsters with a particular type of education are important inputs. The advantages of this approach are the consistency of the national with regional forecasting of the labour market, and the allowance for interactions between different segments on the regional labour market. Another advantage is that in spite of data constraints a fairly high level of disaggregation by occupation and education can be achieved at the regional level. However, the regional model hardly deals with changes in the mobility flows of workers between regions. The relevance of these flows is dependent on to what extent labour-market developments in the own region respond to mismatches between occupation and education (gaps) in other regions. Further research is required to incorporate these adjustment processes into the regional forecasting model.
*
Paper presented at the international conference Systems, institutional frameworks and processes for early identification of skill needs, 25–26 November 2004, Dublin, Ireland. This paper will be published in the book A survey of spatial-economic planning models in the Netherlands. Theory, application and evaluation edited by van Oort F.; van Wissen L. and Thissen M.
**
Corresponding author
Research Centre for Education and the Labour Market (ROA) Maastricht University PO Box 616 NL-6200 MD Maastricht The Netherlands E-mail: [email protected] Tel: (31-43) 3883647 Fax: (31-43) 3884914 http://www.roa.unimaas.nl
Table of contents
1. Introduction ... 3
2. Basic principles and structure of the forecasting model ... 5
2.1. Structure of the labour-market forecasting model... 7
2.2. Expansion demand ... 9
2.3. Replacement demand ... 11
2.4. Inflow of school-leavers onto the labour market... 12
2.5. Labour-market gap indicator ... 13
3. Application of the regional labour-market forecasting model ... 14
3.1. Forecasting results for the Province of Gelderland ... 14
3.2. Commuting flows and the inflow of school-leavers onto the regional labour market ... 16
4. Final remarks... 18
1.
Introduction
For the Netherlands the Research Centre for education and the labour market (ROA) biennially publishes the report The labour market by education and occupation to 2000 (1), which includes analyses of expected labour-market developments in the light of particular policy issues. Since the matching problems between labour supply and demand can be regional in nature, ROA conducts forecasts for three Provinces of the Netherlands (Limburg, Gelderland and Overijssel), which are published in reports that are largely comparable to the national report. The regional labour-market forecasting by occupation and education is based on the methodology used to forecast national labour-market developments. An advantage of this approach is that the forecasts for the regional demand and supply are consistent with the national forecasts.
The general forecasting model for the whole labour market and data from national and regional sources are combined to serve two main functions of labour-market forecasts: policy and information (Van Eijs, 1994). The policy function refers to the usefulness of labour-market forecasts for policy-makers at ministries, public employment services and employment agencies, employers’ organisations, unions and educational organisations. By taking account of future employment trends of broadly defined educational (both level and direction) and occupational classes, they are able to propose or carry out required changes in the educational infrastructure. Forecasts at the national and the regional level that focus on the macroeconomic or industry level – as usually is the case – do not allow to detect changes in the occupational mix within sectors of industry or the continuous upgrading of the skill level within many occupations. Furthermore, since the forecasting model covers the whole labour market, it can account for interactions between different segments on the labour market. Partial analyses of the labour market often fail to include these interactions (2).
The information function originally focused on study and career guidance. This improves the functioning of the labour market, since individuals are more able to adjust their human capital investment decisions to labour-market prospects of types of education (Borghans, 1993). Also firms and labour-market agencies may use labour-market forecasts as ‘early warnings’ on future recruitment problems to outline human resources policies or to design training programmes. Therefore, the labour-market information provides a detailed insight into the current and future labour-market position of 104 types of education and 127 occupational groups. In other countries comparable occupational forecasts are published by, for example, the Bureau of Labour Statistics in the US and ESRI in Ireland (for an overview in OECD countries see Neugart et al., 2002). All these models assume that labour-market imbalances may exist due to market imperfections. Providing individuals with information about future developments in
(1) For example ROA (1995, 2001, 2003abcd) and Cörvers et al. (2002).
(2) For example, an analysis of the labour market for engineers should include the developments within the manufacturing industry as well as in other sectors of industry.
labour demand and supply for different occupational groups and types of education may reduce cobweb-type ups and downs.
This chapter deals with the forecasting model of the Dutch labour market and its regions, which has been developed by ROA. The chapter is structured as follows. Section 2 first discusses the basic principles underlying ROA’s labour-market forecasting. Subsequently, the most important parts of the forecasting model are discussed, i.e. the expansion demand, the replacement demand, the inflow of school-leavers onto the labour market, and the labour-market gap indicator. Section 3 presents an application of regional labour-market forecasts for the Province of Gelderland. Section 4 draws some conclusions.
2.
Basic principles and structure of the forecasting
model
(
3)
In the past, it was thought that the coordination between the education system and the labour market could be solved by planning. One well-known approach is the ‘manpower requirement model’ as applied, for example, by Parnes (1962), who developed a manpower planning model on the basis of the input-output structure of the economy. Various methodological and fundamental objections have been made to the manpower requirements approach. The methodological objections focus particularly on the fixed coefficients, which are used in the forecasting models to translate economic development into changes in employment differentiated by training and occupation, and on its mechanical concept of labour-market functioning, in which there is no place for the working of substitution and other adjustment processes (Blaug, 1967). The fundamental objections are that future developments are not in fact sufficiently predictable, and that an exclusive relationship between job requirements and training is assumed without adequate justification.
These objections, and the lack of sufficient statistical data for the estimation of the forecasting models, led to the rejection of the planning concept. A flexible approach to education was advocated, one which would enable an adequate response to uncertain future developments. According to the latter concept, initial training courses should be broadened so that each could lead to a broad range of occupations. Any discrepancies which might arise between specific, and mutable, job demands and the qualifications of workers would have to be dealt with by means of short training courses and on-the-job training.
Furthermore, it was no longer thought that a policy of direct intervention was required to ensure the correspondence of the education system to the labour market, but rather that the provision of adequate information would make the labour market more transparent for those choosing a course of study and others investing in education. This transparency would enable the supply of labour to be more responsive to changes on the labour market. Moreover, the labour-market forecasts give firms an indication of the future risk of labour recruitment problems for the various skill categories, which enable them to anticipate to future shortages, for example by internal training and outflow reduction policies for categories of workers for which future shortages are forecasted. This development is evident in the completely changed role of manpower forecasting in the various countries where occupational and/or educational forecasts are still made (4).
A number of basic principles are taken into account when compiling these highly differentiated forecasts. These principles counter the more fundamental and methodological criticisms of
(3) Some parts of this section were taken from Cörvers et al. (2002). For the regional dimension of the ROA forecasting model see also Berendsen et al. (1993).
initial manpower planning approaches and are listed below. The same methodological issues apply to the regional forecasting models of labour demand and supply. However, when forecasting regional labour demand and supply some additional issues and constraints are important:
• the forecasts are limited to the medium term, that is, to a period of five years. Within this horizon the changes on the labour market are less uncertain than in the long term (5), where the uncertain results of the emergence of substitution, geographical mobility and other adjustment processes can be decisive, in particular where the discrepancies between demand and supply may be extremely large. On a smaller scale of analysis, for example in case of the 12 Provinces of the Netherlands, the uncertainties are larger due to the relatively great impact of incidents like the closure or establishment of a big firm in the region;
• instead of fixed coefficients for the professional and training structure of employment, explanatory models are used to describe the changes in both structures over time. Some preliminary analyses show that the national occupational and educational structure of employment within sectors of industry is very similar to the employment structure in many regions (6). Therefore, it can be expected that also trends in the employment structure within sectors of industry are similar and can be used to forecast regional employment growth. Moreover, the differentiation of the regional employment structure by occupation and education is not possible for all labour-market segments due to the relatively small sample sizes at the regional level in the labour force survey;
• the theoretical framework, which underlies the forecasting models, incorporates both ex ante
and ex post substitution processes in the forecasts of the labour-market situations for the various types of education. The ex ante substitution processes refer to the demand-led substitution between types of education due, for example, to the upgrading of the skill requirements for a particular occupation, whereas ex post substitution refers to shifts in the educational structure of employment in an occupation as a result of the initial gaps between demand and supply for the various types of education (e.g. Borghans et al., 1996; Cörvers et al., 2003). In the regional forecasting model we assume that the interaction between regional labour markets is another (and perhaps more) important point of attention, in particular when forecasts are made for administratively bounded areas like provinces (7). This implies that both substitution processes between types of education within regions and changes in commuting (or migration) flows between regions can solve the discrepancies between supply and demand to some extent. However, these adjustments between supply and demand are not costless;
(5) Think also of the pupils and students who participate in educational courses with a maximum duration of five years, due to which their inflow onto the labour market on the medium term can be predicted relatively easily (although predictions on drop outs and flows within the educational system are also important).
(6) These analyses are, however, hampered by the relatively small sample sizes at the regional level in the labour force survey.
• no detailed comparisons of demand and supply are made for each forecasting year, but the forecasts itself are limited to a general characterisation of the relation between demand and supply for categories of education over the whole forecast period. Information intended as guidance for students is limited to a qualitative description of the labour-market prospects of these training categories, on a scale from ‘good’ to ‘poor’. This requires that the education categories should be carefully constructed, so that the variation in labour-market prospects within each category is as small as possible (8). At the regional level the same classifications by occupation and education and the same characterisations of labour-market prospects are used as at the national level;
• it is important to make as much use as possible of any understanding which already exists of the future growth of employment, flows between work and inactivity, and the flows from the education system onto the labour market. In the Netherlands this applies in particular to changes in the employment in the various sectors of industry, which are taken from the Netherlands Bureau for economic policy analysis (Centraal Planbureau – CPB), and to the flows from the education system onto the labour market, which are taken from forecasts made by the Ministry of Education, Culture and Science. By using these, we ensure that the labour-market forecasts are consistent with the authoritative forecasts that provide the basis for policy decisions on important social and economic issues (9);
• the uncertainties, which are associated with labour-market forecasts, are to some extent met by mapping the labour-market risks that a particular choice of training may exhibit. Statistical indicators have been developed as a supplement to the forecast of the probability of finding an attractive job. The indicators give insight into, for example, the opportunities that a type of education offers of switching between occupations, and the sensitivity of the occupations which are relevant for a particular type of education to cyclical fluctuations (Dekker et al., 1990). Preliminary analyses show that these indicators do not differ very much between regions;
• the national forecasts made are evaluated periodically at the end of the forecasting period (e.g. Borghans et al., 1994b; Smits et al., 2001). This evaluation includes an empirical evaluation of the forecasts made by all submodels and the resulting labour-market signals provided for students and firms, and a survey of the methodology, describing the strong and weak points of the models and possible improvements and extensions. The regional labour-market forecasts have not been evaluated so far.
2.1.
Structure of the labour-market forecasting model
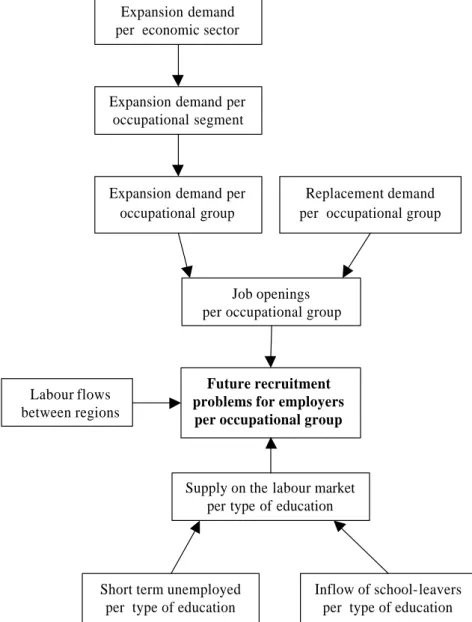
Figure 1 gives a general description of the flows on the labour market. On the demand side of the labour market a distinction is made between on the one hand demand that results from future
(8) For a description of the way in which ROA has defined the types of education that it differentiates, see Heijke et al. (2003).
changes in employment levels – expansion demand – and on the other hand demand due to retirement and occupational mobility – replacement demand . The sum of expansion and replacement demand equals the expected number of job openings. On the supply side of the labour market a distinction is made between on the one hand the supply due to the inflow of school-leavers onto the labour market and on the other hand the supply of short term unemployed. Confronting expected future labour demand and supply of labour leads to an indication of the discrepancies on the labour market by occupation or education. These discrepancies can be expressed by an indicator of the future labour-market situation (IFLM), which indicates the future labour-market prospects of school-leavers with a particular type of education or the future recruitment problems of employers to find personnel for a particular occupation. In the figure the confrontation between demand and supply is presented for occupational groups. By means of the IFLM employers can foresee to what extent it will be possible to realise the desired educational structure within particular occupations.
Figure 1: The general forecasting model
Expansion demand per economic sector
Expansion demand per occupational segment
Expansion demand per occupational group
Replacement demand per occupational group
Job openings per occupational group
Future recruitment problems for employers
per occupational group
Supply on the labour market per type of education Labour flows
between regions
Short term unemployed per type of education
Inflow of school-leavers per type of education
2.2.
Expansion demand
The national employment projections by sector of industry, which are based on the Athena model of the CPB are the starting point for the forecasts. The Athena model of CPB is a multi-sector model of the Dutch economy (CPB, 1990), which distinguishes about 15 sectors (10). However, CPB does not make regional forecasts of employment growth by sector. Therefore, an alternative source of forecasts is required by which national and regional forecasts by sector are compiled according to a similar methodology. The regional forecasts of employment growth by sector are derived fromforecasts made by the Provinces themselves or other institutes (Ecorys NEI, TNO). However, the national CPB employment forecasts are often used as an input when compiling these regional employment forecasts. Taking into account that particular occupational classes within economic sectors may grow more rapidly than others, we translate the forecasted employment growth of economic sectors into the expansion demand per occupational class (11). In turn, the implications of the predicted growth in the various occupational classes for the expansion demand for each type of education are determined. The regional forecasts of expansion demand are determined by using these national forecasts. The expected national changes in the occupational and educational employment structure are projected on the professional and training structure of employment of the region concerned (12). Data on the regional employment structure are drawn from the labour force survey of Statistics Netherlands. Forecasts are only made for occupational groups or types of education with at least 2 500 persons (average of two years) employed in the region in question. This restriction is set by Statistics Netherlands to prevent publication of figures from the labour force survey with too broad confidence intervals. Thus, this number can be regarded as the minimum size of occupational groups and types of education for which reliable regional labour-market forecasts can be made.
The model of expansion demand is illustrated by Figure 2. Various shapes have been used for the boxes. A rectangle with rounded corners relates to the results (or interim results) from estimating the national forecasting model. Additional data required for forecasting the regional expansion demand are marked by a hexagon. The results of the regional model are designated by a rectangle. Shaded rectangles represent final forecasting results of changes in provincial employment by occupational group and type of education.
(10) The classification and number of sectors distinguished in the Athena model of CPB varied over time.
(11) For more information see Cörvers et al. (2002, 2004).
Figure 2: Methodology of the regional expansion demand
The national employment forecasts per occupational group are derived as follows (13). Starting from the CPB forecasts of employment by sector, a two-step model is estimated to explain the
(13) The national forecasts of expansion demand per type of education are not discussed here. The methodology of these forecasts include shifts in the employment structure of skill categories (upgrading) within an occupational group due to technological and organisational developments, as well as the substitution processes that result from discrepancies between labour demand and supply and cause additional shifts in demand as employers adjust their desires in accordance with the availability of workers (e.g. Borghans et al., 1996; Cörvers et al., 2003).
Regional occupational model province x economic sector numbers 2003 province x economic sector numbers 2008 occupational group x economic sector numbers 2008 province x economic sector growth 2003-08 province x occupational group numbers 2003 province x occupational group growth 2003-08 province x occupational group numbers 2008 occupational group x economic sector growth 2003-08 occupational group x economic sector numbers 2003 occupational group x type of education numbers 2008 province x type of education numbers 2003 province x type of education growth 2003-08 province x type of education numbers 2008 occupational group x type of education growth 2003-08 occupational group x type of education numbers 2003 Regional educational model
occupational structure of the sectors. The changes in employment levels per economic sector are first translated into employment changes for 43 occupational segments by using a model with explanatory variables (14). Changes in the employment structure are estimated on the basis of the labour force survey data from 1988-2002. Because the available time series is rather short, a random coefficients (RC) model has been used (15).
2.3.
Replacement demand
The demand for labour also consists of replacement demand, which arises when workers retire, leave the labour force under an early retirement scheme or due to work disability, withdraw from the labour market temporarily, or switch to another occupation, etc. However, replacement demand only arises if the departure of an employee actually leads to a vacancy for a new entrant. If the departure of a worker is taken as an opportunity to cut employment levels, no replacement demand results. Moreover, there is an important difference between the replacement demand per occupational class and per type of education, because occupational mobility has an influence on the replacement demand per occupational class, but not on the replacement demand per type of education. Switching occupations has no effect on the educational structure of employment. On the other hand, when workers complete part-time studies for a higher level or a different qualification, it means in fact an outflow of workers to another educational category (type of education). In that case a replacement demand does arise in the educational category under which a worker’s previous education was counted for.
The first step in modelling future replacement demand per occupational group (16) is a description of the inflow and outflow patterns by occupational group in a historical period. Because there is no appropriate data for mobility flows on the labour market, stock data is used. By means of the so-called cohort components method we calculate cohort-change rates based on the number of persons of the same birth cohort who were employed at two different times (Shryock et al., 1980).
The second step is to translate these inflow and outflow percentages into the replacement demand by occupational group. For occupational groups with an increase in employment in the period (t-1,t), replacement demand is equal to total net outflow in this period. However, for occupational groups, which faced a decrease in employment, not all vacancies due to the outflow of workers will have been filled. Therefore, replacement demand for these occupational groups equal the number of vacancies that were actually refilled, that is, the total
(14) In the latest occupational model of expansion demand (Dupuy et al., 2003) the relevance of explanatory sector variables like valued added, capital investment and R&D expenditures, follows directly from a microeconomic model for the occupational structure of sectors. In this occupational model is accounted for capital-skill complementaries and skill-biased technological change.
(15) Borghans et al. (1994a) provide a detailed description of this model.
inflow of workers in the occupational group. A random coefficient model is estimated in which the net inflow or outflow ratios are explained on the basis of the average inflow or outflow from the total working population on the one hand and the occupation-specific deviations per age-sex group on the other (Willems, 1999). This approach guarantees that the sum of the net flows among the occupations corresponds to the total inflow or outflow.
The third step is to project the historically measured net replacement demand rates per age-sex group for a particular occupational group onto the age-sex structure of the workers at the beginning of the forecasting period. Moreover, the historically observed cohort change rates are corrected for business cycle effects and for expected changes in participation rates (for more details see Willems et al., 1993). Future replacement demand is determined in the same way as historical replacement demand. For occupational groups with an expected increase in employment, replacement demand equals net outflow. For occupational groups for which a decrease in employment is expected, replacement demand is equal to the total net inflow. The replacement demand for Gelderland (Section 3) is derived by using the official sources of the Province of Gelderland on the structure of the labour force by gender and age. Also the corrections for changes in the participation rate are determined by the use of these regional data. To forecast replacement demand we use the same inflow and outflow rates (by gender and age class, and by occupation and education) as those that have been estimated for the Netherlands. Here it is assumed that these rates do not differ very much between regions, since for example retirement schemes for sectors of industry or occupations are often settled at the national level. Furthermore, the occupational structure of the working population is drawn from the labour force survey. A RAS-procedure is used to estimate the matrix of occupation by age-sex group. Total regional replacement demand per occupational group can be derived by projecting the corrected net inflow and outflow ratios on this matrix.
2.4.
Inflow of school-leavers onto the labour market
Forecasts of the flows of school-leavers entering the labour market match the
Referentieramingen (Reference forecasts, OCenW, 2001) compiled by the Ministry of Education, Culture and Science for courses in the ‘regular’ (full-time initial) education system. ROA disaggregates these forecasts by using supplementary data from education matrixes of Statistics Netherlands and its own school-leavers information. Supplementary data from Statistics Netherlands are also used to estimate the effects of continuous (vocational) education on the flows entering the labour market. Besides those leaving school with a qualification, the Reference forecasts cover students who end their studies without a diploma. With the help of education matrices, these school-leavers can be re-assigned to any preliminary course from which they had obtained a diploma.
A forecast is also made of the flow from post-initial education onto the labour market. This flow indicates the effects of lifelong learning on the educational structure of labour supply. Data
about the inflow of ‘newcomers’ in the labour market from post-initial education are derived from the labour force survey. Due to data restriction it is assumed that in the forecasting period the proportion of workers with a particular educational background that completes a post-initial training course which gives them another educational background is the same as in latest year for which data on the participation in post-initial training are available.
The national inflow of school-leavers with a particular type of education onto the labour market is distributed over the regions by the shares of working youngsters (until 30 years old) living in the different regions (Provinces of the Netherlands). By implicitly allowing for historical migration flows of young workers between regions, we are able to forecast the inflow of school-leavers onto the regional labour market. However, gaps between supply and demand on particular labour segments within regions may change the direction of these migration flows.
2.5.
Labour-market gap indicator
By matching labour demand with labour supply, an IFLM can be constructed. This indicator of labour-market prospects is constructed for each of the occupational groups and types of education. If the indicator of the future labour-market recruitment problems for employers has the value of 1, employers are not constrained by limited supply of particular types of education in their recruitment policy. The indicator represents the extent to which labour supply meets labour demand per occupational group. In particular, the indicator measures the chance that employers are able to achieve the desired educational composition of the work force within occupational groups at the end of the forecasting period (Cörvers et al., 2004). The smaller the indicator is, the larger the recruitment problems for employers. The indicator of the future labour-market situation is translated into a qualitative characterisation of the expected future recruitment problems for employers on a five-point scale: none, almost none, some, serious and very serious recruitment problems. Such a qualitative characterisation in quite broad terms suffices for various purposes, including recruitment policies, labour-market exchange, training policies and vocational and educational guidance counselling. Moreover, it prevents that much significance will be attached to the exact numbers of shortages or surpluses.
The forecasts and the labour-market gap indicator (IFLM) give an indication of the direction of the change in labour flows between regions required to smooth discrepancies between labour demand and supply. Although potential changes in inter-regional mobility flows are not taken into account in the basic regional labour-market model, these changes may be important as a labour-market adjustment mechanism. However, local labour markets may be isolated by the presence of infrastructural barriers that prevent the free movement of labour between regions. Shortages of specific types of workers in a local labour market can persist if these barriers are too high.
3.
Application of the regional labour-market
forecasting model
This section will present the forecasting results for the Province of Gelderland, which is one of the 12 Provinces of the Netherlands. Gelderland is situated in the middle and eastern part of the Netherlands, between the centre of the Netherlands (the Province of Utrecht) and Germany. The capital city of Gelderland is Arnhem and other important cities are Nijmegen and Apeldoorn. The labour force of Gelderland consists of about 845 000 workers, which is 12 % of the Dutch working population. Relative to the Netherlands, many people in Gelderland are working in the food and beverage industry, the metal and electronics industry, the rubber and plastics industry and the construction industry. A relative small number of people is employed in energy, chemicals and transport, storage and communication.
3.1.
Forecasting results for the Province of Gelderland
In Table 1 the forecasting results of 11 occupational classes are presented for the period between 2003 and 2008 (ROA, 2004). These 11 occupational classes are aggregates of 127 occupational groups, for which the most detailed forecasts are available. The classification of occupational groups is based on the three-digit international standard classification of occupations (ISCO). The forecasts may vary significantly for different occupational groups within one occupational class, in particular between occupational groups of high job levels on the one hand and low job levels on the other.
The total percentage of job openings during the five-year period from 2003 to 2008 is expected to be 20 % of the total number of employed in 2002. Note that total replacement demand is much larger than total expansion demand. The largest number of job openings as a percentage of occupational employment in 2002 can be found in the public security and safety occupations, the educational occupations and the cultural occupations (e.g. interpreters, library assistants, artists, clergymen and journalists). The last two occupational classes also exhibit the largest replacement demand. On the contrary, a very low replacement demand is expected for the information and communication technologies (ICT) occupations. These differences in replacement demand are to an important extent related to differences in age composition between occupations. The strongly growing employment in the ICT occupations has been attracting many young people. For these occupations expansion demand is still expected to be the largest of all occupational classes. The employment in the agricultural occupations is expected to decrease further during the next years. Also for the technical and industrial occupations, the transport occupations, the sociocultural occupations (e.g. personnel officers, personnel managers, welfare workers, researchers) and the commercial and administrative occupations the expansion demand is expected to be negative.
Table 1: Expected future expansion demand, replacement demand, job openings, and IFLM per occupational class for employers in 2008, as percentage of occupational employment in 2002 Occupational class Expansion demand % Replacement demand % Job openings% IFLM Characteristic of expected recruitment problems in 2008
Gelderland Gelderland Gelderland Gelderland Gelderland Netherlands
Educational occupations 10 21 32 0,89 Very serious Serious Cultural occupations 9 18 28 0,90 Serious Some Agricultural occupations -8 18 18 0,96 Almost none None Technical and industrial
occupations -3 18 20 0,91 Some
Almost none Transport occupations -3 13 15 0,96 Almost none None Medical and paramedical
occupations 5 17 23 0,92 Some Serious
Commercial and admin.
occupations -0 14 16 0,95 Almost none Some
ICT occupations 11 9 21 0,93 Some Some
Sociocultural occupations -1 15 18 0,95 Almost none Serious Care and service occupations 6 16 23 0,97 Almost none None Public security and safety
occupations 7 25 34 0,92 Some None
Total 1 16 20
Source: ROA/Province of Gelderland/CPB
The confrontation between labour supply and demand is indicated by the IFLM. As has been discussed before, the indicator has the maximum value of 1 if employers are not constrained by limited supply of school-leavers for particular types of education. The smaller the indicator is, the larger the recruitment problems. From Table 1 it follows that employers that search for graduates who are qualified to work as a teacher in the educational sector will be confronted with very serious recruitment problems. The number of job openings in these educational occupations, mainly caused by replacement demand, cannot be easily refilled, as the inflow of school-leavers into educational occupations is too low. In spite of the relatively large number of job openings in the public security and safety occupations, the inflow of school-leavers is large enough to prevent serious recruitment problems for employers. However, employers may expect serious recruitment problems for the cultural occupations and the technical and industrial occupations. For the former occupations the number of job openings as percentage of occupational employment is relatively large, whereas for the latter occupations this percentage is on average. The recruitment problems in the technical and industrial occupations in
Gelderland are mainly due to the relatively low inflow of technically educated school-leavers onto the labour market. These recruitment problems are on average much larger than in other parts of the Netherlands. On the contrary, for the sociocultural occupations the recruitment problems are much smaller in Gelderland relative to the Netherlands.
3.2.
Commuting flows and the inflow of school-leavers onto the
regional labour market
One way to reduce the mismatch between demand and supply in Gelderland is by changing the commuting and migration flows. The supply of labour from other (neighbouring) regional labour markets with fewer mismatches between demand and supply could reduce the mismatches for specific occupational groups in Gelderland, for example for the technical and industrial occupations mentioned above. Table 2 gives an impression of the changes in commuting flows and flows of school-leavers onto the regional labour market that are required to bridge the gap between labour supply and demand for the 11 occupational classes. The table indicates that to solve the shortages in the educational occupations in Gelderland, incoming commuting flow should increase with about 170 %. This does not seem very realistic, in particular since employers are expected to have serious recruitment problems in other parts of the Netherlands. However, for the technical and industry occupations an increase in the incoming commuting flow by only 1 % would meet the expected excess demand in Gelderland. Furthermore, a decrease of the incoming commuters in the sociocultural occupations by 14 % would contribute to solve the expected serious recruitment problems in other parts of the Netherlands.
Changes in the inflow of school-leavers onto the labour market could also reduce the mismatches between supply and demand on the regional labour market. School-leavers may choose to work in other occupations as school-leavers of earlier cohorts used to do, or may decide to work (and live) in other regions with better labour-market prospects. The last column of Table 2 shows that the required changes in the inflow of school-leavers are smaller than the required changes in incoming commuting flows for some occupations. For the cultural occupations an increase in the inflow of school-leavers from other regions by 22 % would solve the recruitment problems of employers in this occupational class, whereas commuting flows should increase by 40 % to get the same result.
Table 2: Changes in commuting flows (average 2000-01) required to solve discrepancies between demand and supply per occupational class, as a percentage of the forecasted excess demand (2003-08) per occupational class, Gelderland
Required change
Occupational class Incommuters % Inflow of school-leavers %
Educational occupations 172 169
Cultural occupations 40 22
Agricultural occupations -16 -3
Technical and industrial occupations 1 1
Transport occupations n.a. n.a.
Medical and paramedical occupations n.a. n.a. Commercial and administrative occupations -48 -26
ICT occupations 41 42
Sociocultural occupations -14 -9
Care and service occupations 29 10
Public security and safety occupations 58 123
n.a.: not available due to too small numbers.
4.
Final remarks
This chapter has discussed the labour-market forecasting model developed by ROA, which goes beyond the scope of the traditional manpower requirements approach. The model predicts mismatches between labour supply and demand at the regional level on the medium term. The model covers the whole regional labour market with regard to detailed occupational groups and types of education. In drawing up the regional labour-market forecasts an approach was chosen in which the regional forecasts of employment growth per sector of industry, the age composition and the participation rates at the regional level and the regional distribution of working youngsters with a particular type of education are important inputs. The advantages of this approach are the consistency of the national with regional forecasting of the labour market, and the allowance for interactions between different segments on the regional labour market. Another advantage is that in spite of the data constraints a fairly high level of disaggregation by occupation and education can be achieved at the regional level. Therefore the forecasts by occupation and education can be useful for both policy-makers, who may use the regional forecasts at a more aggregate level, individual employers who may be interested in the future labour-market situation of particular occupational groups, and schools or youngsters who may want to know the labour-market prospects for particular types of education.
On the other hand, the region-specific dimensions in the labour-market forecasting model of provinces are limited, as the forecasting draws heavily on national employment trends by occupation and education, and on national flow ratios of workers in and out the labour force. We expect that trends in the occupational and skill mix within sectors of industry, such as the increase in white collar jobs at the expense of blue collar jobs, and the upgrading of skills, do not differ very much between similar sectors across regions. Moreover, in- and outflow ratios per age class and gender due to, for example, retirement, motherhood or job mobility are not expected to differ much for similar occupational groups across regions.
Finally, the regional model hardly deals with changes in the geographical mobility of workers that result from regional mismatches between demand and supply on the labour market of the province concerned as well as of the neighbouring regions. The relevance of these mobility flows is dependent on whether similar labour-market segments of neighbouring provinces are interrelated, and thus to what extent labour-market developments in the own region respond to mismatches between occupation and education (gaps) in other regions. Further research is required to incorporate these adjustment processes into the regional forecasting model.
References
Berendsen, H. et al. Regionale arbeidsmarktprognoses naar opleiding en beroep. Maandschrift Economie, 1993, Vol. 57, p. 155-169.
Blaug, M. Approaches to educational planning. Economic Journal, 1967, Vol. 77, p. 262-287. Borghans, L. Educational choice and labour-market information. Maastricht: Research Centre for Education and the Labour Market, 1993 (ROA Dissertation Series No 1).
Borghans, L.; Heijke, H. Een random coëfficiënten model voor het voorspellen van de beroepenstructuur van bedrijfstakken, Maastricht: Research Centre for Education and the Labour Market, 1994a (ROA-W-1994/1).
Borghans, L.; Heijke, H. Forecasting the educational structure of occupations: a manpower requirement approach with substitution. Labour, 1996, Vol. 10, p. 151-192.
Borghans, L.; Van Eijs, P.; de Grip, A. An evaluation of labour-market forecasts by type of education. Maastricht: Research Centre for Education and the Labour Market, 1994b (ROA-R-1994/4E).
Cörvers, F. Labour-market forecasting in the Netherlands: a top-down approach. In Schömann, K.; Schmidt, S.L.; Tessaring, M. (eds). Early identification of skill needs in Europe. Luxembourg: EUR-OP, 2003, p. 72-83 (Cedefop Reference Series, 40).
Cörvers, F.; de Grip, A.; Heijke, H. Beyond manpower planning: a labour-market model for the Netherlands and its forecasts to 2006. In Neugart, M.; Schömann, K. (eds). Forecasting labour markets in OECD countries; measuring and tackling mismatches. Cheltenham: Edward Elgar, 2002, p. 185-223.
Cörvers, F.; Heijke, H. Forecasting the labour market by occupation and education: some key issues. Paper presented at the conference on Modelling labour-market: realities and prospects. Athens: Employment Observatory Research Informatics, 2003.
Cörvers, F. et al. Methodiek arbeidsmarktprognoses en -indicatoren 2003—2008.
Maastricht: Research Centre for Education and the Labour Market, 2004 (ROA-W-2004/2). CPB. Athena: een bedrijfstakkenmodel voor de Nederlandse economie. Den Haag: CPB – Centraal Planbureau, 1990 (CPB Monografie No 30).
Dekker, R.J.P.; de Grip, A.; Heijke, J.A.M. An explanation of the educational structure of sectors of industry. Labour, 1990, Vol. 4, p. 3-31.
Dupuy, A.; Cörvers, F. A micro-economic foundation of modelling and forecasting the occupational structure of economic sectors. Paper presented at the conference on Modelling
labour market: realities and prospects. Athens: Employment Observatory Research Informatics, 2003.
Heijke, H. (ed.). Forecasting the labour market by occupation and education. Dordrecht: Kluwer Academic Publishers, 1994.
Heijke, H.; Borghans, L. (eds). Towards a transparent labour market for educational decisions. Aldershot: Ashgate, 1998.
Heijke, H.; Matheeuwsen, A.; Willems, E. Clustering educational categories in a heterogeneous labour market.Education Economics, 2003, Vol. 11, p. 89-108.
Hensen, M.; Cörvers, F. The regionalization of labour markets by modelling commuting behaviour. Paper presented at the 43rd Congress of the European Regional Science Association Jyväskylä, Finland, 2003.
Hughes, G. Projecting the occupational structure of employment in OECD countries. Paris: OECD, 1993 (OECD Labour Market and Social Policy Occasional Papers No 10).
Lindley, R.M.; Wilson, R.A. (eds). Review of the economy and employment 1991: regional assessments. Warwick: Institute for Employment Research, 1991.
Neugart, M.; Schömann, K. (eds). Forecasting labour markets in OECD countries; Measuring and tackling mismatches. Cheltenham: Edward Elgar, 2002.
OCenW. Ramingen, leerlingen en studenten; Referentieramingen. Zoetermeer: Ministerie van Onderwijs, Cultuur en Wetenschappen, 2001.
OECD. Employment outlook. Paris: OECD, 1994.
Parnes, H.S. Forecasting educational needs for economic and social development. Paris: OECD, 1962.
ROA. The labour market by education and occupation to 2000 (Statistical appendix).
Maastricht: Research Centre for Education and the Labour Market, 1995 (ROA-R-1995/3E and 3BE).
ROA. De arbeidsmarkt naar opleiding en beroep tot 2006. Maastricht: Research Centre for Education and the Labour Market, 2001 (ROA-R-2001/8).
ROA. De Limburgse arbeidsmarkt 2002-2006 (Statistical appendix). Maastricht: Research Centre for Education and the Labour Market, 2003a (ROA-R-2003/3 and 3BE).
ROA. De Gelderse arbeidsmarkt 2001-2006 (Statistical appendix). Maastricht: Research Centre for Education and the Labour Market, 2003b (ROA-R-2003/4 and 4BE).
ROA. De Overijsselse arbeidsmarkt naar opleiding en beroep 2001-2006 (Statistical appendix). Maastricht: Research Centre for Education and the Labour Market, 2003c (ROA-R-2003/10 and 10BE).
ROA. De arbeidsmarkt naar opleiding en beroep tot 2008. Maastricht: Research Centre for Education and the Labour Market,2003d (ROA-R-2003/11).
ROA. De Gelderse arbeidsmarkt 2003-2008. Maastricht: Research Centre for Education and the Labour Market, 2004 (forthcoming).
Shryock, H.S.; Siegel, J.S. The methods and materials of demography. Washington DC: US Bureau of the Census, US Government Printing Office, 1980.
Smits, W.; Diephuis, B. Evaluatie arbeidsmarktprognoses naar opleiding en beroep tot 1998. Maastricht: Research Centre for Education and the Labour Market, 1998 (ROA-R-2001/2). van Eijs, P. Manpower forecasting in the western world: the current state of the art. Maastricht: Research Centre for Education and the Labour Market, 1994 (ROA-RM-1994/1E). Willems, E. Modelling replacement demand: a random coefficient approach, Maastricht: Research Centre for Education and the Labour Market, 1999 (ROA-RM-1999/2E).
Willems, E.; de Grip, A. Forecasting replacement demand by occupation and education.