Universität Zürich
IBW – Institut für Betriebswirtschaftslehre
Working Paper No. 129
Does Class Size Affect Student ‘Grit’?
Evidence from a Randomised Experiment
in Early Grades
June 2017
Die Discussion Papers dienen einer möglichst schnellen Verbreitung von neueren Forschungsarbeiten des Leading Houses und seiner Konferenzen und Workshops. Die Beiträge liegen in alleiniger Verantwortung der
Autoren und stellen nicht notwendigerweise die Meinung des Leading House dar.
Disussion Papers are intended to make results of the Leading House research or its conferences and workshops promptly available to other economists in order to encourage discussion and suggestions for revisions. The authors are solely responsible for the contents which do not necessarily represent the opinion of the Leading
House.
The Swiss Leading House on Economics of Education, Firm Behavior and Training Policies is a Research Program of the Swiss State Secretariat for Education, Research, and Innovation (SERI).
www.economics-of-education.ch
Working Paper No. 129
Does Class Size Affect Student ‘Grit’?
Evidence from a Randomised Experiment
in Early Grades
Does Class Size A
↵
ect Student ‘Grit’ ? Evidence from a Randomised
Experiment in Early Grades
⇤Jana Gross†, Simone Balestra‡ and Uschi Backes-Gellner§
June 2017
Abstract
The increasing recognition of non-cognitive skills in economics and management has led many researchers to investigate how educational practices enhance these skills. In this paper, we focus on the non-cognitive skill known as ‘grit’, and we study the causal relation between class size and grit. Using data from follow-up surveys of Project STAR, we show that fourth-grade pupils who experienced small classes during early grades are 0.12 standard deviations higher in grit than their peers in regular classes. Sub-sample analysis reveals that particularly boys and non-white pupils increase their grit in smaller classes. We also show that grit matters, because half of the e↵ect of smaller classes on test scores entirely operates through grit. The e↵ects of grit are far-reaching: students with higher grit have better grades at the end of compulsory schooling, are more likely to graduate from high school on time and are more likely to take a college-entrance exam. We conclude that grit is an important driver of both short- and long-term performance and that grit is malleable in early grades.
Keywords: class size, grit, non-cognitive skills. JEL Classification: C20, C36, I21.
⇤ We are grateful to Thomas Dohmen, Simon Janssen, Rafael Lalive, Edward Lazear, Carmit Segal, and Ludger
Woessmann for their constructive comments. This study is partly funded by the Swiss State Secretariat for Education, Research and Innovation through its Leading House on the Economics of Education, Firm Behaviour and Training Policies.
† ETH Zurich, Switzerland. Telephone: +41 (0)44 633 84 94; e-mail: [email protected]. Address: Weinbergstrasse 56/58, CH-8006 Zurich, Switzerland. Jana Gross is the corresponding author.
‡University of St. Gallen, Switzerland. Telephone: +41 (0)71 224 23 18; e-mail: [email protected]. Address: Rosenbergstrasse 51, CH-9000 St. Gallen, Switzerland.
§University of Zurich, Switzerland. Telephone: +41 (0)44 634 42 81; e-mail: [email protected]. Address: Plattenstrasse 14, CH-8032 Zurich, Switzerland.
1
Introduction
Over the last decade, non-cognitive skills have emerged as one of the most important determinants of educational attainment (Heckman and Rubinstein, 2001; Segal, 2013) and labour market success (Heckman and Kautz, 2012; Heckman et al., 2006). Amongst all non-cognitive skills, the characteristic ‘grit’ has been shown as one of the strongest predictors of both academic and job performance (Duck-worth et al., 2010; Robertson-Kraft and Duck(Duck-worth, 2014). ‘Grit’ entails two dimensions: consistency of interest and perseverance of e↵ort (Duckworth et al., 2007). Individuals with high grit stay on track despite major failures or setbacks, and this ability to sustain persistence in e↵ort and interest in long-term tasks positively impacts lifetime outcomes in various ways (Eskreis-Winkler et al., 2014). Importantly, researchers find no correlation between grit and cognitive skills, suggesting that the higher performance of gritty individuals is attributable to e↵ort and interest rather than to cognitive ability (Culin et al., 2014).
Although research investigating the impact of grit on educational and labour market outcomes is well-developed, much less is known about whether modifying or shaping this skill is possible, and – if so – what educational practices allow individuals to do so (Duckworth, 2016; Segal, 2008). In this paper, we investigate the causal e↵ect of class size in early grades on the development of grit. We focus on class size in early grades for two reasons. First, interventions in early childhood are most e↵ective and show a consistent impact on adult life (Doyle et al., 2009; Heckman et al., 2013). Second, reducing class size is a widespread educational practice aimed at improving student outcomes (Antecol et al., 2016; Chetty et al., 2011).
However, the actual impact of class size on student achievement remains debated, suggesting that test scores are likely not the only outcome on which we should focus (Schanzenbach, 2006). In smaller classes, students benefit from closer guidance and better mentoring, both of which increase not only student engagement (Dee, 2007) but also certain non-cognitive skills (Heckman and Mosso, 2014). For example, Dee and West (2011) use the National Education Longitudinal Study of 1988 to show that smaller eighth-grade classes are associated with improvements in several measures of school engagement. No paper so far analysed the impact on grit of smaller classes during early grades, leaving unanswered the question on whether such educational practices improve grit. To fill this research gap, we use data from a large-scale randomised experiment to study the causal relation between class size and grit.
To identify causal e↵ects, we use data from ‘Project STAR and Beyond’, a 1990 follow-up survey of the Tennessee Student-Teacher Achievement Ratio experiment (Project STAR). Project STAR is a large-scale experiment that randomly assigned students and teachers to classes of di↵erent size. The main advantage of using experimental data is that the source of identification is clear. After the experiment, annual follow-up studies continued collecting students’ information to investigate the
long-term e↵ects of class size. Our analysis centres on the outcomes collected in the fourth grade study on student behaviour, the Student Participation Questionnaire (SPQ). The SPQ provides personal attributes necessary for building our outcome variable as closely as possible to the original grit scale developed by Duckworth et al. (2007). Our variable grit is thus our best subjective mapping from the available elements from the questionnaire, a variable that we test and validate throughout the paper. We first provide descriptive evidence suggesting that students assigned to smaller classes during Project STAR score higher on the grit scale than their counterparts in the control group. Second, to further investigate this relation, we estimate several econometric specifications to study the causal e↵ect of class size on grit. Our results show that, on average, pupils in smaller classes are about 0.12 standard deviations higher in grit than their peers in regular classes. Whilst controlling for student and fourth grade characteristics barely a↵ects the e↵ect size, it improves the precision of the coefficient of interest. The e↵ect size is not only statistically significant but also important in magnitude: for example, the class size e↵ect on pupils’ fourth grade test scores is only a third of the grit e↵ect in the same year.1
To deepen scholarly understanding of the e↵ect of class size on grit, we perform sub-sample anal-yses according to ethnicity and socioeconomic status. Our results show that student’s grit in smaller classes positively increases for both non-white students and students with a lower socioeconomic sta-tus. These results are supported by Lazear (2001) who suggests that, for a given class size reduction, the increase in educational outcome (broadly defined) is larger for disadvantaged students. Supporting this theoretical intuition, Jepsen and Rivkin (2009) show empirically that class size e↵ects are indeed more important for disadvantaged students. Our results show that in terms of grit, non-white pupils also benefit more from smaller classes than the average student. Moreover, as previous work shows that boys tend to be more disruptive and more likely to lose focus during instructional time, we con-duct separate analyses for boys and girls (Bertrand et al., 2013). Our results support this hypothesis, showing that boys develop grit more in smaller classes than girls.
To shed light on the importance of grit in determining student achievement, we present a brief causal mediation analysis (Imai et al., 2010b). The purpose of this analysis is to understand to what extent the class size e↵ect on school outcomes operates through grit. The results are also useful for better understanding the underlying mechanism between class size, grit and (later) school outcomes. Our analysis suggests that the well-documented class size e↵ect on test scores and later school outcomes is driven mainly by grit. This pathway is also suggested by Cunha and Heckman (2008), who show that non-cognitive skills promote the formation of cognitive skills, not the other way about.
We perform several robustness checks. First, we test the sensitivity of our results to alternative specifications of the dependent variable by using an extended grit scale. Second, we deal with (non-random) attrition by computing bounds of the treatment e↵ect and by imputing grit for students who 1Estimation taken from Schanzenbach (2006), who also uses data from Project STAR and Beyond.
did not participate in the SPQ. Third, we control for teacher rating standards by adding teacher fixed e↵ects to our models. Overall, all the robustness checks indicate that neither the specification of the dependent variable nor attrition patterns threaten the validity of our analyses.
2
Literature
A wide body of evidence recognises the increasing importance of non-cognitive skills (Chamorro-Premuzic and Furnham, 2003; Duckworth and Seligman, 2006; Finn and Achilles, 1999; Heckman et al., 2006; McCrae and John, 1992). Non-cognitive skills are strong predictors of educational, academic and other lifetime outcomes (Heckman and Kautz, 2012; Heckman and Rubinstein, 2001; Kautz et al., 2014; Segal, 2013). Moreover, Borghans et al. (2008) show that non-cognitive skills become equally relevant to cognitive skills, if not more so, in predicting later academic performance.
In this strand of the literature, the discussion of the non-cognitive skill grit is relatively new, because grit itself is a concept that entered the academic discussion only in 2007, with Duckworth et al. (2007). Grit is the ability to maintain e↵ort and interest over time, even in the face of major setbacks. The two main attributes of grit constitute persistence of e↵ort and consistency of interest. Gritty individuals show high stamina in both diligent work and passion when pursuing long-term goals. Whereas others perceive failure as a signal to change course, gritty individuals stay on course (Duckworth et al., 2007).
Gritty individuals gain higher achievement in both their working environment and private life (Culin et al., 2014; Duckworth et al., 2007). In line with Duckworth et al. (2007), Duckworth et al. (2010), show that gritty individuals are higher educated than their less gritty peers. Moreover, as gritty individuals are more likely to graduate from high school on time (Eskreis-Winkler et al., 2014), the importance of grit clearly starts in school, not afterwards. However, this e↵ect is not an ability e↵ect, because grit is not correlated with IQ (Duckworth et al., 2007; Duckworth and Quinn, 2009).
Alan et al. (2015) present evidence that grit might be malleable in early childhood. They evaluate a large-scale randomized educational intervention that aims to improve children’s time preferences and grit. They show that children that receive the treatment perform better than the control group in both experimental tasks and school outcomes. Although Alan et al. (2015) do not measure grit explicitly, they suggest that educational activities implemented in a natural classroom environment can a↵ect children’s behaviours related to goal-setting and perseverance. The question thus remains whether and, if so, how grit can be changed by more widespread educational policies such as reductions in class size.
Two studies are close to the present investigation. First, Schanzenbach (2006) provides an overview of the academic literature using the Project STAR experiments. She also analyses the class size e↵ect on the following personality traits: self-concept, motivation, and listening. These three
traits come from the Self-Concept, ad Motivational Inventory (SCAMIN), which was given at the end of each year during the STAR experiment. By contrast, we use measures of non-cognitive skills elicited by the SPQ after Project STAR, in the fourth-grade follow-up survey. The advantage of using the SPQ is that it measures a broader battery of non-cognitive skills than the SCAMIN, allowing us to build a grit scale. Second, in their working paper2 version, Dee and West (2011) analyse class size e↵ects on three aggregated measures of non-cognitive skills: initiative, e↵ort, and non-participatory behaviour. While these three composite scores are also taken from the SPQ, we do not use them for our grit scale. We instead use single items from the SPQ directly.
The literature shows a number of channels through which class size may foster student’s grit. First, smaller classes allow a more intense pupil-teacher interaction (Dee, 2007; Finn and Achilles, 1999). Therefore, students engage more actively during instructional time due to better guidance and may thus learn that putting in e↵ort pays. Second, pupils in smaller classes are less distracted and therefore remain focused on class material (Lazear, 2001). Less distraction allows students to develop a deeper insight into class material, followed by better learning outcomes that may lead to a higher consistency of interest and persistence of e↵ort.
Third, pupils in smaller classes have a higher chance of gaining the teacher’s attention through e↵ort (e.g. doing their homework) and interest (e.g. asking questions during class), thereby creating positive feedback loops so that students again learn that it pays to invest more interest and e↵ort. As Duckworth (2016) explains, encouraging repetition and refinement helps develop grit. If pupils learn that they can persist through challenges and eventually succeed, they will begin to define themselves by that persistence, not by momentary failures or challenges. In addition, as Heckman and Mosso (2014) suggest, pupils in smaller classes are likely to receive better mentoring and guidance, which in turn might a↵ect their non-cognitive skills.
Many behavioural traits fall under the category of non-cognitive skills. However, despite over-lapping key determinants with other non-cognitive skills, grit is distinctive. First, Duckworth and Gross (2014) argue that grit entails the ability to work assiduously toward a single long-term goal despite setbacks, whereas self-control is the ability to regulate behaviour when pursuing a goal despite attractive alternatives. Second, despite overlapping areas of achievement for both grit and conscien-tiousness, grit di↵ers in its emphasis on long-term stamina (Duckworth et al., 2007). Similarly, whilst both grit and hardiness provide attributes of the motivation to work hard despite stress or failure, hardiness does not necessarily entail consistency of interest amongst long-term goals (Maddi, 2006).
The main challenge for out project lies in formalising the concept of grit because the first 12-item grit scale was introduced in 2007 by Duckworth et al. (2007). Duckworth and Quinn (2009) improve on the initial grit scale by showing that their eight-item scale is as meaningful as the 12-item scale. 2See Dee and West (2008).
Moreover, Duckworth also developed a di↵erent eight-item scale3 specifically for children, a scale on which we base our grit measures. However, as our data were collected before the grit scale was fully developed, we are not able to perfectly replicate the original grit scale. Nevertheless, we build our scale as closely as possible to Duckworth’s scale for children, and we test the relevance of our scale through robustness checks.
3
Data and Empirical Strategy
3.1 Data, Measures and Descriptive Statistics
Although the grit scale was both formalised and developed within the last ten years, we use data that were collected before Duckworth et al. (2007) defined grit as a characteristic. We use data from follow-up surveys of the Tennessee Student-Teacher Achievement Ratio experiment (Project STAR), a large-scale, randomised class-size experiment that took place between 1985 and 1989. The 1990 follow-up study provides student behavioural attributes that we use to develop our outcome variable, grit. Project STAR originally involved 11,600 students from kindergarten through third grade.4 It was commissioned by the Tennessee state legislature and implemented by a consortium of Tennessee universities and the Tennessee State Department of Education.
The experiment randomly assigned kindergarten pupils to small classes (target enrolment between 13 and 17 students) or regular classes (target enrolment between 22 and 26 students, either with or without a teacher’s aide). The class-type assignments of pupils and teachers were maintained through the third grade. Children and teachers entering the study after kindergarten were also randomly assigned to one of the treatments. Although the data cover only one state and one cohort, the experiment included a heterogeneous set of schools from across Tennessee, including large and small, urban and rural, and wealthy and poor districts. Consequently, the schools included in the data represent most of the educational conditions that exist in the United States (Krueger and Whitmore, 2001).
From fourth grade on, all students returned to a regular class size. After the Project STAR exper-iment, annual follow-up studies continued collecting students’ information to investigate the long-term e↵ects of having smaller classes at an early age. Our analysis centres on the outcomes collected in the fourth grade follow-up study on student behaviour, the ‘Student Participation Questionnaire’ (SPQ).5 At the end of fourth grade (summer 1990) teachers had to rate about ten randomly selected students who participated in Project STAR on 31 items, 29 of which cluster into the following categories: 3Publicly available on her website http://angeladuckworth.com/research/.
4For detailed information about the experiment, see Finn and Achilles (1990); Folger and Breda (1989) and Word et al.
(1990).
5The SPQ was also collected in eighth grade but – unfortunately – in a di↵erent form. Specifically, the eighth-grade
SPQ had fewer items than the fourth grade one, preventing us from constructing a comparable grit scale in the eighth grade.
e↵ort, non-participatory behaviour, initiative taking and valuing school outcomes. For each item, teachers had to rate the occurrence of a specific behaviour from ‘never’ to ‘always’ on a five-point Likert scale.6 Of the initial 11,600 pupils, roughly 7,300 attended fourth grade and, of those 7,300, 2,200 were randomly selected for participating in the SPQ.
To build our outcome variable, we follow Duckworth’s eight-item scale for children as closely as possible. Two elements define a grit scale: consistency of interest and perseverance of e↵ort. Consistency of interest means, amongst other things, that an individual is able to stay focused on a given goal. Similarly, perseverance of e↵ort means, amongst other things, that an individual is persistent when confronted with a given task. From all items on the SPQ, we choose only those that match Duckworth’s grit scale. Given that the SPQ was collected in 1990 and that the concept of grit was developed only in the 2000s, we are able to replicate only five of the eight items on Duckworth’s grit scale for children.
Appendix Table A.1 shows a detailed overview comparing our grit five-item scale to Duckworth’s eight-item grit scale. The items ‘student doesn’t take initiative, must be helped to get started and kept going on work’ and ‘student does more than assigned work’ indicate an individual’s ability to remain focused on a given goal without becoming distracted, thus representing the attribute consistency of interest. Similarly, the following three items represent the attribute perseverance of e↵ort: ‘student gets discouraged and stops trying when encounters an obstacle’, ‘student is persistent when confronted with difficult problems’, and ‘student tries to finish difficult assignments’. Factor analysis supports the validity of our concept of grit by showing that all five elements belong to the same underlying concept, with↵ = 0.87, well beyond the commonly accepted threshold of 0.7. This analysis suggests that the combination of the five elements can identify the latent variable ‘grit’. To construct the grit scale, we sum all five elements and standardise the composite scale, as is common in this strand of the literature (Alan et al., 2015). We assess the relevance of our grit scale in section 5, where we show that grit not only explains most of the increase in fourth grade test scores but is also highly correlated with long-term goal achievement at the end of high school.
The main di↵erence between Duckworth’s grit scale that from the SPQ is who completes the questionnaire. While Duckworth’s scale is a self-reported questionnaire, the SPQ is completed by teachers. This di↵erence has both advantages and disadvantages. Self-reported questionnaires are problematic because individuals tend to answer in a ‘socially desirable’ way (McDonald, 2008; Paulhus, 1991). Similarly, individuals also are prone to ‘extreme responding’, which might call into question the validity of the self-report measure (Gerhards and Gravert, 2015; Paulhus and Vazire, 2007). Finally, teachers’ reports are likely to produce a better relative measure of grit than pupils themselves, because teachers observe the behaviour of the entire class rather than just a sub-group of colleagues or friends. Relying on teachers’ evaluations has also some challenges, because teachers might be biased as 6Appendix Table A.2 shows the full questionnaire.
well (Elder, 2010). For example, the reports provided by teachers teaching smaller classes might systematically di↵er from the reports provided by teachers teaching regular classes, for reasons other than di↵erences in students’ actual behaviour. As students in smaller classes are more likely to obtain more attention from their teachers, this might result in the teachers being more likely to notice students’ actions and behaviours. This bias could exist if a pupil who was assigned to a small class during the STAR experiment receives the same teacher in fourth grade. The data shows that for our sample of 2,188 children 49 have the same teacher in fourth grade as in one of the previous grades. Of those 49 children, only four belong to the treatment group, corresponding to 0.5 per cent of the entire treated population. It is thus unlikely that the measures and results are either biased or driven by these four children, and excluding them from the sample has no impact on our results. In sum, it appears safe to assume that the treatment during the STAR experiment does not a↵ect how correct teachers’ assessments are. However, the possibility of teacher bias is still present and we attempt to tackle this issue in our robustness checks by including teacher fixed e↵ects in the regressions.
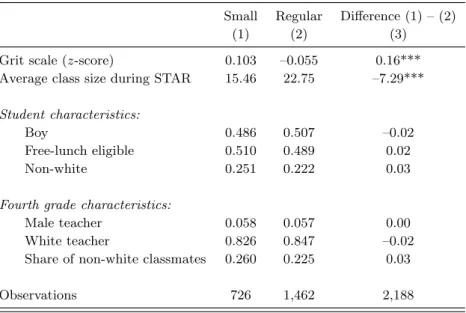
Table 1 presents descriptive statistics for our sample of 2,188 pupils, divided into treatment (column 1) and control (column 2) groups. Column 3 shows the di↵erence between the first two columns and shows whether that di↵erence is statistically significant. Three elements of Table 1 are relevant to our research design. First, pupils assigned to smaller classes were actually put in smaller classes. The average di↵erence between small and regular class size, about seven pupils, is highly significant. For each pupil, we calculate his or her class size as the average number of pupils in a class throughout Project STAR. Second, descriptive evidence already suggests that pupils assigned to smaller classes tend to score higher in grit than their counterparts in regular classes. The di↵erence in grit scale is highly significant, with an e↵ect size of roughly 0.16 standard deviations. Third, the treatment and control groups are balanced according to both student and teacher characteristics, suggesting that no observable characteristic influenced the assignment of treatments.
[ Table 1 here ]
To further examine the relation between class size and grit, Figure 1 depicts the distribution of grit for the treatment group and control group, respectively. The figure clearly shows that pupils assigned to smaller classes have higher grit than their counterparts in the control group. Overall, both Table 1 and Figure 1 suggest that smaller classes tend to produce grittier pupils. However, we need to demonstrate that this result is not due to selective attrition or other drivers, such as achievement level. We deal with these issues in sections 4 and 5.
3.2 Econometric Models
To investigate whether class size has a causal e↵ect on how gritty a pupil is, we start by estimating the following regression equation:
Gritiwcs=↵+ ·Smallwcs+Xiwcs0 +Zwcs0 +⇣ws+"iwcs (1)
where Gritiwcs is the forth-grade standardised grit scale of pupil i that entered Project STAR in
wave w and was assigned to class c at school s. Smallwcs is a dummy variable indicating whether
the student was assigned to a small class upon entering Project STAR. Xiwcs is a vector of student
characteristics, including dummy variables for gender, ethnicity and number of years of free-lunch eligibility. Similarly,Zwcs is a vector of fourth-grade characteristics, including teacher gender, teacher
ethnicity and the share of white classmates. Given that the randomisation was done at entry within
schools, we also include school-by-entry-wave fixed e↵ects (⇣ws). Adding these fixed e↵ects ensures
the independence between treatment assignment and other variables.
We estimate equation 1 by ordinary least squares (OLS). Given that Smallcsw is randomly
as-signed, provides an unbiased estimate of the intention-to-treat e↵ect of class size on grit. However, we are interested in the average treatment e↵ect of the treated of class size on grit. As Krueger (1999) and others report, pupils who were assigned to small classes had varying numbers of classmates re-sulting from mobility and enrolment di↵erences across schools. Likewise, pupils in the regular classes had variable class sizes. We thus consider a structural model that takes actual class size into account. Specifically, we estimate the following system of equations by two-stage-least-squares (TSLS):
Gritiwcs =⇡0+⇡1·CSwcs+Xiwcs0 ⇡2+Zwcs0 ⇡3+⇣ws+eiwcs
CSwcs=◆0+◆1·Smallwcs+Xiwcs0 ◆2+Zwcs0 ◆3+⌘ws+uiwcs
(2)
where the variableCSwcsis the average class size pupils had during Project STAR. Treatment
assign-ment constitutes an ideal instruassign-ment for class size, not only because the assignassign-ment is random but also because its e↵ect on grit runs entirely through class size. In this set-up we use only variation in class size due to initial assignment to a regular or small class to provide variation in actual class size in the grit equation. The coefficient of interest in equation 2 is⇡1, which represents the local average treatment e↵ect of a one-pupil increase in class size on the outcome grit.
4
Results
This section comprises three parts: the first part shows the causal relation between class size and the non-cognitive skill, grit. The second part covers the heterogeneous e↵ects of class size, and the third part provides robustness checks.
4.1 The Causal E↵ect of Class Size on Grit
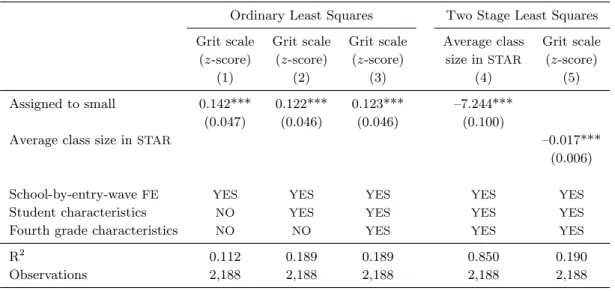
Table 2 shows the causal e↵ects of class size on grit and is divided into two parts. The first part (columns 1 to 3) presents OLS estimates with di↵erent specifications. The first specification (column 1) controls for school-by-entry-wave fixed e↵ects. The second specification (column 2) also controls for student characteristics, including gender, free-lunch eligibility and ethnicity. Column 3 shows our preferred estimate, which additionally controls for fourth grade characteristics, including teacher’s gender, teacher’s ethnicity and the share of non-white classmates. The second part (columns 4 and 5) shows the two-stage least squares estimates, using the assignment to small class as an instrument for the average class size during Project STAR.
[ Table 2 here ]
Column 1 shows highly significant (p < 0.01) di↵erences between small and regular classes. On average, students in smaller classes were 0.142 standard deviations higher in grit than their peers in regular classes. When we control for student and fourth grade characteristics (columns 2 and 3), the e↵ect slightly decreases but remains highly significant. According to our preferred estimate (column 3), students assigned to smaller classes during Project STAR are 0.123 standard deviations higher in grit in fourth grade, compared to students in regular classes.7 This e↵ect is both statistically significant and relevant in magnitude. The grit e↵ect is twice as large as the test score e↵ect in the same year (Schanzenbach, 2006) and also slightly larger than the e↵ect of class size on other non-cognitive skills found in the related literature. For example, Dee and West (2011) use the National Education Longitudinal Study to study the impact of class size on student engagement in school, estimating e↵ect sizes ranging between 0.05 and 0.09 standard deviations. We find that the impact of class size on grit is larger than the e↵ects that Dee and West found for engagement, a finding that underlines the importance of grit relative to other non-cognitive skills.
The first stage of the TSLS model (column 4) shows that the number of students in small classes is about seven students fewer than in regular classes, confirming the descriptive statistics of the average class size in Table 1. The estimates in column 5 corroborate the findings in columns 1 to 3. When the average class size increases by one student, students’ grit decreases by 0.017 standard deviations
(p < 0.01). If the class size increases by seven students, as in Project STAR, grit decreases by 0.119
standard deviations. This estimate is very close to the one we obtain with the OLS models. This closeness is due to the high implementation fidelity of the treatments in Project STAR, as also shown by the R-squared of the first stage in column 4.
To understand how each grit attribute is a↵ected by class size reduction, we estimate the relation between class size reduction and the single items on the grit scale. Appendix Table A.3, which provides 7Using the factor loadings extracted from the factor analysis as dependent variable does not change the results. Results
the results, is divided into two panels. All specifications are controlled for school-by-entry-wave fixed e↵ects, pupil and fourth grade characteristics. Panel A shows the OLS estimates, and panel B presents the TSLS estimates. In panel A, smaller classes have a positive impact on four of the five items. Pupils in a small class try harder to finish difficult assignments by 0.079 standard deviations (p < 0.10). When pupils face difficult problems (e.g. in take-home assignments), smaller classes increase pupils’ persistence by 0.144 standard deviations (p <0.01). In addition, pupils’ initiative increases by 0.101 standard deviations in small classes (p <0.05). Students’ engagement in doing more than merely the assigned work increases by 0.112 standard deviations (p <0.05), showing the increase in e↵ort spent on both in-class work and homework. When we use the TSLS approach (panel B), the estimates are in line with the findings in panel A, and the significance level remains the same relative to OLS.
4.2 Heterogeneous E↵ects
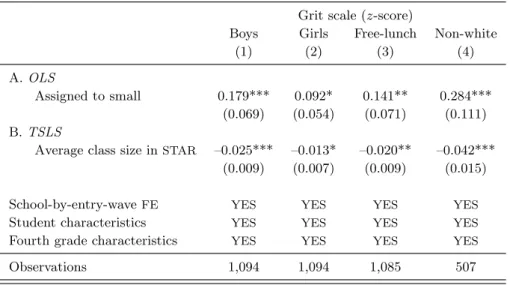
To further examine the relation between smaller classes and grit, we regress class size assignment on grit for di↵erent sub-groups, according to gender, socio-economic status and ethnicity. Table 3 presents the results for gender (columns 1 and 2), free-lunch eligibility (column 3) and ethnicity (column 4). As is common in the literature, we use free-lunch eligibility as a proxy for disadvantaged socio-economic background. We use two panels: panel A shows the OLS results, and panel B presents the TSLS estimates. Both specifications control for student characteristics, school-by-entry-wave fixed e↵ects and fourth grade characteristics.
[ Table 3 here ]
As expected, boys profit more than girls in smaller classes. Boys experience a significant increase in grit of 0.179 standard deviations compared to 0.092 standard deviations for girls. Although this di↵erence is only marginally significant (p= 0.10), it is in line with the literature showing that despite more regular class attendance, boys are more likely to su↵er from behavioural problems (Finn and Rock, 1997). A higher pupil-teacher interaction allows teachers to better control interpersonal issues in smaller classes, and they can spend more time on in-class material than on class management (Blatchford et al., 2011; Finn and Achilles, 1999). For example, external distractions are reduced, thereby allowing boys in particular to focus on in-class work (Finn et al., 2003). As a result, boys might develop persistence in e↵ort, resulting in a significant higher increase in their being gritty than for girls.
In terms of ethnicity, Project STAR schools had a larger minority fraction than did other schools in Tennessee. In addition, most minority students in Project STAR were black8(Krueger and Whitmore, 2001). Therefore, a large fraction of white students are free-lunch eligible. Not surprisingly, non-white students in smaller classes are 0.284 standard deviations grittier than their peers in regular 8Black students constitute more than 98 per cent of the non-white sub-sample.
classes (p <0.01), and low-income students profit by an increase of 0.141 standard deviations in grit in smaller classes (p <0.05). While the di↵erence in e↵ect size between white and non-white pupils is significant (p= 0.01), the di↵erence between free-lunch eligible pupils and the other pupils is not.
Our results are in line with previous findings that non-white students from lower socio-economic backgrounds profit the most from educational reforms (Finn et al., 1989; Krueger and Whitmore, 2001). Fredriksson et al. (2016) provide an explanation for this finding, which might fit also our case. Fredriksson et al. (2016) show that parents react to class size and conclude that an increase in class size causes high income parents to help their children. They also show that only low-income children find their teachers harder to follow when taught in a larger class, which might explain why we find larger e↵ects for non-white and free lunch eligible children.
4.3 Robustness Checks
To check the robustness of our estimates and test the sensitivity of our results, we perform several robustness checks. First, we test the sensitivity of our results to alternative specifications of the dependent variable. We extend our grit scale to elements that partially represent grit, but that could also overlap with other personality traits, time preferences or parental e↵ect. We then perform our main analysis using this extended grit scale, which includes the following six new elements: whether the pupil completes homework on time, whether the pupil completes in-class work, whether the pupil tries to do work well, whether the pupil approaches assignments with e↵ort, whether the pupil discusses the subject matter with the teacher outside of class and whether the pupil comes late to class (reversed). Second, we might be concerned that teacher rating standards bias the results. Di↵erent teach-ers have may have di↵erent rating standards and if this residual heterogeneity correlates with the treatment variable we could have omitted variables bias. To examine this possibility, we estimate our main models including (fourth grade) teacher fixed-e↵ects. The teacher fixed e↵ects control for heterogeneous teacher rating standards.
A third potential concern is attrition, which is a threat to both internal and external validity. In Project STAR and its follow-up studies, attrition is relatively high (Hanushek, 1999). If outcome data are missing for some pupils, one concern is that the potential outcomes for those observed in the treatment group will di↵er from the potential outcomes for those observed in the control group. Even if attrition is not di↵erent across treatments, departures could yield analytic samples that vary significantly from the population of interest, limiting the external validity of the estimated e↵ects.
In the data set for fourth grade, we have two types of attrition. First, for some students we do not have data on fourth grade, something that could happen as a result of either mobility or grade retention. From the initial sample of roughly 11,600 pupils, we have data for only 63 per cent (7,324 pupils). Second, of the fourth grade population, 10 pupils per class were randomly selected for the SPQ survey. Thus we have complete information for about 2,200 pupils, corresponding to 30 per cent
of the total fourth grade population. Although no data exists on students who did not participate in either fourth grade or the SPQ before the collection of grit information, we can look for evidence of non-random attrition by examining di↵erences in attrition rates across treatments and in observable characteristics across treatments.
To do so, we first regress an indicator of whether a pupil participated in fourth grade on the treatment dummy, and an interaction between the treatment dummy and the pupils’ characteristics. Then we perform the same analysis for the pupils who participated in the SPQ, conditional on our having fourth grade data for them.
Appendix Table A.4 presents our attrition analysis. For fourth grade data, we find that attrition rates are balanced between the treatment and control groups. This finding suggests that pupils in smaller classes were neither more nor less likely than pupils in regular classes to have progressed to fourth grade. However, boys in the control group appear slightly more likely to have left the sample by fourth grade (p <0.10). This attrition pattern is not new, as it results from boys (especially those in regular classes) being more likely to repeat grades (Konstantopoulos, 2008). For this reason, we observe slightly fewer boys in the control group than in the treatment group.
As for SPQ participation (conditional on our having fourth grade data), we find no particular pattern of non-random attrition for pupil gender, free-lunch eligibility or ethnicity. However, we observe that pupils assigned to smaller classes during Project STAR were significantly more likely to be selected for the SPQ. This di↵erence in attrition patterns is worrisome, because it could create a situation in which the treatment and control groups di↵er with respect to unobserved characteristics. If so, the internal validity of our results could be undermined. To deal with this potential problem, we perform two robustness checks. First, we compute the bounds of the treatment e↵ect based on Lee’s trimming approach (Lee, 2009). This approach applies to research designs such as ours, in which the regressor of interest is assumed to be exogenous and the dependent variable is missing in a potentially non-random manner. Lee’s approach yields the tightest bounds on average treatment e↵ects consistent with the observed data, and these bounds can be further tightened if we include baseline characteristics.9
The second strategy for dealing with attrition is to impute grit scales for pupils who did not participate in the SPQ. We adopt a worst-case scenario and predict the grit of pupils who left the control group as if they had been assigned to smaller classes. Conversely, we predict grit scales for pupils who left the treatment group as if they had received no treatment. This imputation technique should lead to both an increase in average grit for the control group and a decrease in average grit for the treatment groups.
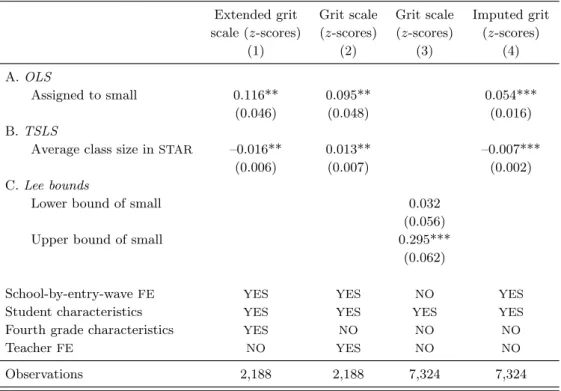
Table 4 presents the results of our robustness checks. It shows that using the extended grit scale 9The key assumption is a monotonicity restriction on how the assignment to treatment a↵ects selection, a restriction
does not change the main result of the paper (column 2). Although including additional elements yields slightly less precise coefficients and moderately smaller e↵ect sizes, the e↵ect on grit of reducing class size is always positive and significant – a finding that likely indicates that the additional items are adding noise to the grit measure.
Column 2 shows how the e↵ect of smaller classes changes when we include the teacher fixed e↵ects. Both the intention-to-treat e↵ect and the second stage e↵ect are smaller in magnitude, as Dee and West (2008) also find for their outcomes. However, in contrast to Dee and West (2008), the impact of smaller classes on grit remains significant at the five per cent level. That finding indicates that even by keeping teachers’ rating standards constant, the e↵ect of smaller classes on grit remains.
[ Table 4 here ]
In column 3, following Lee’s trimming approach, we compute the treatment e↵ect bounds. This procedure estimates a lower bound and an upper bound of the true e↵ect of being assigned to smaller classes. The bounds are computed through using all the students participating in fourth grade (7,324), not only those selected for the SPQ. We find that the lower bound is positive but not statistically di↵erent from zero. The upper bound is positive and significant with a magnitude of 0.3 standard deviations. We conclude that, under reasonable assumptions and using the information available in the data, the e↵ect of smaller classes on grit is zero at worst.
Finally, in column 4 we impute the missing grit scales using the worst-case scenario described previously. The idea is to assume that those who did not participate in the SPQ were the grittier students of the control group and the least gritty pupils of the treatment group. Doing so reduces the causal e↵ect of smaller classes on grit scale in terms of magnitude (by about two-thirds) but not in terms of significance. This finding suggests that even in a worst-case scenario the e↵ect of smaller classes on grit remains positive and significant.
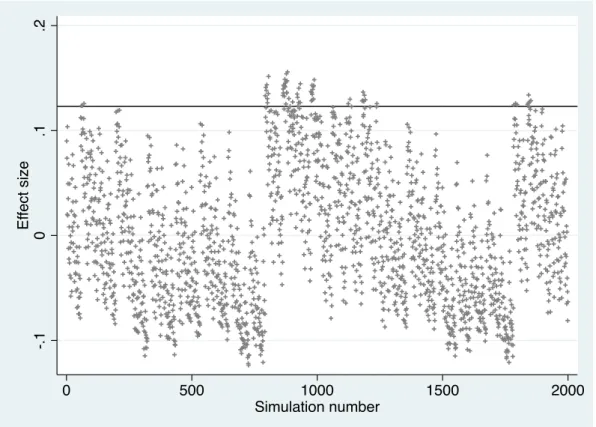
One final concern could be that small classes have significant murky e↵ects on all kinds of student skills, and our measure for grit is just picking up some of these e↵ects. If this was the case, our grit scale would be no better that a random mix of items measured by the SPQ. To address this concern, we perform the following permutation test: we select five elements at random from all the non-cognitive items on the SPQ and construct a new index in the same way we construct grit. Then we estimate the e↵ect of smaller classes on the random index. We repeat this procedure 2,000 times and plot the e↵ect sizes for each simulation. Appendix Figure A.1 shows the results of this permutation exercise, where the solid line indicates the e↵ect of small on our grit scale. We find that our grit scale is more a↵ected by class size than most other randomly selected indices of non-cognitive skills. In detail, 66 times a random index yields e↵ect sizes larger than that of grit. Therefore, the e↵ect on grit is larger than 96.7 per cent of the other random five-element indices. The result of this permutation test supports the view that grit really is a distinct skill a↵ected by class size.
5
External Validation of the Grit Measure and Long-Term E
↵
ects
The previous section shows that grit, as measurable with the SPQ data, can be modified through class size. However, we have yet to demonstrate whether grit – or more specifically the grit-approximation we use – actually determines other outcomes relevant for policy-makers, education professionals and families. Given that the literature indicates that grit drives both educational and labour market success (Duckworth et al., 2010; Robertson-Kraft and Duckworth, 2014), we do not provide here an extensive documentation of the e↵ect of grit on such outcomes. Nonetheless, we provide a brief analysis of the e↵ect of our grit measure on later school outcomes and of the way that the mechanism operates mainly through grit rather than class size per se.
In the data, we observe each pupil’s score in the Tennessee Comprehensive Assessment Program (TCAP), the standardised achievement test used for comparing Project STAR cohorts for grades four through eight. This information is available for 1,832 (1,693) students in fourth (eighth) grade, corresponding to 84 (77) per cent of our sample. Additionally, for all the 2,188 students of our analytic sample, we know whether they graduated from high school on time and whether they took a college-entrance exam (ACT or SAT).
To investigate the relevance of grit for longer-term school outcomes and possibly understand the mechanism through which test scores are a↵ected, we perform a causal mediation analysis. Imai et al. (2010a) and Imai et al. (2010b) provide excellent overviews of the method. Causal mediation analysis help identify the impact of an intermediate variable (in our case grit) that lie on the pathway between the treatment (in our case class size) and school outcomes.
In a potential outcomes framework, let Gi denote the grit level of student i, Si = s her binary
treatment indicator andYi the educational school of interest. Since the individual grit is influenced by
the treatment received, two potential values exist: Gi(0) and Gi(1). However, only one of these two
values is observed fori, that is, Gi =Gi(Si). Similarly, let us define the multiple potential outcomes
asYi[Ti, Gi(Si)]. For example,Yi(1,0.5) represents the fourth grade test scores that would be observed
if student iwas assigned to a smaller class during STAR and then has a grit score of 0.5.
Given this notation, Imai et al. (2010a) define the following causal indirect e↵ect of grit as follows:
µi(s) =Yi[s, Gi(1)] Yi[s, Gi(0)] (3)
for t = 0,1. Therefore, the causal mediation e↵ect µ represents the indirect e↵ect of class size on a given school outcome that operates only through grit. Similarly, we can define the direct e↵ect of small class on the outcome of interest as follows:
where ⌫ represents the direct e↵ect of small class on student i’s school outcomes while keeping her grit constant at the level that would be realized under the such treatment. Finally, the total e↵ect of the treatment is given by the following equation:
⌧i =Yi[1, Gi(1)] Yi[0, Gi(0)]⌘ 1 2 1 X t=0 [µi(s) +⌫i(s)] (5)
Since we are interested in average e↵ects, we can compute ¯µ(s), ¯⌫(s) and ¯⌧ by averaging over the sample under analysis. In practice, we first estimate a linear system of equations10and then calculate the e↵ects of interest ¯µ(s), ¯⌫(s) and ¯⌧. ¯µ(s) represents the average causal mediation e↵ect (ACME) of grit on later school outcomes.
As Imai et al. (2010b) underscore, the identification of these direct and indirect e↵ects requires a two-statement conditional independence assumption known as sequential ignorability. Sequential ignorability requires that (i) conditional on some predetermined variables, treatment assignment is random; and that (ii) the mediator is ignorable given the observed treatment and predetermined variables. While the first condition is, in our setting, fulfilled via randomization, the second might be violated if unobserved variables that confound the relation between the outcome and grit exist (even after conditioning on treatment status and predetermined characteristics).
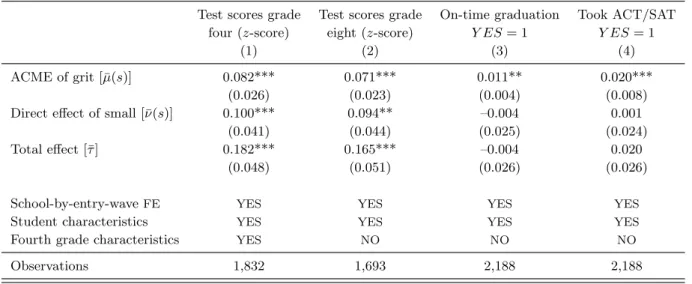
Table 5 presents the results of our causal mediation analysis for the following school outcomes: fourth grade test scores, eighth grade test scores, on-time high school graduation (binary) and college-entry exam-taking (binary). Focusing on columns 1 and two, we see that being assigned to smaller classes during Project STAR has a positive and significant e↵ect on test scores (¯⌧). This result is not new: using the same data and a slightly di↵erent sample, Schanzenbach (2006) estimates almost identical e↵ects in terms of significance and magnitude. However, we provide novel evidence that almost half of the class size e↵ect operates through grit. The ACME of grit on test scores is significant
(p <0.01) and has approximately the same magnitude as the direct e↵ect of small on test scores.
[ Table 5 here ]
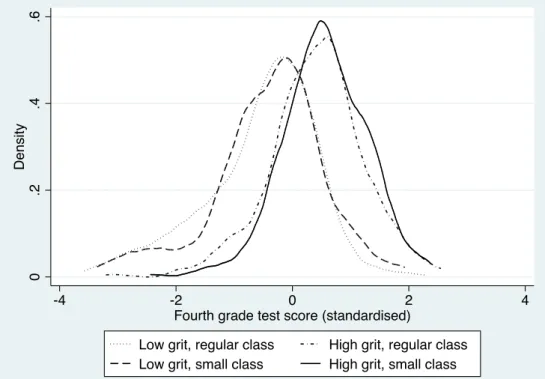
Providing a visual representation of the results of column 1 of Table 5 and further investigating the relation amongst achievement, grit and class size, Figure 2 plots the densities of test scores for four groups: low-grit pupils in regular classes, low-grit pupils in small classes, high-grit pupils in regular classes and high-grit pupils in small classes. We label pupils as ‘low grit’ if they have a grit scale below the mean and classify student as ‘high grit’ if they have an above-average grit score. The figure reveals that the main driver of test score results is grit, not class size per se. The most plausible explanation for these results, as suggested by the patterns in the data, is that class size has a positive impact on grit, which in turn leads to improved test scores. This pathway is also suggested by Cunha and 10In detail, we estimate three equations as follows: (i)Y onS, X, Z, (ii)GonS, X, Zand (iii)Y onS, G, X, Z.
Heckman (2008), who show that whilst non-cognitive skills promote the formation of cognitive skills, the reverse does not hold.
[ Figure 2 here ]
Columns 3 and 4 of Table 5 focus on high school on-time graduation and whether students took a college-entry exam, respectively. While we find no significant class size e↵ects for these two outcomes, the ACME of grit is positive and significant (p <0.05). This suggests that grit has indeed an indirect e↵ect on both on-time graduation and exam-taking behaviour, but such e↵ect is counterbalanced by other factors not related to grit. Overall, the results on long-term outcomes confirm both theoretical expectations and empirical evidence in the literature on grit (Eskreis-Winkler et al., 2014). These findings make us confident that even if we are not able to elicit grit in the exact same way as Duckworth our measure of grit indeed identifies a personality characteristic that determines test scores and long-term goal achievement and seems to capture the sense of Duckworth’s concept.
6
Conclusions
We use a follow-up study of Project STAR and show that smaller classes positively increase student grit by 0.12 standard deviations. Moreover, when we estimate the e↵ect of small classes on each item of the grit scale, pupils show significant higher persistence in e↵ort both inside (i.e. higher participation, initiative behaviour) and outside the classroom (i.e. more time end e↵ort spent on homework and preparation for tests). Sub-sample analysis reveals that pupils from disadvantaged socio-economic backgrounds and non-white pupils increase their grit significantly more in smaller classes, compared to the average student.
Several explanations exist for how class size impacts grit. First, pupils can rarely avoid the more intense pupil-teacher interaction in smaller classes, because teachers can better control their pupils. Second, pupils are less distracted by their peers in smaller classes and therefore focus more on in-class material. Third, pupils in smaller classes can more rapidly attract their teacher’s attention through an increase in engagement, either through persistence of e↵ort or consistency of interest. All three explanations create a positive feedback loop: students ‘learn’ that more engagement pays, resulting in higher persistence of e↵ort and consistency of interest.
To highlight the importance of grit, we perform additional analyses of grit e↵ects on test scores. This causal mediation analysis reveals that the main driving force of later school outcomes is grit, rather than other e↵ects of reduced class size. These findings indicate that the underlying mechanism is the following: class size positively impacts grit, which in turn leads to higher test scores. Moreover, we examine the consequences of the key ingredient of grit, that is the pursuit of long-term goals and its e↵ect on long-term outcomes. We study the relation between grit and eighth grade test scores,
on-time high school graduation, and whether a student took a college-entrance exam. Results show that gritty students score higher on tests, are more likely to graduate from high school on time and are more likely to take a college-entrance exam.
Our study adds to the extensive literature showing both the importance of non-cognitive skills and the power of educational practices. In addition, our study has two important policy implications. First, policy-makers and schools should reconsider class size as a way of promoting non-cognitive skills, particularly grit. Second, we extend the literature on class size e↵ects on (non-)cognitive skills, showing that the class size e↵ect operates for a large part through grit. Therefore, both policy-makers and researchers should consider class size as an educational practice for changing not only cognitive skills and test scores but also non-cognitive skills such as grit. Note, however, that these policy implications are valid if we assume that hypothetical reductions in class size would hold all other educational inputs constant. This ceteris paribus interpretation might not be always valid, due to the complexity of class size reductions and parents’ potential reactions to class size reductions.
References
Alan, S., Boneva, T., and Ertac, S. (2015). Ever failed, try again, succeed better: Results from a randomized educational intervention on grit. Working paper no. 2015-009, Human Capital and Economic Opportunity Global Working Group.
Antecol, H., Eren, O., and Ozbeklik, S. (2016). Peer e↵ects in disadvantaged primary schools: Evidence from a randomized experiment. Journal of Human Resources, 51(1):95–132.
Bertrand, M., Pan, J., and Kamenica, E. (2013). Gender identity and relative income within house-holds. NBER Working Papers 19023, National Bureau of Economic Research, Inc.
Blatchford, P., Bassett, P., and Brown, P. (2011). Examining the e↵ect of class size on classroom engagement and teacher-pupil interaction: Di↵erences in relation to pupil prior attainment and primary vs. secondary schools. Learning and Instruction, 21(6):715–730.
Borghans, L., Duckworth, A. L., Heckman, J. J., and Weel, B. (2008). The economics and psychology of personality traits. Journal of Human Resources, 43(4):972–1059.
Chamorro-Premuzic, T. and Furnham, A. (2003). Personality predicts academic performance: Evi-dence from two longitudinal university samples. Journal of Research in Personality, 37(4):319–338.
Chetty, R., Friedman, J. N., Hilger, N., Saez, E., Schanzenbach, D. W., and Yagan, D. (2011). How does your kindergarten classroom a↵ect your earnings? Evidence from Project STAR.The Quarterly Journal of Economics, 126(4):1593–1660.
Culin, K. R. V., Tsukayama, E., and Duckworth, A. L. (2014). Unpacking grit: Motivational correlates of perseverance and passion for long-term goals. Journal of Positive Psychology, 9(4):306–312.
Cunha, F. and Heckman, J. J. (2008). Formulating, identifying and estimating the technology of cognitive and noncognitive skill formation. Journal of Human Resources, 43(4):738–782.
Dee, T. and West, M. (2008). The non-cognitive returns to class size. Technical report, National Bureau of Economic Research.
Dee, T. S. (2007). Teachers and the gender gaps in student achievement. Journal of Human Resources, 42(3):528–554.
Dee, T. S. and West, M. R. (2011). The non-cognitive returns to class size. Educational Evaluation and Policy Analysis, 33(1):23–46.
Doyle, O., Harmon, C. P., Heckman, J. J., and Tremblay, R. E. (2009). Investing in early human development: Timing and economic efficiency. Economics & Human Biology, 7(1):1–6.
Duckworth, A. (2016). Grit: The Power of Passion and Perseverance. Simon and Schuster, New York (USA).
Duckworth, A. L. and Gross, J. J. (2014). Self-control and grit: Related but separable determinants of success. Current Directions in Psychological Science, 23(5):319–325.
Duckworth, A. L., Kirby, T. A., Tsukayama, E., Berstein, H., and Ericsson, K. A. (2010). Deliberate practice spells success: Why grittier competitors triumph at the national spelling bee. Social Psychological and Personality Science, 2(2):174–181.
Duckworth, A. L., Peterson, C., Matthews, M. D., and Kelly, D. R. (2007). Grit: Perseverance and passion for long-term goals. Journal of Personality and Social Psychology, 92(6):1087–1101.
Duckworth, A. L. and Quinn, P. D. (2009). Development and validation of the short grit score (grit-s).
Duckworth, A. L. and Seligman, M. E. P. (2006). Self-discipline gives girls the edge: Gender in self-discipline, grades, and achievement test scores. The Journal of Educational Psychology, 98(1):198– 208.
Elder, T. E. (2010). The importance of relative standards in ADHD diagnoses: evidence based on exact birth dates. Journal of Health Economics, 29(5):641–656.
Eskreis-Winkler, L., Duckworth, A. L., Shulman, E. P., and Beal, S. (2014). The grit e↵ect: Predicting retention in the military, the workplace, school and marriage. Frontiers in Psychology, 5(Feb):1–12.
Finn, J. D. and Achilles, C. M. (1990). Answers and questions about class size: A statewide experiment.
American Educational Research Journal, 27(3):557–577.
Finn, J. D. and Achilles, C. M. (1999). Tennessee’s class size study: Findings, implications, miscon-ceptions. Educational Evaluation and Policy Analysis, 21(2):97–109.
Finn, J. D., Fulton, D., Zaharias, J., and Nye, B. A. (1989). Carry-over e↵ects of small classes. The Peabody Journal of Education, 67(1):75–84.
Finn, J. D., Pannozzo, G. M., and Achilles, C. M. (2003). The “why’s” of class size: Student behavior in small classes. Review of Educational Research, 73(3):321–368.
Finn, J. D. and Rock, D. A. (1997). Academic success among students at risk for school failure. The Journal of Applied Psychology, 82(2):221–234.
Folger, J. and Breda, C. (1989). Evidence from Project STAR about class size and student achievement.
Peabody Journal of Education, 67(1):17–33.
Fredriksson, P., ¨Ockert, B., and Oosterbeek, H. (2016). Parental responses to public investments in children: Evidence from a maximum class size rule. Journal of Human Resources, 51(4):832–868.
Gerhards, L. and Gravert, C. (2015). Grit trumps talent? An experimental approach. Economics Working Papers 2015-18, Department of Economics and Business Economics, Aarhus University (Denmark).
Hanushek, E. A. (1999). Some findings from an independent investigation of the Tennessee STAR experiment and from other investigations of class size e↵ects. Educational Evaluation and Policy Analysis, 21(2):143–163.
Heckman, J. J. and Kautz, T. (2012). Hard evidence on soft skills. Labour Economics, 19(4):451–464.
Heckman, J. J. and Mosso, S. (2014). The economics of human development and social mobility. IZA Discussion Papers 8000, Institute for the Study of Labor (IZA).
Heckman, J. J., Pinto, R., and Savelyev, P. (2013). Understanding the mechanisms through which an influential early childhood program boosted adult outcomes. American Economic Review, 103(6):2052–2086.
Heckman, J. J. and Rubinstein, Y. (2001). The importance of noncognitive skills: Lessons from the GED testing program. American Economic Review, 91(2):145–149.
Heckman, J. J., Stixrund, J., and Urzua, S. (2006). The e↵ects of cognitive and noncognitive abilities on labor market outcomes and social behavior. The Journal of Labor Economics, 24(3):411–482.
Imai, K., Keele, L., and Tingley, D. (2010a). A general approach to causal mediation analysis.
Psychological Methods, 15(4):309–334.
Imai, K., Keele, L., and Yamamoto, T. (2010b). Identification, inference and sensitivity analysis for causal mediation e↵ects. Statistical Science, 25(1):51–71.
Jepsen, C. and Rivkin, S. (2009). Class size reduction and student achievement: The potential tradeo↵
between teacher quality and class size. Journal of Human Resources, 44(1):223–250.
Kautz, T., Heckman, J. J., Diris, R., ter Weel, B., and Borghans, L. (2014). Fostering and measuring skills: Improving cognitive and non-cognitive skills to promote lifetime success. NBER Working Papers 20749, National Bureau of Economic Research, Inc.
Konstantopoulos, S. (2008). Do small classes reduce the achievement gap between low and high achievers? Evidence from Project STAR. The Elementary School Journal, 108(4):275–291.
Krueger, A. B. (1999). Experimental estimates of education production functions. The Quarterly Journal of Economics, 114(2):497–532.
Krueger, A. B. and Whitmore, D. M. (2001). The e↵ect of attending a small class in the early grades on college-test taking and middle school test results: Evidence from Project STAR. The Economic Journal, 111(468):1–28.
Lazear, E. P. (2001). Educational production. The Quarterly Journal of Economics, 116(3):777–803.
Lee, D. S. (2009). Training, wages, and sample selection: Estimating sharp bounds on treatment e↵ects. The Review of Economic Studies, 76(3):1071–1102.
Maddi, S. R. (2006). Hardiness: The courage to grow from stresses. Journal of Positive Psychology, 1(3):160–168.
McCrae, R. R. and John, O. P. (1992). An introduction to the five-factor model and its applications.
Journal of Personality, 60(2):175–215.
McDonald, J. D. (2008). Measuring personality constructs: The advantages and disadvantages of self-reports, informant reports and behavioural assessments. Enquire, 1(1):1–18.
Paulhus, D. L. (1991). Measurement and control of response bias. In Robinson, J. P., Shaver, P. R., and S, W. L., editors, Measures of Personality and Social Psychological Attitudes, chapter 2, pages 17–59. Academic Press, San Diego (USA).
Paulhus, D. L. and Vazire, S. (2007). The self-report method. Handbook of Research Methods in Personality Psychology, 1:224–239.
Robertson-Kraft, C. and Duckworth, A. L. (2014). True grit: Trait-level perseverance and passion for long-term goals predicts e↵ectiveness and retention among novice teachers. Teachers College Record, 166(3):1–27.
Schanzenbach, D. W. (2006). What have researchers learned from Project STAR? Brookings Papers on Education Policy, 9(2006-2007):205–228.
Segal, C. (2008). Classroom behavior. Journal of Human Resources, 43(4):783–814.
Segal, C. (2013). Misbehavior, education, and labor market outcomes. Journal of the European Economic Association, 11(4):743–779.
Word, E., Johnston, J., Bain, H. P., Fulton, B., Zaharias, J. B., Achilles, C. M., Lintz, M. N., Folger, J., and Breda, C. (1990). The state of Tennessees Student/Teacher Achievement Ratio (STAR) Project: Final summary report 1985-1990. Nashville: Tennessee State Department of Education (USA).
Tables and Figures
Table 1: Descriptive Statistics
Small Regular Di↵erence (1) – (2)
(1) (2) (3)
Grit scale (z-score) 0.103 –0.055 0.16***
Average class size during STAR 15.46 22.75 –7.29***
Student characteristics:
Boy 0.486 0.507 –0.02
Free-lunch eligible 0.510 0.489 0.02
Non-white 0.251 0.222 0.03
Fourth grade characteristics:
Male teacher 0.058 0.057 0.00
White teacher 0.826 0.847 –0.02
Share of non-white classmates 0.260 0.225 0.03
Observations 726 1,462 2,188
Notes: ***p <0.01, **p <0.05, *p <0.10. Ordinary least squares models with robust standard errors clustered at the classroom level. Regressions in column 3 include school-by-entry-wave fixed e↵ects.
Table 2: Effect of Class Size on Grit Scale, OLS and TSLS
Ordinary Least Squares Two Stage Least Squares Grit scale Grit scale Grit scale Average class Grit scale
(z-score) (z-score) (z-score) size inSTAR (z-score)
(1) (2) (3) (4) (5)
Assigned to small 0.142*** 0.122*** 0.123*** –7.244***
(0.047) (0.046) (0.046) (0.100)
Average class size inSTAR –0.017***
(0.006)
School-by-entry-waveFE YES YES YES YES YES
Student characteristics NO YES YES YES YES
Fourth grade characteristics NO NO YES YES YES
R2 0.112 0.189 0.189 0.850 0.190
Observations 2,188 2,188 2,188 2,188 2,188
Notes: ***p <0.01, **p <0.05, *p <0.10. Robust standard errors clustered at the classroom level are in parentheses. Student characteristics include gender, years of free-lunch eligibility and ethnicity. Fourth grade characteristics include teacher’s gender, teacher’s ethnicity and the share of non-white classmates. Project STAR and Beyond database.
Table 3: Sub-Sample Analysis, OLS and TSLS Grit scale (z-score)
Boys Girls Free-lunch Non-white
(1) (2) (3) (4)
A.OLS
Assigned to small 0.179*** 0.092* 0.141** 0.284***
(0.069) (0.054) (0.071) (0.111) B.TSLS
Average class size inSTAR –0.025*** –0.013* –0.020** –0.042*** (0.009) (0.007) (0.009) (0.015)
School-by-entry-waveFE YES YES YES YES
Student characteristics YES YES YES YES
Fourth grade characteristics YES YES YES YES
Observations 1,094 1,094 1,085 507
Notes: ***p <0.01, **p <0.05, *p <0.10. Robust standard errors clustered at the classroom level are in parentheses. Student characteristics include gender, years of free-lunch eligibility and ethnicity. Fourth grade characteristics include teacher’s gender, teacher’s ethnicity and the share of non-white classmates. Project STAR and Beyond database.
Table 4: Robustness Checks
Extended grit Grit scale Grit scale Imputed grit scale (z-scores) (z-scores) (z-scores) (z-scores)
(1) (2) (3) (4)
A.OLS
Assigned to small 0.116** 0.095** 0.054***
(0.046) (0.048) (0.016)
B.TSLS
Average class size inSTAR –0.016** 0.013** –0.007***
(0.006) (0.007) (0.002)
C.Lee bounds
Lower bound of small 0.032
(0.056)
Upper bound of small 0.295***
(0.062)
School-by-entry-waveFE YES YES NO YES
Student characteristics YES YES YES YES
Fourth grade characteristics YES NO NO NO
TeacherFE NO YES NO NO
Observations 2,188 2,188 7,324 7,324
Notes: ***p <0.01, **p <0.05, *p <0.10. Robust standard errors are in parentheses (clustered at the classroom level in columns 1 and 2, bootstrapped with 500 repetitions in column 3, clustered at the school-by-entry-wave level in column 4). Student characteristics include gender, years of free-lunch eligibility and ethnicity. Fourth grade characteristics include teacher’s gender, teacher’s ethnicity and the share of non-white classmates.
Table 5: Effect of Grit on School Outcomes Controlling for Class Size
Test scores grade Test scores grade On-time graduation Took ACT/SAT four (z-score) eight (z-score) Y ES= 1 Y ES= 1
(1) (2) (3) (4)
ACME of grit [¯µ(s)] 0.082*** 0.071*** 0.011** 0.020***
(0.026) (0.023) (0.004) (0.008)
Direct e↵ect of small [¯⌫(s)] 0.100*** 0.094** –0.004 0.001
(0.041) (0.044) (0.025) (0.024)
Total e↵ect [¯⌧] 0.182*** 0.165*** –0.004 0.020
(0.048) (0.051) (0.026) (0.026)
School-by-entry-waveFE YES YES YES YES
Student characteristics YES YES YES YES
Fourth grade characteristics YES NO NO NO
Observations 1,832 1,693 2,188 2,188
Notes: ***p <0.01, **p <0.05, *p <0.10. Robust standard errors clustered are in parentheses (clustered at the classroom level in column 1, clustered at the school-by-entry-wave level in columns 2-3-4). Inference for the ACME is performed vie Delta method. Student characteristics include gender, years of free-lunch eligibility and ethnicity. Fourth grade characteristics include teacher’s gender, teacher’s ethnicity and the share of non-white classmates. Test scores are from the Tennessee Comprehensive Assessment Program.
Figure 1: Kernel Density of Grit by Treatment Group 0 .1 .2 .3 .4 D e n si ty -3 -2 -1 0 1 2
Grit scale (standardised) Regular class Small class
Figure 2: Density Plot of Test Scores in Grade 4, Divided by Grit Level and Treatment Group 0 .2 .4 .6 D e n si ty -4 -2 0 2 4
Fourth grade test score (standardised)
Low grit, regular class High grit, regular class Low grit, small class High grit, small class
T ab le A. 1: The Five -I te m Gri t Scale Co m pare d to Duck w o r th’s E ight-Ite m Grit Scale E igh t-it em G ri t S ca le F o r C h il d ren Du ckw o rt h et a l. (2 0 0 7 ) F ive-it em G ri t S ca le A d a p te d fr o m S P Q 1. Ne w id eas an d p ro je ct s som et im es d is tr ac t m e fr om p re v iou s on es . — 2. S et b ac k s (d el ay s an d ob st ac le s) d on ’t d is cou rage m e. I b ou n ce b ac k fr om d is ap p oi n tm en ts fas te r th an m os t p eop le . S tu d en t ge ts d is cou rage d an d st op s tr y in g w h en en cou n te rs an ob st ac le . 3. I h av e b ee n ob se ss ed w it h a ce rt ai n id ea or p ro je ct for a sh or t ti m e b u t lat er los t in te re st . S tu d en t d o es n ’t tak e in it iat iv e, m u st b e h el p ed to ge t st ar te d an d k ep t goi n g on w or k . 4. I am a h ar d w or ke r. S tu d en t is p er si st en t w h en con fr on te d w it h d i ffi cu lt p rob le m s. 5. I of te n se t a goal b u t lat er ch o os e to p u rs u e (f ol lo w ) a d i ↵ er en t on e. — 6. I h av e d i ffi cu lt y m ai n tai n in g (k ee p in g) m y fo cu s on p ro je ct s th at tak e m or e th an a fe w m on th s to com p le te . — 7. I fi n is h w h at ev er I b egi n . Studen t tries to finish di ffi cu lt as si gn m en ts . 8. I am d il ige n t (h ar d w or k in g an d car ef u l) . S tu d en t d o es m or e th an ju st th e as si gn ed w or k .