Repetitive Activity Counter Estimation Technique
on the Acceleration Data
Ahmad Sayuthi bin Mohamad Shokri2,3, Wira Hidayat bin Mohd Saad1,4, Lai Guan Mun2, Nur Amirah binti Kamaruzaman1 Siti Asma Binti Che Aziz2,4
1Faculty of Electronic and Computer Engineering, Universiti Teknikal Malaysia Melaka (UTeM), Melaka, Malaysia 2Faculty of Engineering Technology (FTK), Universiti Teknikal Malaysia Melaka (UTeM), Melaka, Malaysia 3Centre for Technopreneurship Development(CTeD), Universiti Teknikal Malaysia Melaka (UTeM), Melaka, Malaysia 4Centre for Telecommunication Research & Innovation (CETRI),Universiti Teknikal Malaysia Melaka (UTeM), Melaka,
Malaysia [email protected]
Abstract—Smartphone devices are very useful since they were
equipped with multiple sensors such as an accelerometer sensor, gyroscope sensor, magnetometer sensor and others. The availability of these sensors allows the user to track and record the data when users undergo exercise activity especially walking activity. A step counter is a tool that calculates the step taken by the user when performing their walking activity. In this paper, the accelerometer sensor was used to collect the acceleration data for the x-axis, y-axis, and z-axis. The data collected from the sensor was filtered before applied for counting steps to avoid inaccurate detection since signals collected consist of noise signal as well. Peak detection method used to determine the number of steps taken by the user during their exercise activity. The experimental test was carried out for two types of repetition exercise activity which are cardiovascular activity and weightlifting activity. The smartphone devices were placed on the hand and in the pocket. The results that are obtained from this test is recorded and validated with the manual counting.
Keywords—Acceleration; Filter; Peak Detection; Step Count.
I. INTRODUCTION
Nowadays, people around the world are concerned about their health, and hence, they are more attentive to the physical activity since this activity is proven that can give a benefit for losing weight, keeping themselves healthy, protects themselves from a certain disease, etc. [1]. Unfortunately, in practice, there are problems to be faced when encouraging people to perform their exercise activity every day in order to maintain their personal health [2][3]. Logging the exercise will help the user to keep motivated and maintain their discipline [4]. Therefore, the smartphones devices are offering a solution to solve this problem because they are embedded with lots of sensors such as an accelerometer, magnetometer, gyroscopes, orientation sensor that can use for monitoring and measure the physical activity of the user [5].
In this paper, a step counting algorithm is proposed to identify the steps count of user’s activity while it positions the smartphone devices on different parts of user’s body such as hand, or just put it in the pocket [5]. The step counting algorithm for this project is utilizing the acceleration values of x, y, and a z-axis that are obtained from the accelerometer sensor in a smartphone device [6]. The data that collected from the acceleration sensor is filtered by using a simple low-pass filter. The filtered data will be used to count the number of step by applying a peak detection method, which means one
peak signal detected is considered as one step. In addition, three experiments were carried out for repetition exercise activity. First test was jogging activity test, four placements of smartphone device on user body part position such as on the left and right-hand position and in left and right pocket position [7]. Second test was a cardiovascular activity test which consists of four activities such as walking, running, cycling and skipping. Third test carried out was weight-lifting activity, such as push-up, sit-up, pull-up, squat, and weight-bar activity [8]. Both repetition exercise activity is tested by placing the smartphone device on the right-hand position of the user by using the armband [9].
II. METHODOLOGY
A. Raw data measurement
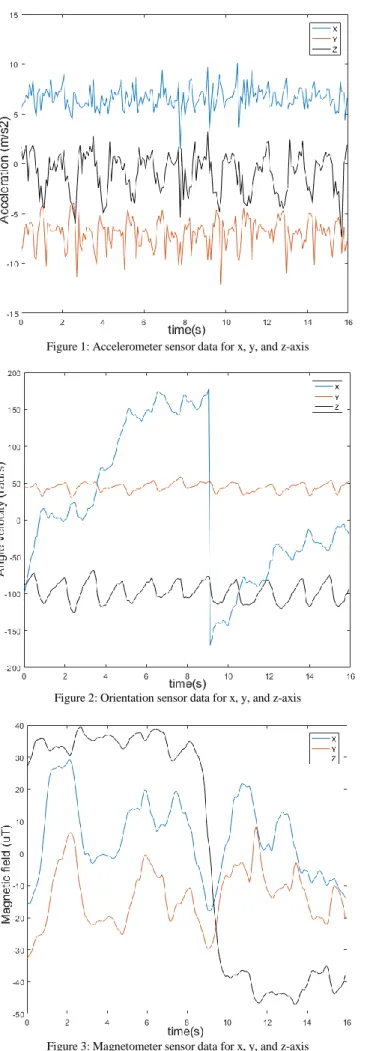
In order to track the exercise activity that performed by the user, MATLAB Mobile and MATLAB software for PC are synchronized via Wi-Fi connection. Some of the acceleration data such as accelerometer sensor, magnetometer sensor and orientation sensor in smartphone device can be collected while doing the exercise activity [10]. When this two MATLAB version were connected to each other, the sensors in MATLAB mobile is turned on and ready to send the data to the PC side for the logging process. The data collecting process is started based on an exercise that is performed by the user. Figure 1, Figure 2 and Figure 3 show the graphical data obtained from three type of sensors that embedded in smartphone device for walking activity. From the illustration of these three figures, the accelerometer sensor data shows the best pattern and consistency of data obtained from walking activity in comparison to other sensors data.
B. Filter on acceleration data
Filtering is a method to remove high-frequency fluctuations of the signal data obtained. Low-pass filtering is used in this project to remove a noise signal which will affect the result of the overall analysis [11]. There are two examples most common using a low-pass filter in the current analysis, and this filter is purposed as a quantification of peaks in the signal by shifting the peak location and differentiation of the amplified noise.
Figure 1: Accelerometer sensor data for x, y, and z-axis
Figure 2: Orientation sensor data for x, y, and z-axis
Figure 3: Magnetometer sensor data for x, y, and z-axis
There are two types of common low pass filter which are a finite impulse response (FIR) and infinite impulse response
(IIR). These two design techniques are computed and specify the filter function based on their specifications. For this study, low pass IIR Butterworth filter is used. This filter is used to filter the signal collected from the accelerometer sensor and remove the noise from the signal to avoid the data become unreliable. It is preferred in this project because human motion speed during activity normally falls in the frequency range of 0.1 to 2.0 Hz. In this study, raw sensor data that are collected from the smartphone devices consist of random variations caused by interference or noise. In order to obtain the accurate data, digital filters are applied to the data collected [12].
Figure 4 shows an example of before and after the effect of a low –pass filter that being apply to walk activity x-axis acceleration data. The graphs show signal collected is smoothened after the low-pass filter is used to remove the noise in the signal.
Figure 4: The acceleration data of the x-axis before and after the filter
C. Step counting
After the filtering process of the acceleration data is done, the step counting algorithm is applied by finding the correlation of one peak of the signal data as a one step for the acceleration data between three axes: x, y, and z-axis.
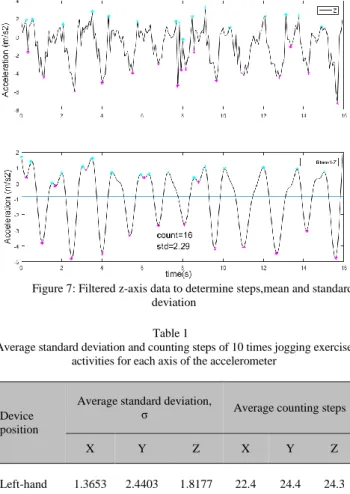
Then, the number of peaks for minimum lower peak and higher peak of the signal is detected and counts. Figure 5, Figure 6 and Figure 7 show the example of peak detection as a counting step for acceleration data for x, y, and z-axis when performing exercise activity. The points that are shown in the figure represent one peak or one count. The right value of acceleration direction to represent the step count is determined either for x, y or z-axis acceleration data. From the graph, the x-axis gives a value of step counting around 20 steps; y-axis gives a value of step counting around 22 while z-axis gives the value of step counting around 16 steps.
D. Average standard deviation and counting steps
The standard deviation (SD) and the mean value was calculated as well for this counting step in order to find which acceleration of x, y, and the z-axis is giving the higher value of standard deviation [12]. The differences between the standard deviations of each of the acceleration towards data x, y and z are plotted and shown in Figure 5, Figure 6 and Figure 7. These data were collected from walking activity with the devices positioned on the hand. As can be seen on each figure, a mean horizontal line of all peaks was plotted in
each graph. When the standard deviation is higher during the exercise activity, it indicates the movement is conspicuous. The formula for the standard deviation of minimum and peaks are as shown.
(1)
n = total number of minimum and maximum peak x = each minimum and maximum peak value in the data set
µ = mean of all values in data set
Figure 5: Filtered x-axis data to determine steps,mean and standard deviation
Figure 6: Filtered y-axis data to determine steps,mean and standard deviation
III. RESULTS AND ANALYSIS
A. The different site of sensor location
Jogging activity test was carried out to find out the effect of different site on the sensor location. The device is placed at four different positions of the user which are in the left pocket, in the right pocket, on the left hand, and on right hand. Jogging experiment test is performed by collecting ten samples of data for each of the position to analyze the pattern of the acceleration data for this activity and also to determine the step counting. The average of repeated collected data was calculated and tabulated in Table 1.
Figure 7: Filtered z-axis data to determine steps,mean and standard deviation
Table 1 Average standard deviation and counting steps of 10 times jogging exercise
activities for each axis of the accelerometer
Device position
Average standard deviation,
σ Average counting steps
X Y Z X Y Z Left-hand 1.3653 2.4403 1.8177 22.4 24.4 24.3 Right-hand 1.4252 1.4210 1.6926 20.2 21.4 22.0 Left pocket 1.2903 0.9727 1.3787 18.6 20.7 18.4 Right pocket 0.8710 1.1377 1.3640 19.8 18.3 18.6
Table 1 shows that the result is more consistent when the device was positioned on the left hand and right hand compared to placed in the left pocket and right pocket. This result shows that when the device is placed in the pocket during cardiovascular activity, a lot of unnecessary movement will be detected and causing the data to be inaccurate. Since most of the population was a right-hander, therefore the repetitive exercise was continued by placing the smartphone device on the right hand.
B. Cardiovascular activity test
On the testing done for the cardiovascular activities were divided into five activities which are jogging, cycling, running, walking and skipping. Each of the cardiovascular activity was tested with ten samples of the data in the same position which are on right-hand position. This experiment was carried out to determine the number of steps taken by the user for each of the cardiovascular activity. Table 2 shows an average of step count and standard deviation for 10 times of the five activities performed by the user during a cardiovascular activity.
Table 2
Average standard deviation and counting steps of 10 times cardiovascular exercise activities for each axis of the accelerometer
Cardiovascular activity type
Average standard deviation, σ Average counting steps X Y Z X Y Z Jogging 1.4252 1.4210 1.6926 20.2 21.4 22.0 Cycling 0.9243 3.4422 1.7377 18.0 17.5 17.7 Running 5.0254 3.0541 2.7989 23.3 24.6 22.0 Walking 0.8393 0.8959 1.5830 21.1 21.2 16.1 Skipping 4.1510 3.0513 3.1404 12.5 11.0 11.8
From the table, it shows extreme exercise, such as jogging and running, gave a higher result of steps. While during cycling and skipping, the result obtains would be lower. This phenomenon occurred might because during extreme exercise, the body movement will affect the device to collect unnecessary body movement acceleration data which will lead to more counting steps recorded.
C. Weight-lifting activity
For the weight lifting activity, it is divided into five activities which are push-up, weight-bar, sit-up, pull-up and squat activity. Each of the activity is tested with ten sample of the data in the same position which is on the right-hand position using an armband to observe and determine the number of steps taken by a user when performing each of this weight-lifting activity. The experimental result data that are obtained from these weight-lifting activities are collected. Then, data for each activity were average up and tabulated in Table 3. From the table, the result shows that each exercise was able to determined although the standard deviation was not consistent. The standard deviation will give a higher value when the peak to peak count was significantly away from the mean value.
Table 3
Average standard deviation and counting steps of 10 times weight-lifting exercise activities for each axis of the accelerometer
Weight-lifting activity type
Average standard deviation,
σ Average counting steps
X Y Z X Y Z Push-up 1.6356 0.8649 1.6545 14.2 14.6 14.5 Sit-up 2.6609 7.2677 5.8124 12.2 9.2 9.8 Pull-up 2.9812 4.0225 3.1961 15.8 11.9 12.2 Stuart 2.0997 1.3290 1.7874 13.3 14.0 16.4 Weight-bar 1.0784 0.8913 0.7723 15.8 16.4 15.2
Referring Table 2 and Table 3, weight-lifting exercise gave a lower average standard deviation compared to cardiovascular activity, which means weight-lifting exercise gave a smoother pattern in the graph after the filter. This might occur because weight-lifting activity only repeated on a certain group of muscle while cardiovascular activity involves the whole body movement which may contain a lot of unnecessary movement. Therefore, this algorithm performed better in determining repetitive weight-lifting activity instead of cardiovascular activity.
IV. CONCLUSION
This project involved the designing of the algorithm for step-counting by using accelerometer sensor that embedded in smartphone device to track the exercise activity. After this project is completed, it can be concluded that the step counting algorithm can be developed to count the number of step of each of the repetition exercise activity such as for cardiovascular activity and weight-lifting activity by using peak detection algorithm method. From the result obtained, we can conclude that the algorithm gave the best result when placed on hand during jogging activities. While during weightlifting activity, the pattern of the graph is smoother compare to cardiovascular activity since weight-lifting activity gives more repetitive activity.
ACKNOWLEDGMENT
Authors would like to thank Machine Learning & Signal Processing (MLSP) research group under Center for Telecommunication Research and Innovation (CeTRI) and Rehabilitation Engineering & Assistive Technology (REAT) research group under Center of Robotics & Industrial Automation (CeRIA) of Universiti Teknikal Malaysia Melaka (UTeM), Faculty of Electronics and Computer Engineering (FKEKK), Universiti Teknikal Malaysia Melaka (UTeM) for the use of existing facilities to complete this project. Authors would also like to thank the Ministry of Higher Education (MOHE), Malaysia for sponsoring this work under project RAGS/1/2014/ICT06/FKEKK/B00065.
REFERENCES
[1] Matthias Kranz, A. M. (2012). The mobile fitness coach: Towards individualized skill assessment using personalized mobile devices. Pervasive and Mobile Computing, doi:10.1016.
[2] Nusrat Jahan, M. A. (2013). Walking Steps Counting and Distance Measurement on User Smart Phone. NCICIT 2013: 1st National Conference on Intelligent Computing and Information,Technology . [3] Haley Andrews, N. F. (2015). SAM Fitness: An Android Wellness
Application. Worcester Polytechnic Institute.
[4] Jatuporn Chinrungrueng, S. S. (2014). My act: an automatic detection of daily physical activity and calorie expenditure using smart phones. Journal of Assistive, Rehabilitative & Therapeutic Technologies, Vol 2.23187
[5] Ms. Najme Zehra Naqvi, D. A. (2012). Step Counting Using Smartphone-Based Accelerometer. International Journal on Computer Science and Engineering (IJCSE), Vol. 4 No. 05.
[6] Qingchi Zeng, B. Z. (2014). A Simple Step Counting Method Based on Smartphone Acceleration Sensors. Winter, 87-88.
[7] Ying-Wen Bai, C.-H. Y., & Wu, S.-C. (2014). Using a Three-Axis Accelerometer and GPS Module in a Smart Phone to Measure Walking Steps and Distance. CCECE.
[8] Melis Oner, J. A.-S. (2012). Towards the Run and Walk Activity Classification through Step Detection – An Android Application. 2012 Annual International Conference of the IEEE Engineering in Medicine and Biology Society. IEEE.
[9] Huang, X. Y. (2015). An Accurate Step Detection Algorithm Using Unconstrained Smartphones . 27th Chinese Control and Decision Conference(CCDC), 5682-5687.
[10] Sampath Jayalath, N. A. (2013). A Gyroscope Based Accurate Pedometer Algorithm. International Conference on Indoor Positioning and Indoor Navigation
[11] Lee, Y. J. (2015). New Interface Design Using Accelerator Sensor for Smart Phone. International Journal of Smart Home, Vol. 9, No. 1. [12] Chandgadkar, A. (2013). An Indoor Navigation System For