Studies and
Research Projects
REPORT R-787
Martin Lebeau Patrice Duguay
The Costs of Occupational Injuries
for the quality of its work and the expertise of its personnel.
Mission
To contribute, through research, to the prevention of industrial accidents and occupational diseases and to the rehabilitation of affected workers;
To disseminate knowledge and serve as a scientific reference centre and expert;
To provide the laboratory services and expertise required to support the public occupational health and safety network.
Funded by the Commission de la santé et de la sécurité du travail, the IRSST has a board of directors made up of an equal number of employer and worker representatives.
To find out more
Visit our Web site for complete up-to-date information about the IRSST. All our publications
can be downloaded at no charge.
www.irsst.qc.ca
To obtain the latest information on the research carried out or funded by the IRSST, subscribe to Prévention au travail, the free magazine published jointly by the IRSST and the CSST.
Subscription: www.csst.qc.ca/AbonnementPAT
Legal Deposit
Bibliothèque et Archives nationales du Québec 2013
ISBN: 978-2-89631-682-3 (PDF) ISSN: 0820-8395
IRSST – Communications and Knowledge Transfer Division 505 De Maisonneuve Blvd. West Montréal, Québec H3A 3C2 Phone: 514 288-1551 Fax: 514 288-7636 [email protected] www.irsst.qc.ca
© Institut de recherche Robert-Sauvé en santé et en sécurité du travail, July 2013
OUR
RESEARCH
A PDF version of this publication is available on the IRSST Web site.
Studies and
Research Projects
The Costs of Occupational Injuries
A Review of the Literature
This study was funded by the IRSST. The conclusions and recommendations are solely those of the authors. This publication is a translation of the French original; only the original version (R-676) is authoritative.
REPORT R-787
Disclaimer
The IRSST makes no guarantee as to the accuracy, reliability or completeness of the information in this document. Under no circumstances may the IRSST be held liable for any physical or psychological injury or material damage resulting from the use of this information. Document content is protected
by Canadian intellectual property legislation.
Martin Lebeau, Patrice Duguay Scientific Division, IRSST
ABSTRACT
This literature review is part of the IRSST’s effort to develop economic indicators in the occupational health and safety field on which, in combination with the indicators and other information already in use at the IRSST, decisions regarding research priorities can be based. More specifically, this report attempts to indentify, define, and classify the cost components of occupational injuries and to catalogue the various economic approaches used to estimate the related costs. It does not, however, attempt to catalogue the actual or estimated amounts of the costs of occupational injuries as found in the literature.
The costs of occupational injuries can be grouped into three categories: direct costs, indirect costs, and human costs. There is no consensus regarding what each category comprises. Generally speaking, direct costs consist of components associated with the treatment and “repair” of the injury, such as medical costs. Direct cost data are usually quite easy to obtain and do not require the use of special estimation methods. Indirect costs are considered to be costs related to the lost opportunities for the injured employee, the employer, the co-workers, and the community. They consist mainly of salary costs, administrative costs, and productivity losses. Compared with direct costs, indirect costs are usually more difficult to measure and are rarely insured. Human costs relate to the value of the change in the quality of life of the worker and the people around him1.
In the literature, human capital is by far the most widely used method for estimating indirect costs. It takes remuneration as the basis for measuring the worker’s contribution to society and has the advantage of using reliable data and of being relatively easy to apply and understand. For estimating human costs, the willingness-to-pay method is the method preferred by economists. It consists of estimating the amount that an individual or society is prepared to pay in order to reduce the exposure to risk. The estimates obtained using this method include both indirect and human cost components. Studies that favour this method obtain amounts much higher than those obtained using the human capital method, which implies that the human costs are quite high. However, the willingness-to-pay method is based on very restrictive assumptions and is difficult to apply.
Data availability and the reason why the costs of occupational injuries and data availability are being estimated are both factors that will influence the choice of the method to be used and of the cost components to be considered. Moreover, a complete estimate of the cost of occupational injuries is not necessary in every situation. What is important is to use a cost estimation method that will provide results reliable enough to serve as a basis for decision-making.
1 The systematic use of the masculine gender in this document is intended solely to facilitate reading and has no discriminatory intent.
CONTENTS
ABSTRACT ... I CONTENTS ... III TABLES ... V FIGURES ... V 1. INTRODUCTION ... 1 2. OBJECTIVES ... 3 3. BIBLIOGRAPHIC RESEARCH ... 53.1 Bibliographic research methodology... 5
3.2 Methodological aspects of the studies ... 6
3.2.1 Perspectives... 6
3.2.2 Data sources ... 7
3.2.3 The approaches ... 7
3.2.4 Time dimension ... 8
3.2.5 Discounting ... 9
4. IDENTIFYING THE COSTS OF OCCUPATIONAL INJURIES ... 11
4.1 Direct costs ... 11
4.2 Indirect costs... 13
4.3 Human costs ... 19
5. METHODS FOR ESTIMATING THE COSTS OF OCCUPATIONAL INJURIES ... 21
5.1 Human capital ... 21
5.2 Friction costs... 23
5.3 Willingness to pay ... 25
5.4 Health status index methods ... 31
6. SPECIAL CHARACTERISTICS OF COMPANY CASE STUDIES ... 37
6.1 The shared methodological approach ... 37
6.2 The first studies ... 37
6.3 Québec studies ... 39
7. CAVEATS AND LIMITATIONS OF THE SURVEYED STUDIES ... 43
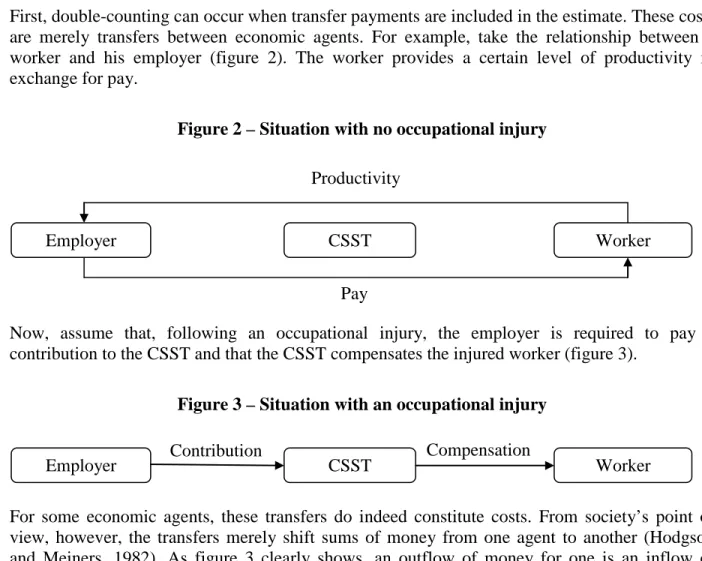
7.1 Who actually pays? ... 43
7.2 Double-counting ... 43 7.3 Human costs ... 45 7.4 Underreporting ... 46 7.5 Data accessibility ... 47 7.6 Occupational diseases ... 47 7.7 Generalization ... 48 8. CONCLUSION ... 49
9. AVENUES FOR FURTHER REFLECTION ... 51
10. BIBLIOGRAPHY ... 55
APPENDIX 1: BIBLIOGRAPHIC RETRIEVAL FORMULAS ... 65
APPENDIX 2: SUMMARY OF THE APPLIED STUDIES ... 67
APPENDIX 3: DISCOUNT RATE CALCULATION... 69
APPENDIX 4: COST COMPONENTS OF OCCUPATIONAL INJURIES ... 71
APPENDIX 5: HEALTH STATUS INDICES ... 73
APPENDIX 6: OCCUPATIONAL INJURY COST COMPONENTS IN THE QUÉBEC STUDIES ... 75
TABLES
Table 1 – Analysis of incidence and prevalence ... 8
Table 2 – Hiring and training costs ... 17
Table 3 – Numbers and costs of work accidents and occupational diseases ... 23
Table 4 – Injury- and disease-related disability weights ... 29
Table 5 – Relative disutility factors by injury severity level ... 30
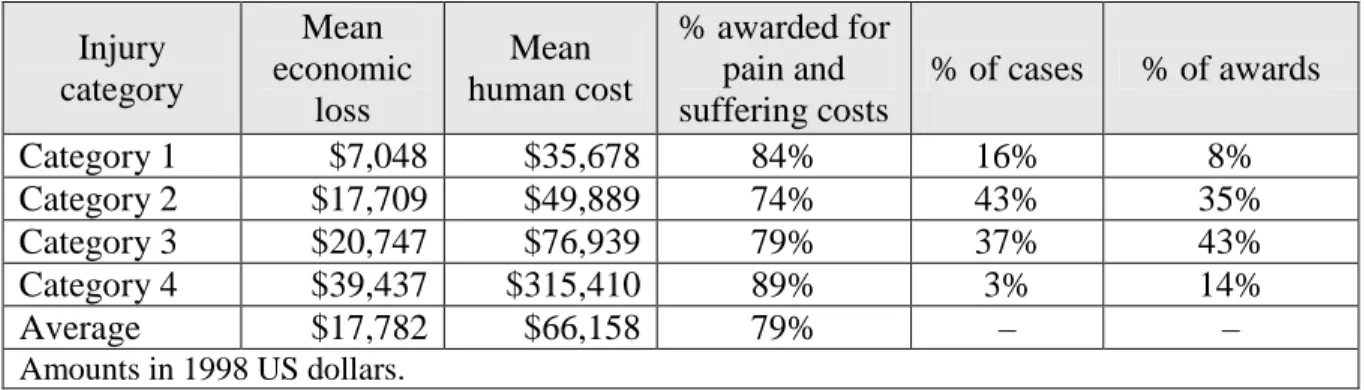
Table 6 – Amounts awarded for human costs by severity of injury ... 34
Table 7 – Multivariate regression analysis of the variables with an impact on the indirect costs of work accidents ... 40
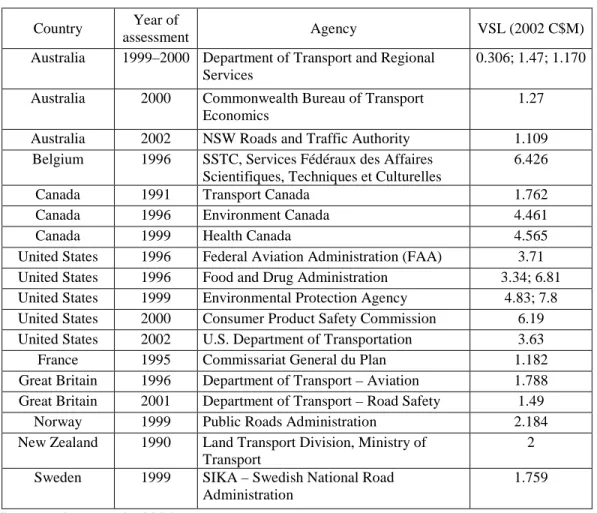
Table 8 – Life values used by the agencies of various countries ... 46
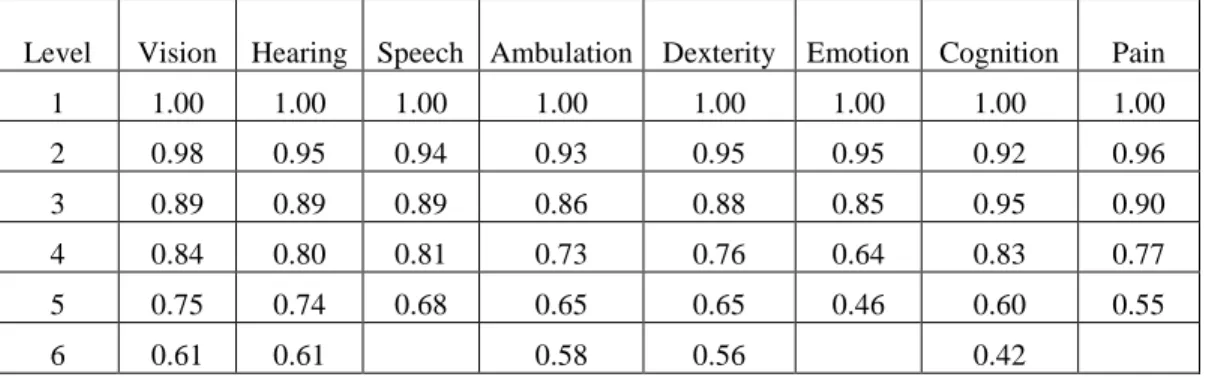
Table 9 – Health Utilities Index Mark 3 (HUI3) ... 73
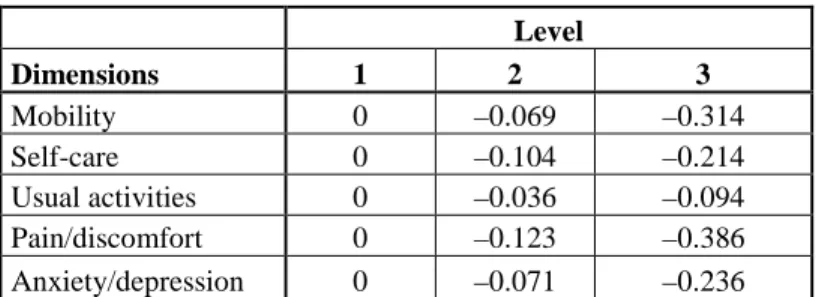
Table 10 – EuroQol EQ-5D ... 74
FIGURES
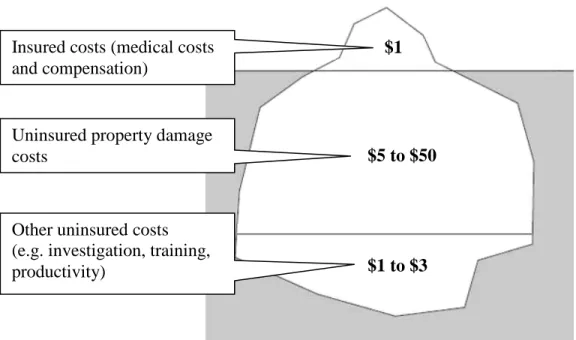
Figure 1 – Accident cost iceberg ... 38Figure 2 – Situation with no occupational injury ... 44
1. INTRODUCTION
In his work The Wealth of Nations (1776), Adam Smith states that workers’ wages vary according to the work conditions that the workers experience. This assertion indicates that there is a market for risk. In accepting a job, workers also accept its characteristics, including the associated risk. A risk premium is therefore included in the equilibrium wage. One could suppose that, in a perfect market, where workers had access to complete information about the work-related risks and enjoyed total mobility, such a premium would be sufficiently high to compensate them in the event of an accident. In such a scenario, it would be in employers’ interest to make optimal investments in occupational health and safety (OHS) in order to reduce the premium and obtain an edge over their competitors. In the real world, however, the hazards encountered at work are not systematically known and workers’ mobility is limited by several factors (linguistic, cultural, social, geographic). Government intervention, in the form of a mandatory insurance plan, is consequently justifiable.
In recent years, around 100,000 applications for compensation for occupational injuries have been accepted annually by the Commission de la santé et de la sécurité du travail (CSST), the Québec workers’ compensation board. Although these occupational injuries entail significant costs for society as a whole, they can be reduced through prevention activities. However, to optimize decision-making, it is important that reliable estimates of the costs of occupational injuries be available.
With the mission of contributing, through research, to the prevention of occupational injuries and occupational disease, the IRSST intends to develop economic indicators in the OHS field on which, among other things, decisions regarding research priorities can be based.
These indicators are to be developed using available data and one or more reliable methods that are applicable to Québec’s specific context. To assist the IRSST in choosing the most appropriate methods, this report provides a detailed overview of the state of knowledge regarding the evaluation of the costs of occupational injuries. This literature review will be used to determine which methodology to apply and which types of costs to consider when developing economic indicators useful for establishing directions in OHS research.
This report is divided into nine chapters. Following the induction, the second chapter presents the study’s specific objectives. The bibliographic research methodology and methodological aspects of the surveyed studies are presented in the third chapter. The fourth chapter defines the three main cost categories (direct, indirect, and human). The fifth chapter presents the five methods for estimating the costs of occupational injuries most widely used in the literature. The sixth chapter describes the special aspects of studies carried out in companies. The seventh chapter examines various limitations and caveats regarding estimation of the costs of occupational injuries. Lastly, chapters eight and nine bring the report to a close with a conclusion and avenues for future reflection regarding the development of economic indicators at the IRSST.
2. OBJECTIVES
This research report aims to provide an overview of the current state of knowledge regarding the evaluation of the direct and indirect costs of occupational injuries. This overview will be used in developing economic indicators relevant to OHS research directions.
This report also has two specific objectives:
1. Identify, define, and classify the cost components of occupational injuries;
3. BIBLIOGRAPHIC RESEARCH
In this section, we present in detail of the steps followed to indentify and select the various studies from the literature. Then we define several basic aspects that characterize the studies.
3.1 Bibliographic research methodology
A bibliographic key word search of various databases was carried out in March 2009 using the IRSST information library. The following databases were searched: ABI/Inform, Canadiana, INRS, EconLit, OSH Update, PAIS International, Proquest European Business, PubMed, ScienceDirect, Social Sciences Full Text, and the CSST network catalogue. Several key words and combinations of key words were used in both French (e.g. accidents du travail, coûts directs,
coûts indirects) and English (e.g. direct costs, indirect costs, illness, injury, occupational injuries,
workplace injuries). The exact bibliographic research retrieval formulas are listed in Appendix 1. This bibliographic research identified 935 documents. To make managing them easier, all the references were complied in Reference Manager, a database management program. Initially, nearly 700 documents irrelevant to the research topic were rejected after a first pass. The large number of rejected documents was due to the fact that we used broad selection criteria in order to be as exhaustive as possible. Then, after reading each of the abstracts, the number of relevant references was reduced to 42. We excluded all works that did not consider the indirect costs of occupational injuries.2 The full versions of 41 of these documents were obtained; one document
could not be found. The research was then completed using various Internet-accessible search engines and the references found in various documents. This added 36 more documents, giving a total of 77.
Each of the 77 documents was read and sorted into two categories: theoretical studies and applied studies. By theoretical studies, we mean studies that develop models or theories, that define concepts, or that present a state of knowledge. By applied studies, we mean studies that aim to evaluate the costs of occupational injuries using empirical data. Ten documents were not retained due to the insignificance of their contribution. Of the 67 remaining documents, 27 were theoretical studies and 40 applied studies. The characteristics of the 40 applied studies were summarized in an Excel file. A summary of that file, which includes the main characteristics of the 40 documents, will be found in the table in Appendix 2. The table shows that 65% of the collected applied studies originated from the United States and that 38% were carried out by the United States researchers Paul Leigh and Ted Millar, six of them jointly.
In addition, an impact factor was used to measure the importance of the journals in which the studies were published.3
However, it should be noted that this impact factor is available only for the scientific journals tracked by the Institute for Scientific Information.
2
For example, some of the rejected studies dealt only with evaluating the direct costs of occupational injuries. Our research criteria also excluded any studies that dealt with the cost of non-occupational injuries (e.g. traffic accidents, AIDS, etc.).
3 The impact factor is calculated by dividing the number of citations by the number of articles published over a specified time period.
3.2 Methodological aspects of the studies
On reading the surveyed studies, we noted that estimating the costs of occupational injuries may be approached from various angles. In this section of the report, we present the methodological choices that are available to researchers and can have an impact on cost estimation. These are basic methodological aspects that characterize the studies and allow them to be classified. In Appendix 2, the applied studies that we retained are classified according to these various methodological aspects.
3.2.1
Perspectives
The perspective corresponds to the level of analysis or point of view that is chosen in order to estimate the costs. Choosing a perspective is directly related to the objective of the study and will naturally influence the estimates.
The company perspective
The first studies on estimating the costs of occupational injuries were mainly interested in the costs for a company. This type of study focuses on all the financial consequences that the injuries will have on the company’s bottom line. Among the components considered are the stopping or slowing down of production, recruitment and training costs, property damage, insurance contributions, and the loss of contracts, to name only those.
The government perspective
The government perspective considers only the costs assumed by the government, such as those of the health care and justice systems (Choi and Pak, 2002). No study surveyed in the bibliographic search dealt exclusively with the costs borne by government.
The worker perspective
In addition to the financial consequences, the worker perspective takes into account intangible costs that result from occupational injuries, such as pain, suffering, anxiety, and loss of enjoyment of life. However, these types of cost are very difficult to estimate.
The worker perspective can also take into account the impacts of the injuries on the victim’s family.
The societal perspective
The most recent studies are interested more in the injuries’ impact on society as a whole.4
Generally speaking, the costs are estimated for the various economic agents of a society and then totalled.
4 As seen in Appendix 2, 63% of the applied studies we retained analyzed the costs from the societal perspective.
To avoid double-counting, transfer payments should not be considered in this perspective, because these payments only transfer the burden from the individual to society and do not alter society’s total resources (Choi and Pak, 2002).
3.2.2
Data sources
The data sources are usually related to the perspective. When estimating the costs in a specific company (e.g. Lanoie and Tavenas, 1995; Lavoie, 2000), the source will be the company concerned. Estimating the costs for society as a whole (e.g. Leigh et al., 2000; Whaehrer et al., 2007) usually requires several national data sources. For example, U.S. studies often use data from a variety of agencies, such as the Bureau of Labor Statistics (BLS), the National Council on Compensation Insurance (NCCI), and the Centers for Disease Control and Prevention (CDC).
3.2.3
The approaches
In the studies on estimating the costs of occupational injuries, we note two main approaches: the top-down approach and the bottom-up approach. No precise definition of these two approaches exists. Generally speaking, the top-down approach uses aggregated cost data to obtain more detailed estimates, while the top-down approach uses relatively detailed data to obtain a more generalized picture.
An example of the top-down approach that is often found in the literature consists of initially estimating the costs, from a national standpoint, of all the injuries that occurred during a specific period. The costs are then sorted by type of outcome (injury, disease, death). Lastly, a percentage of the costs is assigned to the occupational injuries. This last step is very important and often requires estimates from a large number of studies.
The top-down approach has the advantage of requiring less detailed data than the bottom-up approach. However, the large number of assumptions necessary to make the cost estimates is a source of inaccuracy.
An example of a bottom-up approach consists of initially obtaining the number of actual or estimated occupational injuries for each injury category during a predetermined period. The average cost of these injuries is then estimated. Lastly, the number of injuries is multiplied by their average cost for each of the occupational injury categories.
This latter approach is usually preferred by researchers, as it involves fewer assumptions (Leigh et al., 2000). However, it does require a large amount of data for, among other things, estimating the average costs of the various injuries and diseases.
The majority of the surveyed studies use a bottom-up approach. Some researchers use both approaches in the same analysis (see Appendix 2).
3.2.4
Time dimension
The time dimension is important in analyzing the costs of occupational injuries, as an injury can have financial consequences that extend over several years. Researchers generally approach the problem via an analysis of incidence or prevalence.
Estimating the incidence of the costs of occupational injuries involves taking the new injuries that occur during a specific year and estimating the total costs of the injuries irrespective of whether they are spread over one or more years. This type of analysis has the advantage of measuring the actual impact of prevention (Biddle, 2004). However, since all the costs associated with the injury do not occur in the same year, the future costs have to be predicted and discounted, which introduces a degree of inaccuracy into the estimates.5
A prevalence-based analysis focuses solely on the costs incurred in a specific year, irrespective of the date on which the injury occurred. This approach is much simpler to apply, as it requires fewer data and makes no assumptions regarding future costs. The approach is widely used at the government level because it facilitates year-to-year budgeting of expenditures (Freeman et al., 2001).
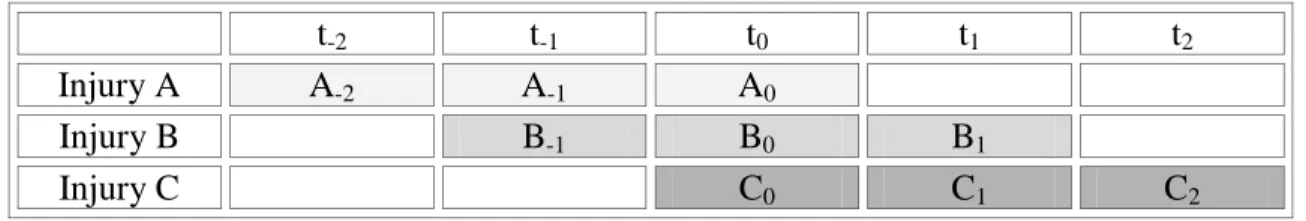
Table 1 – Analysis of incidence and prevalence
t-2 t-1 t0 t1 t2
Injury A A-2 A-1 A0
Injury B B-1 B0 B1
Injury C C0 C1 C2
Table 1 illustrates the difference between the two approaches. It lists three injuries (A, B, and C). The injuries occurred in years t-2, t-1, and t0 respectively and each generated costs for three
consecutive years. The objective is to measure the costs in year t0. With an incidence-based
analysis, the costs are calculated by totalling C0 and the discounted values of C1 and C2. Thus,
only injury C is considered, as it is the only injury that occurred in year t0.
Incidence: 2 2 1 1 0 ) 1 ( ) 1 ( r C r C C Costs + + + + = (1)
where r is the discount rate. With a prevalence-based analysis, the costs are calculated by totalling the A0, B0 and C0 figures. In other words, it is all the costs paid in year t0.
Prevalence: Costs=A0 +B0 +C0 (2)
Generally speaking, for injuries that generate costs over only a short period, both approaches produce similar results. For injuries that generate costs over a long term, the incidence-based approach produces lower results due to discounting. Moreover, if it is assumed that medical
5 Discounting consists of expressing future cash flows in current dollars (see section 3.2.5).
practice and technology do not evolve, the two methods will produce similar results, all other things being equal. However, if changes in medical practices and technology are foreseen, the incidence-based cost estimates will reflect these changes (Moore et al., 1997).
According to Hartunian et al. (1980), neither incidence nor prevalence is superior in every situation. The choice between them usually depends on data availability. In the literature, several researchers recommend a combination of the two cost measurement approaches.
3.2.5
Discounting
In the surveyed studies, the time dimension inherent in the consequences of occupational injuries sometimes involves the use of discounting. Discounting is a mathematical operation that makes it possible to compare economic values over time. It consists of expressing the future value of a property or expenditure as a current value (Montmarquette and Scott, 2007). Discounting is based on the concept of the value of time, which is reflected in our preference for instant gratification. We prefer to have a dollar today instead of a dollar tomorrow. The same attitude, albeit inverted, applies to costs. We prefer to pay later instead of now
Generally speaking, the discounting of a cash flow F can be expressed as:
n r F F ) 1 ( * + = (3) where
- F* is the discounted value of the cash flow; - F it the cash flow;
- r is the discount rate;
- n is time, usually expressed as years, from the discounting date to the cash flow date. Choosing the appropriate discount rate is both very important and very tricky. For example, imagine a company that wants to invest in prevention. The investment concerned requires immediate expenditures while the benefits, in terms of avoided costs, will be obtained only in the medium to long term. If the discount rate used is too high, the discounted value of the benefits will be too small and the company may decide not to invest in the project. In this example, it would be as though the company attached too high a value to the present to the detriment of the future.
In the literature, the consensus is to use a discount rate that reflects the time preference of the group concerned. This means there is no single discount rate that applies in every situation. For companies, the appropriate discount rate is the weighted average cost of capital (WACC). At the societal level, the social opportunity cost of capital (SOCC) is used. These two measures are discussed in detail in Appendix 3.
Based on the work of Jenkins and Kuo (2007), the Treasury Board of Canada Secretariat (2007) recommends using a public discount rate of 8%. However, when the benefits are in the distant
future, as is the case for environment and health care benefits, a lower rate is suggested.6 One of
the recommended approaches consists of estimating the time preference rate based on the rate at which society discounts future consumption and on the forecast consumption growth rate. For Canada, the time preference rate has been estimated as being around 3% (Treasury Board of Canada Secretariat, 2007).
In the 40 applied studies listed in Appendix 2, the discount rates vary from 2.5% to 6%, with an average of 3.6% and a mean of 3.4%.
Hodgson and Meiners (1982) recommend that researchers always test two or three discount rates, ranging from 2.5% to 10%, in order to determine the rate’s impact on the size of the costs of the various injuries.
6
In addition, for this type of investment, there are no or minimal resources involving opportunity costs (Treasury Board of Canada Secretariat, 2007).
4. IDENTIFYING THE COSTS OF OCCUPATIONAL INJURIES
This section presents the various cost components likely to result from occupational injuries. It is not a detailed presentation of all possible and imaginable costs but rather a presentation of the main cost categories found in the literature. A table summarizing the various cost categories will be found in Appendix 4. Each category is also broken down by the main economic agents.7
Most studies separate the costs into two categories: direct costs and indirect costs. Sometimes the terms insured and uninsured costs, tangible and intangible costs, or visible and invisible costs are used. These terms are usually interchangeable, even if they do not always comprise the same cost components. In this study, we use the terms direct and indirect costs, as we consider these by far to be the terms most widely used in the literature.
On reading the documents obtained through the bibliographic research, we note that there appears to be no consensus regarding the components that belong to the two cost categories. A component may be considered a direct cost in one study and an indirect cost in another. This situation becomes problematic when one wants to compare studies.8 That is why it is not
necessarily useful to distinguish between direct and indirect costs (Access Economics, 2006). In fact, several studies do not make the distinction.
Recent studies increasingly include a third cost category, human costs (also called pain and suffering costs). Some authors classify these as indirect costs; others include some components in direct costs (e.g. compensation for bodily harm and permanent disability). We opted to create a third cost category because of the intangible aspect related to these costs and the difficulty in estimating them. Moreover, recent studies increasingly use this way of classifying human costs.
4.1 Direct costs
Some authors define direct costs as those directly related to the injury, others as those directly related to the accident. Although similar, the two definitions do not refer to the same costs. The first definition is limited to the components associated with treatment and “repair” of the injury, while the second definition also includes other cost components directly related to the accident, such as property damage. Generally speaking, direct costs are insured and easily measureable.
Medical costs
Nearly all the studies include medical, hospitalization, and rehabilitation costs among the direct costs. These costs correspond to all the incurred and projected expenses for providing medical care to an injured or sick worker. In addition to the amounts spent on medical personnel, medical equipment, and medications, transportation and administrative (hospital) expenses are often included under this heading.
7
The costs for the worker also include the costs for those near to him (family and friends).
8 Especially if one is interested in the indirect/direct cost ratios that are sometimes estimated in these studies.
This information can be obtained from a government agency that provides work accident insurance or gathers information on the subject, such as the National Council on Compensation Insurance (NCCI) in the United States. In Québec, it is the Commission de la santé et de la sécurité du travail (CSST) that acts as the public insurer. The mandatory plan put in place by the CSST is funded entirely by employers’ annual contributions. Thus, it is they who assume these costs for compensated injuries.
The accident victim may be responsible for some medical expenses that are usually covered by the occupational health and safety plan if they have not been prescribed by a physician and the injury has not been declared an occupational injury. These medical expenses may consist of medication, medical equipment, or even health care (chiropractic, osteopathy, psychology, etc.). Private insurers may be responsible for some expenses. This may happen when the worker is fearful of the consequences of declaring an occupational injury. For example, a worker who suffers a back injury at his workplace, may decide to go to a chiropractor and claim that the accident occurred at home. These fees are nonetheless assumed indirectly by the employer and the worker through their health insurance premiums.
At the societal level, there is a cost for the public health care system, specifically regarding the availability of limited resources.9
Property damage
Property damage is defined as being all the damage caused to the company’s machines, tools, and other property (Access Economics, 2006). This includes equipment replacement and repair costs, the value of damage caused to goods, and any clean-up costs.
These costs are very difficult to estimate without conducting a survey in the company via a questionnaire. In the studies that use national data, an average obtained from the literature is typically used. Among the 40 selected studies, 19 included property damage costs. However, there is no consensus on how to classify these costs. Around half of the studies consider the costs to be direct costs while the other half considers them indirect costs.
Major damage is usually covered by the insurance policies that the companies take out. The cost of such damage is thus indirectly assumed by the companies through their insurance premiums.
Emergency services
Some studies (around 25%) include police and/or firefighter services among the direct costs. These costs are assumed by the community. Most of the time, estimates obtained from other studies are used to calculate these costs.
Ambulance transportation, which may be considered part of the medical costs, is usually the responsibility of the employer when an accident occurs at the workplace.
9 In addition, the medical costs resulting from an injury to a worker not covered by an occupational health and safety plan are assumed by the community.
Funeral costs
Some work accidents and occupational diseases may result in death. These deaths entail funeral costs, which would normally have been paid for at a later date. The actual cost is the cost of having to organize the funeral earlier than expected. These funeral costs can be estimated using the following equation (Access Economics, 2006):
n r FC FC FC ) 1 ( * 1 1− + = (4) where
- FC* are the premature funeral costs;
- FC1 are the funeral costs at date 1 (date of death);
- r is the real interest rate (nominal interest rate corrected for inflation); - n is the number of years of life lost, based on the worker’s life expectancy.
These costs are assumed by the family of the deceased. However, the person who pays them may receive partial reimbursement for them in the form of a death benefit.10
4.2 Indirect costs
Indirect costs are costs that are not directly related to the treatment and repair of the injury but rather to the lost opportunities of the injured employee, his family, the employer, the co-workers, and the community (Leigh et al., 2000). In contrast to direct costs, indirect costs do not usually involve out-of-pocket expenses and are not usually insured. This means they are much more difficult to measure.
Productivity
Productivity losses are a very large cost component of occupational injuries. They stem from the stopping or slowing down of production due to property damage or accidents that affect employees’ physical integrity (Gosselin, 2004). Such productivity losses may take various forms:
- Productivity of the worker injured on the day of the accident;
- Productivity of the other employees who came to the assistance of the injured worker; - Reduced productivity due to property damage;
- Productivity of the worker absent from the labour market;
- Productivity of the injured worker on returning to work (at his usual job); - Productivity of the injured worker on temporary assignment;
- Productivity of the replacement worker.
It should be noted that the impact on the company’s overall productivity will be influenced by the company’s production structure. For example, the productivity losses resulting from a work
10 In 2010, the CSST reimburses, to the person who paid for them, funeral costs of up to $4,617 plus the cost of transporting the deceased’s body (CSST, 2010a).
accident would be greater in a company whose operations are based on an assembly line, where a problem in one part of the line creates delays in all subsequent parts of the line than in a company whose operations are based on production units.
It is not easy to accurately estimate productivity losses without conducting a survey in the company. In that type of study, the productivity losses can be measured directly by determining the value of the decrease in production during the period concerned.11
In most cases, however, it is not possible to actually measure the productivity losses. To overcome this problem, most authors use the human capital method. The method uses workers’ pay to estimate the productivity losses. The human cost method is discussed in detail in section 5.1.
Salary costs
As we have just seen, the worker’s wages can be used to estimate the productivity that is lost after an occupational injury. Some authors also consider other salary costs. However, care must be taken not to double-count when these two cost components are included in a given analysis. For the employer, in addition to the income indemnity paid by a compensation plan, salary costs can take two forms. First, pay increases related to the increase in risk. If a company or industry faces an increase in its risk of occupational injuries, the pay demanded by the workers, which incorporates a risk premium, may also increase. For the employer, this would correspond to a higher payroll expense in order to reach the same productivity level.12 Second, in an effort to return productivity to the level it was at before the accident, the co-workers may do overtime. The overtime would be another salary cost for the employer.
For the injured worker, salary costs may arise during and after the injury. First, during the injury, the difference between the income replacement indemnity received by the injured worker and his net income is an earnings shortfall that is borne by the worker (Access Economics, 2006).13
Second, an occupational injury may lead to a change in the worker’s career path. If the change results in a lower pay cheque and the difference in pay is not fully covered by the compensation received, the worker has to absorb the difference.
Salary costs can also have an impact on the community. First, they can decrease the government’s tax revenues. The pay decrease that an injured employee may incur can result in lower income tax receipts and to lower consumer tax receipts due to a decrease in purchases (Gosselin, 2004).14 Second, government financial assistance to workers who are unable to support
11
See Lavoie (2000) for an example of a productivity loss calculation in a mining company. 12 This wage increase can also have an impact on the contributions paid by the employer.
13 In 2010, the CSST’s income replacement indemnities are 90% of the net earnings or of the maximum insurable salary of $62,500.
14 It should be noted that the drop in corporate profits can also have an impact on the government’s tax revenues.
themselves financially may be necessary. This financial assistance can take the form of an assistance allowance or employment insurance benefits.15
Generally speaking, the above-mentioned salary costs are rarely considered in the applied studies, except for studies in companies, where this type of information is more readily available.
Employee benefits
Hensler et al. (1991) maintain that an individual’s pay does not fully reflect the remuneration he receives from work. Some workers receive employee benefits, which are paid by the employer and may be considered part of the workers’ income. The employer that pays for these employee benefits expects to recover the expenditures through its employees’ productivity.
Several authors consider employee benefits as a measure of the productivity losses that result from occupational injuries. They use the value of the employee benefits that are normally paid to the worker (before the accident). To calculate the value of these employee benefits, a percentage of the worker’s pay is typically used. For example, Miller and Galbraith (1995) use 20% and Leigh et al. (2000) use 23.3%. It should be noted that several authors do not consider the employee benefits already included in the workers’ pay, such as vacations, holidays, and bonuses. Thus, employee benefits basically consist of employers’ contributions to pension plans and group insurance.
Some studies are more interested in the employee benefits paid by the employer when the worker is on leave. These are not identical to the employee benefits paid before the accident. Take, for example, a Québec civil service employee. In cases of occupational injury, the employer is required to continue contributing to the worker’s pension plan (RREGOP) during his disability for up to three years. On the other hand, the employer does not have to contribute to the Québec Pension Plan (QPP) during the entire period during which the employee receives an income replacement indemnity from the CSST.
A worker who suffers an occupational injury is usually exempted from having to contribute to his pension plans (e.g. QPP, RREGOP). In the literature, it is often noted that the worker may lose some employee benefits, such as training and career development.
Some costs are assumed by the community when the worker is exempted from having to contribute or when the employer stops contributing to a pension plan (e.g. after three years of disability).
Household work
Occupational injuries can have an impact on workers’ ability to perform household work. Hawrylyshyn (1978) defines household work as “those economic services produced in the household and outside the market, but which could be produced by a third person hired on the market without changing their utility to members of the household.” Examples include lawn
15 The recipients of this financial assistance are mainly workers who are not covered by an occupational health and safety plan.
maintenance, house cleaning, and meal preparation. In some cases, these expenses are covered by the occupational health and safety plan.
To estimate the value of the time devoted to household work, Chandler (1994) suggests two approaches: the opportunity cost approach and the replacement cost approach. In the opportunity cost approach, the value corresponds to what is given up in order to perform the household work. The approach assumes that only paid work is given up. Accordingly, the value of one hour of household work is based on the pre-tax hourly earnings of the individual concerned. Although the approach has the advantage of being easy to apply, according to Douglass et al. (1990) it tends to produce excessively high estimates, since most of the tasks that make up household work can be done by lower paid workers. Moreover, individuals’ productivity when performing household work is probably lower than for their paid work (Graham and Green, 1984).
The replacement costs approach estimates what it would cost on the market to have the household work performed. To do this, the hourly pay of workers who perform similar tasks (plumber, cleaning lady, cook, etc.) is obtained. This approach is difficult to apply because it requires assigning a value to each of the various household work tasks.
To estimate the average time devoted to household work, researchers typically use the results of national surveys.16
For short-term disabilities, an average hourly wage is usually multiplied by the duration of the disability. For occupational injuries that result in long-term disabilities, the value of the household work is estimated using a discounting formula.
Nearly half the applied studies surveyed in our review of the literature take account of household work that cannot be performed after the injury. While the two approaches defined above are the ones most commonly used to evaluate the costs, there does not appear to be a consensus regarding which is the better.
Administrative costs
The administrative costs arising from a work accident are several and are borne mainly by companies. It is difficult to accurately measure the size of these costs because they are not usually accounted for in the financial statements.
In this cost category are found the:
- Investigation costs resulting from an accident; - Administrative costs of the compensation board; - Administrative costs of the private insurers; - Cost of recruiting a new employee;
- Cost of training a new employee.
The costs related to the investigation of an accident are difficult to evaluate unless as a survey is conducted in the company. In that case, the salary of the supervisor and other persons responsible
16
For example, in the U.S., there are the Panel Study of Income Dynamics (PSID), National Human Activity Pattern Survey (NHAPS), and Current Population Survey (CPS). In Canada, there is the General Social Survey (GSS).
are simply multiplied by the time devoted to the investigation. Otherwise, the estimate has to be based on data from other studies.
Managing an occupational health and safety plan like the CSST necessarily comes with administrative costs (salaries and benefits, hardware and supplies, office leases, etc.). In the literature, a percentage of the premium paid by the employer is usually used. Miller and Galbraith (1995) maintain that, in the United States, these administrative costs amount to 13% of the premium.17 They are assumed entirely by companies through their insurance premiums.
Companies can also take out several types of insurance policies from private insurers (property and casualty, third-party liability, etc.). Some work accidents can result in claims being submitted to these insurers. These claims come with administrative costs, which are included in the insurance premium and therefore assumed by employers.
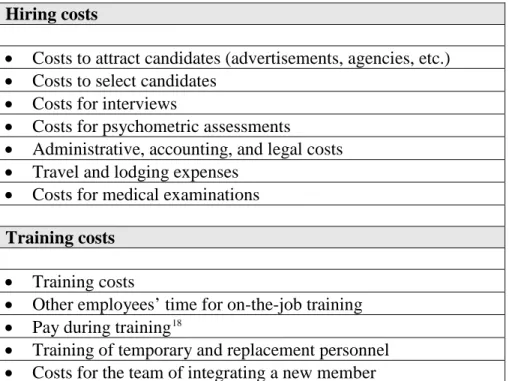
When an employer has to replace an employee, it necessarily incurs recruitment and training costs. These costs are hard to quantify, as they vary depending on the industry, administrative region (or city), status of the position to be filled, and point in the business cycle. Basing themselves on the work of Tangri (2003), Brun, and Lamarche (2006) provide a detailed description of what makes up the hiring and training costs (see table 2).
Table 2 – Hiring and training costs Hiring costs
• Costs to attract candidates (advertisements, agencies, etc.)
• Costs to select candidates
• Costs for interviews
• Costs for psychometric assessments
• Administrative, accounting, and legal costs
• Travel and lodging expenses
• Costs for medical examinations Training costs
• Training costs
• Other employees’ time for on-the-job training
• Pay during training18
• Training of temporary and replacement personnel
• Costs for the team of integrating a new member
Source: Brun and Lamarche (2006)
17
In the CSST’s 2008 annual report, administration costs are shown as totalling around $331 million, which corresponds to 14.5% of the total employer contributions.
18
This component may also be included in the productivity losses.
Once again, for company case studies, these costs can be evaluated by multiplying the time devoted to hiring and training by the wages of the persons responsible. For national studies, the costs have to be estimated using methods obtained from other studies. For example, Leigh et al. (2000) base themselves a study by Barron, Black and Lowenstein (1989) which estimates that an average 161 hours are required to hire and train a new employee during the first three months after his hiring. Assuming a wage of $15.24 (1992 US$), the authors assign a cost of $2,454 (1992 US$) to all deaths and injuries with permanent disability.19
However, as companies have a pre-accident employee turnover rate, any replacement of personnel due to occupational injuries would still have been required at some later point in time (e.g. retirements, dismissals, and resignations). Accordingly, several authors opt for estimating the cost for companies of recruiting now instead of later.
Legal costs
Occupational injuries give rise to legal costs in several ways. First, decisions made by the CSST may be contested by workers or employers. Second, the CSST may take legal action against employers over the application of laws and regulations. Lastly, an employer may be sued on third-party liability grounds or under the Criminal Code.20
In all these cases, legal costs are incurred by the various parties involved. In addition, the use of public services (courts, legal staff, etc.) entails a cost for the community.
Legal costs constitute a special case among cost components insofar as few accidents result in an investigation, a complaint, or legal action. In such cases, however, the costs may be quite high. In the literature, an average figure for legal costs is usually applied to all injuries.
Brody et al. (1990a), using a survey of several companies, obtain average legal costs $68.17 (1990 C$) per injury and average costs of $956.69 per injury that resulted in legal costs.21
In 2007 and 2008, the CSST paid around $53 million to fund administrative tribunals (CSST, 2009). The funding of the Commission des lésions professionnelles (CLP), which is mandated to hear and decide on challenges to decisions made by the CSST, is responsible for nearly all these costs. All these costs are assumed by employers through their contributions.
Reputation
Work accidents with occupational injuries can have a negative impact on the reputation of both parties involved. For the employer, an work accident, especially one covered by the media, can
19 Based on other assumptions, they determine an average recruitment and training cost of $149 (1992 US$) for temporary disabilities and $12 (1992 US$) for the other injuries with loss of time.
20 Civil proceedings against an employer following an occupational injury are generally not allowed under the Act respecting industrial accidents and occupational disease.
21
In the Brody et al. (1990a) study, the legal costs were obtained by adding together the costs for judicial proceedings and medical challenges.
affect its ability to recruit new employees and obtain new contracts. A worker who has suffered one or more severe occupational injuries may have trouble finding a new job.
As these costs are very difficult to estimate, they are usually not considered in the applied studies.
4.3 Human costs
Human costs (also called pain and suffering costs), which are sometimes called intangible costs, are increasingly considered in estimates of the costs of occupational injuries.22 Of course, these
costs are difficult to measure and easy to challenge. However, several authors agree that they are probably quite large and should not be ignored in studies.23
Essentially, human costs are based on the value of the change in the quality of life of the injured worker and those in his circle (family, friends, co-workers, and other members of the community). A definition of these costs, found in a study by professor David Weil, neatly summarizes the problem:
Quality of life is a difficult concept to define, but here refers to diminishment of health, psychological well-being, and family and social interactions arising from the injury. In some senses quality of life losses overlap with changes in household and other non-work time allocation described above. But they also go beyond this realm to include the burden imposed on the disabled by feelings of depression, anger, and pain arising from limitations in all realms of activity. (Weil, 2001)
In the surveyed studies, we noted three methods used to estimate human costs: willingness to pay, health status indices, and jury awards. These methods are discussed in detail in the next section.
22 In Appendix 2, we note that 33% of the applied studies collected estimate the human costs related to occupational injuries. As of the year 2000, 47% of the studies estimate these costs.
23 Hodgson and Meiners (1982) hold that human costs should be considered, even if they are not expressed in monetary terms.
5. METHODS FOR ESTIMATING THE COSTS OF OCCUPATIONAL
INJURIES
In this section, we present the main methods available for estimating the costs of occupational injuries. Some of these methods are useful for estimating quite specific cost components, while others can be used to obtain a more general estimate of the costs.
For each of the applied studies listed in Appendix 2, we have specified the method or methods used by the authors. However, it should be noted that these methods are not always used in their full theoretical expression.
5.1 Human capital
The human capital (HC) method is sometimes referred to as the direct/indirect method. This is because it is the method most frequently used in studies dealing with the direct and indirect costs of injuries.24 In reality, it is a method for estimating short- and long-term productivity losses.
As we saw earlier, occupational injuries are often followed by a productivity loss. The loss corresponds to the value of what would have been produced had there been no accident. However, without conducting a survey in the company, it is usually impossible to measure the actual loss. To circumvent this problem, the human capital method is used to estimate the productivity loss based on the workers’ earnings.
Theoretical underpinnings of the human capital method
The human capital method views an individual’s contribution to society as being his contribution to the gross domestic product (GDP).25
In other words, the decrease in productivity corresponds to the decrease in GDP. From this standpoint, it is society’s capacity for producing goods and services that is of primary interest.
Neoclassical economic theory holds that companies will hire as long as their profits rise, i.e. as long as the cost of the last worker hired is less than the amount of revenue he generates. The cost for the company corresponds to the worker’s pay and that pay corresponds to the worker’s marginal productivity. Thus, the worker’s contribution to the GDP can be estimated by his gross income (before income tax), which corresponds to the marginal productivity of labour.26 To this
should be added all other forms of remuneration, such as bonuses, allowances, commissions, overtime hours and so on.
For short-term absences, the number of hours of absence can simply be multiplied by the hourly wage. For long absences, in which the productivity loss extends over several years, the human
24 As seen in Appendix 2, 56% of the surveyed applied studies use the human capital method.
25 Statistics Canada defines GDP as an aggregate measure of economic activity that corresponds to the unduplicated value of the goods and services produced in the economic territory of a country or region during a given period. 26
If the accident victim’s pay figure is not available, it can be estimated using the average pay of the organization or industry.
capital method uses an estimate of the present value of the future earnings. For example, for a death, the future earnings are discounted from the year of death until the expected year of retirement (e.g. 65 years). Inspired by Rice et al. (1989), the overall model is:
∑
= − − + + × × = 65 ,, , , ) 1 ( ) 1 ( y n y n y n n j s n s y r g Y P PV (5) where- PV is the present value of future earnings;
- Py,s,n is the probability that a person of sex s and age y will survive until age n;
- Ys,j,n is the annual pay of a worker of sex s, job j and age n;
- g is the rate of increase of labour productivity; - r is the real discount rate.
To this basic model can be added other components, such as employee benefits and household work, in order to arrive at a more complete definition of productivity.27 In addition, some authors
introduce an employment rate variable into equation (5) to account for the probability of the worker of sex s and age y being employed during the years concerned.
Thus the human capital method views workers as production factors. When an occupational injury occurs, the method claims that the quantity of human capital available in the economy is reduced and that this has an impact on society’s capacity for producing goods and services over the short- and long-term (Goodchild et al., 2002).
Leigh et al. (2000) use the human capital method to estimate the productivity losses. Their study is considered one of the most important and complete to date, mainly due the scale of the estimates made by the authors. The authors first estimated the number of injuries, deaths, and occupational injuries for the entire United States in 1992. Then, the costs were grouped according to a direct and indirect cost classification. The direct costs were defined as being the medical costs (hospital, medical personnel, medications, etc.) and the administrative costs related to the care provided and compensation paid. The indirect costs were measured by the potential productivity losses (lost pay), the lost employee benefits, the non-participation in household work, and the disruptions in the company in terms of recruitment and training. In making the costs estimates, the authors drew on an impressive number of sources. As determined by data availability, they adopted an incidence- or prevalence-based approach. The cost of the productivity losses, calculated using the human capital method, totalled approximately $74 billion (1992 US$), i.e. about 48% of all the costs estimated by the authors. Table 3 presents the authors’ results in detail.
27 Some authors simply add the value of the household work and the employee benefits to the annual earnings equation (5).
Table 3 – Numbers and costs of work accidents and occupational diseases Costs (1992 US$B)
Category Number Total Direct Indirect Accidents 13,343,000 132.8 38.4 94.3 Deaths 6,371 3.9 0.2 3.7 Non-fatal 13,337,000 128.9 38.2 90.6 Diseases 22.8 13.4 9.4 Deaths 60,290 15.1 8.8 6.3 Morbidity 1,184,000 7.7 4.6 3.1 Total 155.5 51.8 103.7
Source: (Leigh et al., 2000)
Advantages and limitations of the human capital method
The human capital method normally uses reliable data and is easy to apply and understand. That is mainly why it is the method most widely used in medical and legal research (Leigh and Miller, 1998).
However, the human capital method is criticized for several reasons. First, by viewing the worker as a simple production factor, the method, when used in isolation, does not account for workers’ pain, suffering, or loss of enjoyment of life. To put it another way, the worker’s viewpoint is not considered by this method. Moreover, the method assigns a low value to individuals who do not work, who perform unpaid work, or who are about to retire. Lastly, due to imperfections in the labour market, it is possible that workers’ pay does not truly reflect their actual productivity. These imperfections may arise from, among other things, discrimination in the labour market (age, ethnicity, race, sex, etc.) (Hodgson and Meiners, 1982).
5.2 Friction costs
The friction cost method is in some ways a critique of how the human capital method measures the long-term impact of absenteeism on productivity. Advocates of the friction cost method claim that the human capital method overestimates productivity losses because it evaluates the “potential” productivity loss instead of the “actual” loss (Koopmanschap et al., 1995).
As we saw earlier, the human capital method views the worker as a production factor. In cases of death, for example, the method considers there to be a productivity loss for each of the years of work lost up to the expected retirement age. Over the long term, the economy’s productive capacity is therefore said to be reduced, an assumption that can be made only in full employment situations.28 However, while such a situation may exist in some areas of the economy, it probably
does not do so for the entire economy.
28 A full employment situation occurs when unemployment is reduced to frictional unemployment, i.e. unemployment of short duration between the end of one job and the beginning of another.
Theoretical underpinnings of the friction cost method
The friction cost method holds that there are several mechanisms within companies and the labour market that allow one to believe that the “actual” productivity loss is much less than that obtained using the human capital method. More specifically, in the short term, it is claimed that the work usually performed by the accident victim may be done by another worker in the company, that some less urgent jobs can be dropped, and that the injured worker can partly make up for his absence upon returning to his job. For extended absences, it is claimed that the work may be performed by an individual who is not on the labour market (e.g. unemployed) or by a worker from another company (Koopmanschap et al., 1995).29 The full employment assumption
advanced by the human capital method is therefore rejected.
The friction cost method limits productivity losses to the friction period, which is the time necessary to return productivity to the level it was at prior to the accident. However, this friction period is difficult to estimate.30
Although the friction cost method was developed to estimate productivity losses at the societal level, it is used indirectly in company studies. As these studies focus exclusively on the consequences for the employer, the productivity loss is limited to the friction period.31 However,
in other types of study, the method is used very little.
The few studies surveyed that estimated indirect costs using the friction cost method obtain estimates much lower than those obtained using the human capital method. For example, using the friction cost method, Van Beeck et al. (1997) obtain estimates that are equivalent to 20% of those obtained using the human capital method.
Advantages and limitations of the friction cost method
The friction cost method views the labour market as not being in a full employment situation, which is not a far-fetched assumption. An unemployed person may well enter the labour market to replace an injured worker.
The method also produces estimates that are more tangible for employers. It is unlikely that a company’s productivity will drop off indefinitely after an employee goes on leave. The employee will be replaced by another worker, from inside or outside the company, to bring productivity back to the level it was at prior to the accident.
The friction cost method is open to several criticisms. First, Johanneson and Karlsson (1997) maintain that limiting the productivity loss to the friction period corresponds to assigning a null
29 In each of these cases however, the hiring and training costs should be considered.
30 Koopmanschap et al. (1995) use a method for estimating the friction period that discriminates according to the education level of the worker to be replaced.
31 It should also be noted that, even under a full employment scenario, there may be a friction period at the level of each company individually.
value to the opportunity cost of the work after this period.32 According to the authors, it is an
assumption that cannot be supported by neoclassical economic theory.33 Johanneson and Karlsson
(1997) also note there is no assurance that an injured worker will be replaced by an unemployed person. The replacement worker may come from another employer, thereby creating another friction period at his former company. Neither is it certain that this domino effect, going from one employer to another, will end with an unemployed person entering the labour market.
Another criticism concerns the difficulty in precisely estimating the length of the friction period. First, the period may vary depending on the company’s job structure. Some companies may not replace injured workers but have the work done by co-workers or, in some cases, simply not done (Brun and Lamarche, 2006). Second, the time necessary to recruit a new employee may vary depending on the economic cycle. In recessions, with high unemployment rates, the recruitment time will likely be shorter than during periods of sustained economic growth. Lastly, the type of industry may have an impact on the length of the friction period. Industries experiencing labour shortages may have to devote more time to recruiting new employees.
5.3 Willingness to pay
The willingness-to-pay method (WTP) consists of estimating the amount that an individual or society is willing to pay or receive in exchange for a marginal change in risk (injury, disease, or death). Willingness to pay is a method used mainly for estimating the value of a statistical life (VSL).34
Take, for example, a society composed of a million persons. If each of these persons is willing to pay $100 to reduce the probability of death from 3/100,000 to 1/100,000, which corresponds to 20 lives for that society, the willingness to pay to save the 20 lives would be $100 million, equivalent to $5 million for each life saved.
The model is as follows:
p dp dw
VSL=( / )/∆ (6)
where
- dw/dpis the amount paid or received in exchange for the change in risk; - ∆p is the change in risk.
Continuing with the previous example, Δp here corresponds to 2/100,000 and dw/dp corresponds to $100. The value of a life can thus be estimated by 100/(2/100,000) or $5 million.
32 In other words, the authors claim that the friction cost method assigns a value very near zero to unemployed persons’ free time.
33 In response to the criticism, Brouwer and Koopmanschap (2005) reply that the friction cost method does not assign a null value to unemployed persons’ free time but focuses only on the productivity loss, just as the human capital method does. According to them, the value of free time and recreation should be calculated separately using a QALY measurement.
34
It should be noted that these estimates do not concern the value of a specific life but rather of an anonymous individual in society.
Several researchers, including Strand (2001), hold that the estimates obtained using WTP do not correspond only to the value of the harm for the individual concerned. Indeed, it appears that a significant part of the willingness to pay stems from individuals’ concerns for the members of their families and for other persons in society. Moreover, the amounts obtained using this method do not correspond to the value of the human costs alone but rather to all the consequences of the occupational injuries for the worker.35
The majority of the studies that attempt to estimate the willingness to pay use the revealed preference approach. This approach holds that individuals reveal their preferences through their behaviour in the market (Dionne and Lanoie, 2004). Their preferences relating to risk are reflected in decisions involving a trade-off between a certain amount and a risk.36
The majority of works that use this approach are of the wage-risk type, which means they measure the value of a change in risk in a work environment. The workers offer their services on the labour market in exchange for wages and the employers offer wages for their performing work. The equilibrium wage that results from the interaction between the two parties is the amount that is required to get the work done. By accepting the job, the worker also accepts its characteristics, including the associated risk. This method attempts to use this balance point to evaluate the risk premium paid to workers.
In practice, to perform this type of analysis, the researchers start by constructing a database using a sample of workers from various industries. The average pay for these jobs is then obtained and the risk levels associated with the work and other variables that may influence pay. Then an average pay regression is run on the various independent variables. The risk variable coefficient, which is obtained using the regression, corresponds to the risk premium.37 This is the coefficient
that makes it possible to calculate the VSL.
Theoretical underpinnings of the willingness-to-pay method
The general model for estimating the WTP takes the following form (Lebeau, 2006):
φ
β
i i iX
p
w
=
+
(7) where- wi is the wage of individual i;
- Xi is in independent variable vector; - pi represents the job risk;
- β and φ are the equation parameters to be estimated by regression.
35 Insofar as these consequences may be foreseen by the worker. 36
Another approach, contingent valuation, consists of building a questionnaire that can be used to reveal respondents’ willingness to pay when confronted by hypothetical market situations.
37
In this case, a willingness to accept (or to receive).
However, according to Mincer (1974), an individual’s wage is obtained by:
) (Xiβ piφ i
e
w
=
+ (8)That is why most researchers instead use the semi-logarithmic form of equation (7):
φ β i i i X p w)= + ln( (9)
Deriving equation (9) with respect to pi, we obtain
φ = i i dp w dln( ) (10)
where φ is the percentage variation of wi for a change of one unit of pi. In other words, it is the risk premium demanded by individual i to accept a marginal variation in his risk. To obtain the willingness to pay (or receive), we instead require dwi/dpi. Breaking down equation (10), we obtain: φ = ⋅ = i i i i i dp dw w dp w dln( ) 1 (11) φ ⋅ = = i i i w dp dw DAP (12)
The willingness to pay of individual i is thus obtained by multiplying parameter φ by the wage of
i. Depending on the dependant variable wi, the willingness to pay will be expressed in hourly,
weekly, monthly, or annual terms.
The econometric specification is obtained simply by adding a random error term to equation (9), which reflects the unobservable factors influencing i’s wage:
i i i i X p u w)= β + φ+ ln( (13)
Using linear regression to estimate the parameters of equation (13), we obtain φˆ, which is the average risk premium for a marginal increase in the probability of death or injury. Based on equation (12), we note that the sample’s average willingness to ply is obtained by multiplying φˆ by the average wage. However, to avoid introducing a bias, using the average wage in the willingness-to-pay calculation requires using a rather homogenous and large sample.
Lastly, if the goal is to calculate the value of a statistical life, the willingness to pay, expressed in annual dollars, has be to divided by the change in the probability of death, which, in the