BARRIERS TO SUCCESSFUL
APPLICATION OF INFORMATION
TECHNOLOGY IN BOTSWANA.
Tiroyamodimo Mmapadi Mogotlhwane
Research Institute for the Built and Human Environment
(BuHu)
School of Built Environment
Table of Contents
List of Tables i
List of Figures ii
Acknowledgements iv
Declaration v
Abbreviations vi
Abstract viii
CHAPTER 1: INTRODUCTION ... 1
1.1 Background Information... 1
1.2 Introduction ... 2
1.3 Research Question ... 5
1.4 Aim and objectives... 5
1.5 Background to the problem... 6
1.6 Contribution to knowledge ... 7
1.7 Study Limitations... 12
1.8 Structure of thesis... 13
CHAPTER 2: LITERATURE REVIEW... 16
2.1 Introduction ... 16
2.2 Terminology ... 16
2.2.1 Information and Communication Technology (ICT). ... 16
2.2.2 Performance and Service Delivery ... 17
2.2.3 Productivity/ Effectiveness ... 18
2.3 Results of Previous Studies ... 22
2.3.1 Measurement errors ... 22
2.3.2 Adaptation Strategy... 23
2.3.3 Effective Use ... 23
2.3.4 Type of Business... 24
2.4 Maturity Models... 24
2.4.1 Process-Based Maturity Models (ProsBMM)... 25
2.4.2 Product-Based Maturity Models (ProdBMM) ... 25
2.4.3 General Practitioner IS (GPIS) ... 25
2.4.4 IT Value Hierarchy Model... 25
2.5 Organisational Structure ... 27
2.5.1 Organisation... 27
2.5.2 Power in organisations ... 31
2.5.3 Change Management... 34
2.6 Skills in ICT... 35
2.7 Service to Customers... 36
2.8 Employees/users ... 39
2.8.1 Psychological contract... 39
2.8.2 Effective Utilisation of ICT ... 40
2.9 Information... 41
2.9.1 Desirable Characteristics of information... 42
2.10 Summary ... 43
CHAPTER 3: BOTSWANA’S PRODUCTIVITY & ICT ... 44
3.1 Introduction ... 44
3.1.1 Privatisation... 45
3.1.2 Utilising ICT ... 46
3.2 ICT Development in Botswana... 48
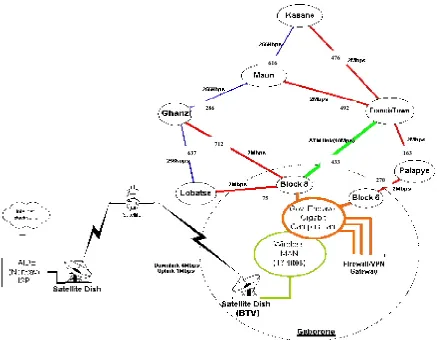
3.2.1 Capability of Botswana Government Data Network (GDN) ... 49
3.3 ICT Implementation in Botswana ... 52
3.3.1 Using Appropriate Technology ... 54
3.4 IT Specific Issues in Productivity in Botswana ... 54
3.5 The Network Readiness Index... 55
3.5.1 Environment ... 58
3.5.2 Readiness ... 58
3.5.3 Usage... 59
3.5.4 Calculation of NRI and its sub components... 60
3.6 Example of ICT introduction in Government ... 62
3.6.1 UK e-government Initiatives ... 62
3.6.2 Singapore Success in ICT... 65
3.7 Benchmarking Botswana ... 66
3.7.1 Economic and Population Comparison ... 68
3.7.2 Comparison of Network Readiness (NRI) ... 70
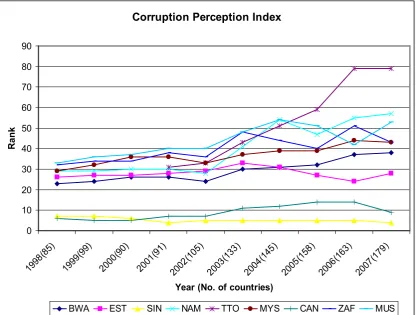
3.8 Corruption and ICT ... 72
3.9 Botswana ICT Policy... 74
3.9.1 Mega-Programme ... 75
3.9.2 Challenges to Botswana ICT Policy ... 75
3.10 Knowledge Gap from Literature ... 84
3.11 Summary ... 85
CHAPTER 4: RESEARCH APPROACH & METHODOLOGY ... 87
4.1 Introduction ... 87
4.2 Methodology ... 87
4.2.1 Experiment Strategy... 92
4.2.2 Design and Create ... 93
4.2.3 Action Research ... 93
4.2.4 Ethnography... 93
4.2.5 Survey ... 94
4.2.6 Case Study... 94
4.3 Justifying Research Strategy Adopted ... 94
4.4 Doing Research ... 95
4.4.1 Process ... 96
4.4.2 Participants ... 96
4.4.3 Research Paradigm... 97
4.5 Rigor and Relevance of Research ... 101
4.5.2 Generalisation ... 103
4.5.3 Reliability... 104
4.5.4 Validity... 105
4.6 Research Process... 106
4.6.1 Research Strategy... 107
4.6.2 Research Variables ... 107
4.6.3 Data Generation Methods ... 118
4.7 Data Analysis Methods ... 120
4.7.1 Types of Research Data... 121
4.8 Primary Data Collection ... 126
4.9 Ethical Issues in Botswana ... 126
4.10 Questionnaire development ... 127
4.11 Questionnaire Administration... 128
4.11.1 Customer Satisfaction... 128
4.11.2 Employee and User Satisfaction... 130
4.11.3 Computer Information ... 132
4.12 Results of Data Collection... 133
4.13 Problems Encountered During Data Collection... 134
4.14 Secondary Data ... 135
4.15 Summary ... 135
CHAPTER 5: DATA ANALYSIS ... 136
5.1 Introduction ... 136
5.2 Customer Satisfaction... 138
5.2.1 Introduction ... 138
5.2.2 Gender ... 138
5.2.3 Education Level... 139
5.2.4 Employment Status ... 139
5.2.5 Overall Quality of Service... 141
5.2.6 Helpful and Friendly ... 142
5.2.7 Employees Knowledgeable ... 143
5.2.8 Quality of Advice Given ... 144
5.2.9 Perception of Amount of Attention... 145
5.2.10 Efficiency of processing requests ... 146
5.2.11 Satisfaction with queue frequency ... 147
5.2.12 Satisfaction with time in queue ... 148
5.2.13 Effort to reduce queue ... 149
5.2.14 Apology to customers for queuing ... 150
5.2.15 Estimation of time spent on a queue... 152
5.2.16 Getting service first time ... 153
5.2.17 Customer complaints ... 154
5.2.18 Complaint acknowledgement... 155
5.2.19 Response to complaint ... 156
5.2.20 Time taken to address the complaint ... 157
5.2.21 Satisfaction with complaint resolution ... 158
5.2.22 ICT availability ... 159
5.2.23 Computer presence ... 159
5.2.24 Computer contribution to service ... 161
5.2.25 Internet access ... 161
5.3 Employee Relations ... 173
5.3.1 Introduction ... 173
5.3.2 Gender ... 175
5.3.3 Education Level... 175
5.3.4 Perceptions of Fairness of Treatment ... 176
5.3.5 Summary of Perception of fairness of Treatment ... 179
5.3.6 Employee Direct Participation ... 180
5.3.7 Summary of Employee Direct Participation ... 184
5.3.8 Employees’ Trust and Fairness... 185
5.3.9 Summary of Employee Trust and Fairness ... 188
5.3.10 Levels of Commitment to the Department ... 189
5.3.11 State of Employment Relations... 191
5.3.12 Employee Motivation and Effort ... 193
5.3.13 Department Citizen Behaviour ... 196
5.4 User Satisfaction... 203
5.4.1 Introduction ... 203
5.4.2 Gender ... 205
5.4.3 Education Level... 205
5.4.4 Experience of Using Computers... 206
5.4.5 ICT Skills of Employees ... 208
5.4.6 Computer Use ... 208
5.4.7 Reliability... 210
5.4.8 Responsiveness... 211
5.4.9 Assurance ... 213
5.4.10 Empathy ... 214
5.4.11 Cross Tabulation of Results... 215
5.5 Contribution of ICT... 218
5.6 Status of ICT... 220
5.6.1 Department of Road, Transport and Safety (DRTS)... 220
5.6.2 Department of Civil and National Registration (DCNR) ... 221
5.7 Summary ... 223
CHAPTER 6: DISCUSSION OF RESULTS... 224
6.1 Introduction ... 224
6.2 Customer satisfaction ... 224
6.3 Natural Products Barrier to Innovation ... 225
6.4 Botswana’s opportunities and challenges ... 227
6.5 State of Employee Relations (Psychological contract)... 228
6.6 Maturity Level of Government Departments ... 229
6.7 Summary ... 231
CHAPTER 7: FRAMEWORK FOR BOTSWANA ... 232
7.1 Introduction ... 232
7.2 National Framework for ICT exploitation... 232
7.2.1 Government Data Network (GDN)... 233
7.2.2 Legal Framework... 234
7.2.3 Technical Standards... 234
7.2.4 Data Security... 234
7.2.5 Data Standardisation... 234
7.2.7 Mobile Computing & Department ... 235
7.3 Framework for the Botswana Public Sector ... 236
7.3.1 Reliable Power Supply ... 239
7.3.2 Networked PCs ... 240
7.3.3 Internet/Email ... 240
7.3.4 Simple IT Applications... 241
7.3.5 IT Standardisation ... 241
7.3.6 Inadequate IT Policies... 241
7.3.7 Reactive IT Support... 241
7.4 Increase use of IT in public sector ... 242
7.5 Culture of work changes ... 242
7.6 Summary ... 243
CHAPTER 8: CONCLUSIONS ... 244
8.1 Introduction ... 244
8.2 Key findings ... 244
8.3 Recommendations... 245
8.4 Further Research ... 248
8.5 End Note... 249
REFERENCES 250
Appendix A: Research Permit Application Form 265
Appendix B: Approval of Research Permit 274
Appendix C: Permission to use CIPD questionnaire 276
Appendix D: Approval letter to participants 279
Appendix E: Customer Satisfaction Questionnaire + data codes 280
Appendix F: Employee Relations Questionnaire + data codes 283
Appendix G: User Satisfaction + data codes 286
Appendix H: ICT Inventory 289
Appendix I: Semi-structured interview questions 290
Appendix J: Age and Employment Status of Customers 291
List of Tables
Table Title Page
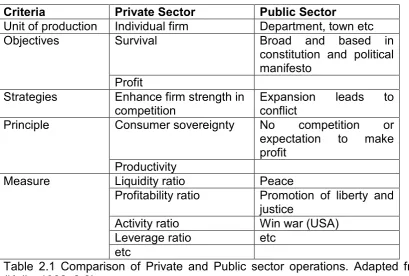
Table 2.1 Comparison of Private and Public sector operations 28 Table 2.2 Examples of Customer Satisfaction Index Barometers 38
Table 2.3 Data, Information and Knowledge 42
Table 3.1 Capability of GDN 49
Table 3.2 Information and Communication Technology Expenditure from NDP 7 to 9 50
Table: 3.3 Variables of Network Readiness Index 61
Table: 3.4 Singapore’s Computerisation Plans 65
Table 3.5 Characteristics and Effects of Mega Project 75
Table 3.6 Botswana e-government initiatives 84
Table: 4.1 Elements of Robson Framework for Research Design 89
Table: 4.2 Departments selected as case studies 97
Table 4.3 Different types of errors 103
Table 4.4 Terminology of Data Analysis 121
Table 4.5 Relationship between the four types of research variables 124 Table 4.6 Research Themes and Variables for Data Collection 128
Table 4.7 Response Rate for Employee and User Satisfaction 133
Table 5.2.1 Employment status and computer ownership 166
Table 5.2.1a Chi-square values for Table 5.2.1 166
Table 5.2.2 Gender and Internet Access of Respondents 168
Table 5.2.3 Education level and Internet Access 170
Table 5.2.3a Chi-square values for Table 5.2.3 170
Table 5.2.4 Age of respondent and Internet Access 171
Table 5.2.4a Chi-square values for Table 5.2.4 171
Table 5.3.1 Perception of Fairness of Treatment 179
Table 5.3.2 Employee Direct Participation 184
Table 5.3.3 Trust and Fairness 188
Table 5.3.4 Department Citizenship Behaviour 201
Table 5.4.1 Gender and Computer Ownership cross tabulation 215
Table 5.4.1a Chi Square test for Table 5.4.1 215
Table 5.4.1b Education Level as a Control layer for Table 5.4.1 216
Table 5.4.1c Chi Square test for Table 5.4.1b 217
Table 5.5.1 Contribution of IT to Department Functions 218
Table 6.1 Opportunities and Challenges to Botswana 227
List of Figures
Figure Title Page
Figure 1:1 Map of Botswana 1
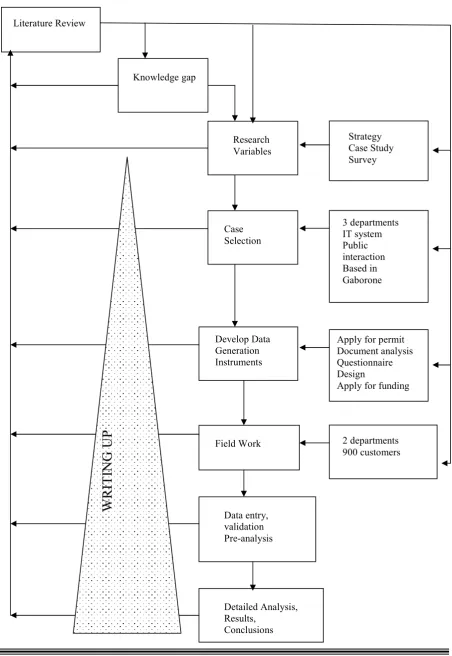
Figure 1:2 Schematic Representation of Work Done 4
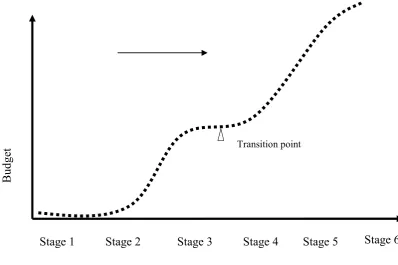
Figure 1.3 Nolan (1979: 117) maturity model 11
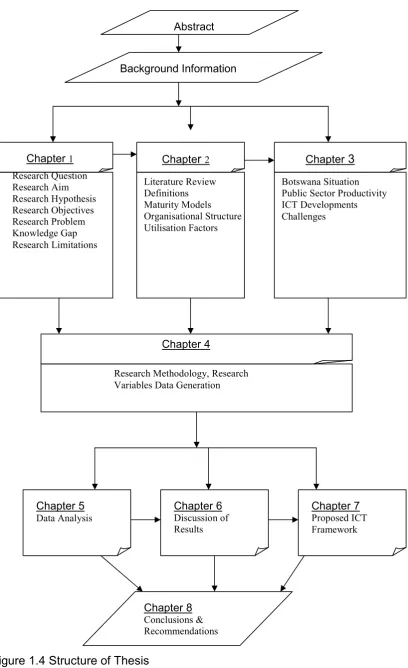
Figure 1.4 Structure of Thesis 15
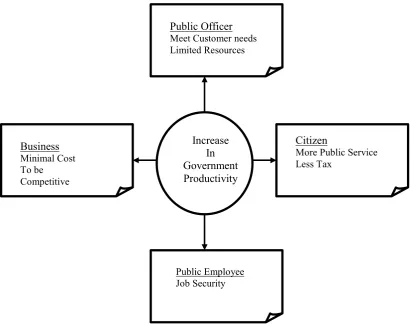
Figure 2.1 Effect of Increase in Government Productivity. 20
Figure 2.2 Maslow’s Hierarchy of Needs and The IT Value Hierarchy 26
Figure 2.3 information management and organisational levels 29
Figure 2.4 Degree of influence/power within public sector 32
Figure 2.5 Examples of Empowerment 33
Figure 2.6 Data volume and processing cost for manual and computer based systems 43
Figure 3.1 Botswana government data network 48
Figure 3.2 Implementation changeover strategies 53
Figure 3.3 The Network Readiness Index Framework 57
Figure 3.4 Benchmarking Botswana Countries 67
Figure 3.5 Comparison of GNI per Capita Atlas Method 69
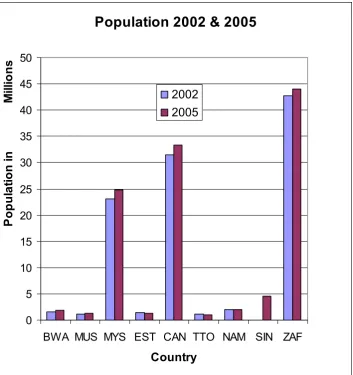
Figure 3.6 Comparison of Population for 2002 and 2005 70
Figure 3.7 Botswana’s Declining NRI (2002 to 2006) 71
Figure 3.8 Corruption Perception Index of selected countries for this research 73
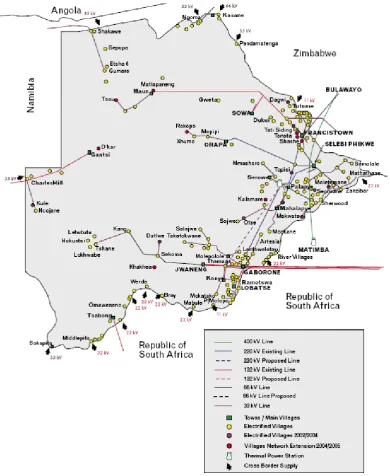
Figure 3.9 National Electricity Grid of Botswana 77
Figure 3.10 Expenditure on R&D as % of GDP of Selected Countries 81 Figure 4.1 Research Strategy and Robson Framework for Research Design (RFRD) 90
Figure 4.2 Stages of Doing Research 92
Figure 4.3 Research methodological approach 98
Figure 4.4 Research Methodology Framework 100
Figure 4.5 Research Methodology 106
Figure 4.6 Research Conceptual Model 108
Figure 4.7 Successful ICT Utilisation and Criteria 109
Figure 4.8 Determining Maturity Level Based on Nolan’s Bench Mark 110
Figure 4.9 Nolan Maturity Level Benchmarks 111
Figure 4.10 Descriptors for Maturity Level using IT Value Hierarchy 112
Figure 4.11 Research Variables 118
Figure 4.12 Research Variables classification 124
Figure 5.1.1 Customer satisfaction results overview 137
Figure 5.2.1 Gender of respondents 138
Figure 5.2.2 Education level of respondents 139
Figure 5.2.3 Employment status of respondents 141
Figure 5.2.4 Satisfaction level with quality of service 142
Figure 5.2.5 Customer Satisfaction with Employees being Helpful and Friendly 143
Figure 5.2.6 Satisfaction with knowledge of employees 144
Figure 5.2.7 Satisfaction with quality of advice given 145
Figure 5.2.8 Satisfaction with attention given 146
Figure 5.2.9 Satisfaction with efficiency of processing requests 147
Figure 5.2.10 Satisfaction with queue frequency 148
Figure 5.2.11 Satisfaction with queuing time 149
Figure 5.2.12 Satisfaction with efforts to reduce queuing 150
Figure 5.2.13 Satisfaction with apology given for queuing 151
Figure 5.2.14 Comparison of satisfaction level 152
Figure 5.2.15 Estimation of waiting time 153
Figure 5.2.16 Customers estimation of not getting service first time 154
Figure 5.2.17 Customer complaint status 155
Figure 5.2.18 Satisfaction with complaint acknowledgement. 156
Figure 5.2.19 Satisfaction with response to complaint 157
Figure 5.2.20 Satisfaction with time taken to address complaint 158
Figure 5.2.21 Satisfaction with resolution of complaint 159
Figure 5.2.22 Computer visibilities in government departments 160
Figure Page
Figure 5.2.25 Internet access among 4 locations 162
Figure 5.2.26 Home computer and internet connection 163
Figure 5.2.27 Low internet access to homes 164
Figure 5.3.1 Overview of employee relations results 174
Figure 5.3.2 Gender of respondents 175
Figure 5.3.3 Education Levels of Respondents 176
Figure 5.3.4 Employee Supervision 177
Figure 5.3.5 Perceptions about Payment 178
Figure 5.3.6 Rewards for Input Effort 179
Figure 5.3.7 Employees Perception of fair treatment 180
Figure 5.3.8 Work initiatives by employees 181
Figure 5.3.9 Ability of Employees to Plan their Work 182
Figure 5.3.10 Employees Vary How They Work 183
Figure 5.3.11 Choose Assignment to Work On 184
Figure 5.3.12 Employees Perception of Direct Participation 185
Figure 5.3.13 Department’s Commitment to Employees 186
Figure 5.3.14 Employees Trust on Management 187
Figure 5.3.15 Comparison of a repeat question 188
Figure 5.3.16 Employee Trust and Fairness 189
Figure 5.3.17 Employees Loyalty to Department 190
Figure 5.3.18 Employees Pride for the Department 191
Figure 5.3.19 Perceptions about Employees Relations 192
Figure 5.3.20 Satisfaction with Individual Influence in Department Decisions 193
Figure 5.3.21 Employees’ Motivation 194
Figure 5.3.22 Employees State of Looking Forward to Work 195
Figure 5.3.23 How Hard Employees Think They Work 196
Figure 5.3.24 Desire to work even when not well 197
Figure 5.3.25 Loyalty to department 198
Figure 5.3.26 Work overtime when required 200
Figure 5.3.27 Volunteer to do tasks outside job description 201
Figure 5.3.28 Employee Department Citizenship Behaviours 202
Figure 5.4.1 Overview of user satisfaction results 204
Figure 5.4.2 Education Levels of Respondents 206
Figure 5.4.3 Experience of Using computers 207
Figure 5.4.4 Computer Training 207
Figure 5.4.5 Self Rating of ICT Skills 208
Figure 5.4.6 Daily Uses of Computers 209
Figure 5.4.7 Estimated computer usage time per working day 210
Figure 5.4.8 Variation in level of reliability 211
Figure 5.4.9 comparison of responsiveness of IT service department 212
Figure 5.4.10 Assurance from IT staff 213
Figure 5.4.11 Users perception of Empathy 214
Figure 6.1 Urwiler & Frolick (2008) Maturity Levels 230
Figure 7.1 Botswana’s National Framework for ICT Exploitation 233 Figure 7.2 Botswana’s Position in Urwiler & Frolick (2008) Maturity Levels 237
Acknowledgements
The journey of doing this research has exposed me to many people and units of the University of Salford. I am grateful particularly to ISD Training Unit which has offered me the skills to work smart and not hard. School of Graduate Studies which provided me with the road map and support on what PhD is all about. School of Built Environment for providing me with the space and all resources I needed. I have never run short of anything. The Built and Human Environment (BuHu) under which I was based has a team of dedicated researchers with whom I have interacted with in many ways and their high quality research practice explains why BuHu is 6* rated.
I would like to express my gratitude to my supervisor Professor Farzad Khowsrowshahi and Co-Supervisor Dr Jason Underwood who guided me while at the same time giving me room to learn by myself. Their support has provided me with the foundation that I can use to improve my research profile, which was one of the major reasons for doing this PhD.
My sponsor and employer, University of Botswana, is acknowledged for sponsoring me to come and do my research at a heavy price. The money that they have invested in me over the three years could easily have benefited an entire village in my country, but they chose to invest that money in me alone. The road to this PhD has been a difficult one at times. I lost my mother from natural illness and before she was buried four of my sisters perished in a car accident. Six months later my nephew was killed by a car. They would have loved to see me after my studies. May their souls rest in peace.
Declaration
Abbreviations
American Customer Satisfaction Index ACSI
Birth and Death Register System BDRS
Botswana National Productivity Centre BNPC
Botswana Power Corporation BPC
Botswana Technology Centre BoTeC
Botswana Telecommunications Corporations BTC Chartered Institute of Personnel and Development CIPD
Chief Executive Officers CEO
Chief Information Officers CIOs
Civil Service Computerisation Programme CSCP Department of Civil and National Registration DCNR Department of Public Service Management DPSM Department of Road, Transport and Safety DRTS Driver and Vehicle Licensing Agency DVLA
European Computers Drivers Licence ECDL
Free On-line Dictionary of Computing FOLDOC
General Practitioner IS GPIS
Government Data Network GDN
Gross Domestic Product GDP
Gross National Income GNI
Gross National Product GNP
Information and Communication Technology ICT
Information Technology IT
Information Systems IS
International Computer Drivers Licence ICDL
Institute of Personnel Development IPD
Joint Funding Councils of the United Kingdom JFCUK
Just in Time JIT
Knowledge Workers KWs
Livestock Identification System LIS
Local Government Modernisation Agenda LGMA
Millennium Development Goals MDG
Moment of Truth MOT
National Health Service NHS
National Registration System NRS
National University of Singapore NUS
Network Readiness Index NRI
Non-Government Organisations NGO
One-Stop Business Licensing Portal OBLS
Oxford English Dictionary OED
Process Based Maturity Models ProsBMM
Product Based Maturity Models ProdBMM
Robson Framework for Research Design RFRD
Scandinavian Airlines SAS
Service Quality SERVQUAL
Society for Information Technology Management SOCITM Swedish Customer Satisfaction Barometer SCSB
Total Quality Management TQM
Work Improvement Teams WITS
World Economic Forum WEFORUM
Abstract
This research looked at barriers to successful applications of information and communication technology (ICT) in Botswana. Botswana has high investments in ICT infrastructure development in the public service. However, there is still concern about service delivery not being satisfactory. Many departmental functions are still performed manually despite the availability of computers and people capable of using them
The research question addressed is why there is lack of exploitation of ICT in the Botswana public sector. Two government departments based in the capital city were selected as case studies and investigated using questionnaires and semi structured interviews to determine the status of employee relations and ICT use. Questionnaires were used to solicit satisfaction perception of the general public about public service using a sample of capital city population.
This research revealed a digital divide within Botswana. Within the public sector, computer penetration as well as internet access is very high as there is 1 computer for every 2 employees. For the general public, computer ownership is low as about 28% of the population have computers at home. Despite availability of computers in the public service, members of the public experience delay when they seek service. Motivation and payment are biggest problem regarding employee relations. ICT support is satisfactory though this might be due to low level of ICT use. Fear of change is the main limiting factor to ICT exploitation in Botswana.
CHAPTER 1: INTRODUCTION
1.1
Background Information
[image:16.595.133.478.258.565.2]The Republic of Botswana is situated in Sub-Saharan Africa. It is land-locked and shares a border with the following countries, South Africa in the south, Zimbabwe in the east, Zambia in the north, Namibia in the west and a small portion in the north-west with Angola. Figure 1.1 shows the geographic location of the country.
Figure 1.1: Map of Botswana
diamonds to develop itself and it is now classified as an upper middle income country (WORLDBANK, 2007a).
The economic success of Botswana raises expectations on other developments such as ICT infrastructure, satisfactory customer satisfaction etc. The small population of the country makes it ideal to achieve these social and infrastructural developments. Also the gradual increase in high education attainment among the general public in particular the public service also favour satisfactory customer satisfaction. Unfortunately service delivery and project implementation has been problematic to achieve in Botswana.
1.2
Introduction
This study looked at the impact of information and communication technology applications in service delivery of selected government departments of Botswana. It is intended to support Botswana’s vision of becoming an international information and communication technology hub. It is not always the case that when an organisation adopts and implements information and communication technology, it will achieve the desired goals of productivity gains and better work practices. According to Schrage (1997: 178) the investments in information technology have been based on a “lie” which is so perfect that it is easy to believe. Schrage (1997) was referring to the promise that has been widely published, mainly by the information technology practitioners on use of information technology in organisations.
In Botswana, within the last ten years, the government has invested heavily in providing relevant information and communication technology infrastructure in all government departments. This is especially true in the selected government departments for this study. Since the early 1990’s there has been an outcry about lack of productivity in most of government departments. When Thapisa and Jain (2000: 86) looked at perceptions about productivity in academic and public libraries in Botswana, lack of productivity also came out.
information and communication technology infrastructure in government departments. Some of these intervention measures yielded expected results according to Selepeng (2002: 2), however the problem is still going on today, despite relatively good information and communication technology infrastructure such as email, internet and telephone availability in government departments. According to Little and Bose (2004c), Botswana
“is already an active participant in the global information society” (Little and
Bose, 2004c: 14).
There has not been any detailed study to find out why information and communication technology introduction in government has not had a positive impact on productivity. Generally, the introduction of information and communication technology in Africa has been shown not to have delivered expected results. The main reasons for this are that the introduction was driven from the top of organisations and also supply led (Unwin, 2005: 116). Based on literature as discussed in chapter 2 and in order to reduce the scope of this research, it has been limited to the following: issues of employee relations, user support, ICT infrastructure and state of customer satisfaction in Botswana. How these issues are addressed can determine the success or failure of information and communication technology.
Knowledge gap Literature Review
Research Variables
Strategy Case Study Survey
Case Selection
3 departments IT system Public interaction Based in Gaborone
Develop Data Generation Instruments
Apply for permit Document analysis Questionnaire Design
Apply for funding
Field Work 2 departments 900 customers
Data entry, validation Pre-analysis
Detailed Analysis, Results,
Conclusions
W
R
IT
IN
G
U
[image:19.595.91.544.62.719.2]P
1.3
Research Question
Development of a research question is a process of looking at an issue that might be a problem that is taken for granted and formulating a question about it. The research question emphasises lack or absence of understanding about an issue. It is this gap that the researcher wants to address (Sweet and Grace-Martin, 2003: 4). The main question that this research tries to answer is:
Why information and communication technology applications are not having positive impact in service delivery by government departments of Botswana? Service delivery is a phrase derived from the phrase service and delivery. According to (OED, 2006) service means
“the condition of being a servant; the fact of serving a master or the condition or employment of a public servant (of a sovereign or state)”. Delivery is “The action of handing over, or conveying into the
hands of another” (OED, 2006).
The impact of ICT is investigated both internally in terms of government employees using it and externally on members of the public being served by government employees in Botswana.
1.4
Aim and objectives
The aim of this research was to develop a framework for information and communication technology exploitation in aid of improving service delivery in Botswana public service. The aim was achieved through investigating the following objectives:
determine status of ICT developments in Botswana in comparison with global trends
determine maturity level of information and communications technology in selected Botswana government departments.
determine the limiting factors to full utilisation of information and communication technology by Botswana government departments. determine customer satisfaction levels on services offered by Botswana
government departments
determine user level of satisfaction with information and communication technology use and support in selected Botswana government departments.
develop a framework to help Botswana government departments increase use of information and communication technology applications. determine state of psychological contract among civil servants of
The objectives were researched in the selected government departments. For customer satisfaction, a sample of the population in Gaborone was used. This was to minimise travelling time and costs. Gaborone as the capital city has the best information and communications technology facilities in the country.
1.5
Background to the problem
There is a need to conduct comprehensive research as to why information and communications technology has not improved service level provision in government departments. The impact of information and communications technology on productivity was summarised as
“It can help you with your problems, but those problems won’t
disappear just because you have a computer” (Gates, 1999b: 16).
Gates (1999b) was emphasising that information and communication technology alone cannot lead to productivity gains.
Earlier research into determining the relationship between information and communication technology investments, productivity gains and work practices was inconclusive. This was because it was not possible to isolate information and communication technology input; there are other inputs that contribute to productivity in organisation as observed by Brynjolfsson (1993: 67). It will not be fair to put all the blame for lack of productivity gains on information technology alone.
The problem of technology in information management has been researched and can be deduced from the following questions:
“But why is it that most of us, deep down, feel frustrated by information technology? Why do most workers –even CEOs-find it so hard to adjust to new systems and the information skills they require? Why isn’t this revolution all it’s cracked up to be?” (Davenport, 1997: 3)
IT specialists like chief information officers (CIOs) (Nolan and McFarlan, 2005: 98).
Botswana government departments lack appropriate methodologies and suitable instruments of analyses to ensure that information and communication technology and work practices are leading to productivity gains. The research is in line with Botswana Government priority in the National Development Plan 9 (NDP 9), which is “focused on high quality service delivery and improving
organisational performance”
1.6
Contribution to knowledge
Research into finding ways to exploit the power of a computer has been extensively done in developed countries especially USA. The USA has been the producer of both hardware and software through companies like IBM and Microsoft respectively. Microsoft has been the biggest driver to USA success in information and communication technology. The founder and former chairman of Microsoft, Bill Gates is regarded as one of the technological entrepreneurs of the time. Under Gates’ leadership Microsoft managed to capture the market in software production through its ‘Windows’ operating system and Microsoft Office suite.
There has been a significant increase in the budget allocated for ICT in many organisations. This has led to continued concern regarding the effect of such investments as observed by Mahmood et al. (2001), who stated the following:
"With an estimated investment of over 1 trillion dollars to date on information technology (IT) products and applications, one would hope that there exists a corresponding improvement in organizational performance and productivity. The level of IT usage has widely been accepted as an important indicator of IT success within organizations" (Mahmood et al., 2001: 107).
The call for understanding the impact of ICT in Africa has been summed up by Adeya(2001) who stated the following:
“Yet, with all the ‘noise’ surrounding the potential of ICTs to speed African developments, is there evidence for it? Are ICTs actually
changing the ‘shape of Africa?”(Adeya, 2001: 4).
introduced in Africa, for example in South Africa, Botswana etc, this technology is actually bringing the desired benefits.
NEWSbits (2006: 8) estimated that in 2005 worldwide expenditure on information technology was about 1 trillion US dollars. Basden (2008) has questioned whether the world was gaining benefits worth that amount of money. Basden (2008) goes further and ask if it is not better for the world to spend that money on “health, overcoming poverty reduction, or reducing climate change
and environmental damage” (Basden, 2008: 1). But these other options for
spending money are not big issues to the developed world except climate change, which one of the developed countries, namely US, has not yet agreed to tackle.
It is worth noting that the high expenditure in information technology is mainly in developed countries and developing countries, especially those in Sub-Saharan Africa, contribute little to this. Their contribution is mainly as consumers of the technology. Publication on computer based information systems in Africa has been observed to be very rare (Walsham, 2001: 194).
Basden (2008: 1) has proposed the following five questions that can be used in trying to find an answer regarding gaining value from information technology. They are
• Perhaps it is because our technologies are not yet good enough?
• Perhaps it is because we do not use IT in the right way or for the right things?
• Perhaps it is because information systems (IS) development is
inefficient?
• Perhaps we too readily accept the way IT controls our lives, and the assumption that IT is the solution to everything?
• Perhaps our very assumptions about the nature of computers and what
they can do for us are mistaken?
All of the above questions illustrate the current lack of consensus as to what can explain the problem. Hence each of the five questions is worth pursuing as a field of study to contribute knowledge to the understanding of impact of information technology. This research explores the second question further.
for majority of Sub-Saharan countries where, according to Chinn and Fairlie (2004: 7), computer penetration is 1 computer to 100 people. On the other hand some of the developing countries especially those in the Asian pacific region like India have managed to take advantage of information and communication technology and according to Singh (2002: 21) are exploiting this to their advantage. Some other Asian countries which are also doing well in this area are Malaysia and Singapore. According to WEFORUM (2006: xv) information and communication technology infrastructure ratings for India, Malaysia and Singapore were 40, 24 and 2 respectively out of a total of 115 countries that were covered. Singapore was second to USA. These rankings are based on the network readiness index methodology discussed in section 3.5.
The majority of reports from African countries concentrate more on the number of ICT artefacts being made available. While this is important, the most important information will be to know the profile of people using them and what they use them for (Adeya, 2001: 18). This research contributes to this call to determine the digital divide that exists within Botswana (see Section 5.2.25.1).
Literature review has revealed that in developing countries, especially those in Sub-Saharan Africa, their knowledge base in information and communications technology application is limited. According to Oshikoya and Hussain (1998: 10) South Africa accounted for a lot of information and communication technology distribution in Sub-Saharan Africa. Despite being in Sub-Saharan Africa, Botswana has a fairly developed information and communications technology infrastructure and it comes third behind Tunisia and South Africa, with rating of 56, according to WEFORUM (2006) networked readiness index rankings 2005.
Botswana’s information and communications technology infrastructure development is not reflected in productivity ratings. Understanding of factors that hinder proper exploitation of information and communications technology in Botswana will benefit the information system community as well as government of Botswana. This research aims to contribute knowledge to understanding barriers to exploitation of information and communication technology in Botswana.
information technology. The impact of information technology in society is under-researched especially in context of developing countries (Walsham, 2001: 251), (Walsham and Sahay, 2006: 8), (Halewood and Kenny, 2008: 172). This research adds to this knowledge gap.
There has been so much interest in technology and what it can do that in the process the role of information has been forgotten, which is to inform people (Davenport, 1997: 3). The effect of computer products on people as they use them is an area that is under-researched. The importance of understanding human factors is emphasised even more clearly by the following observation
“to understand the impact of computers within organisations, for example, you would be better advised to learn about the ‘wetware’ between people’s ears than about hardware and software” (Heeks, 2002: 15)
This research will contribute to this area as it concentrates on understanding the social dimension of information technology. Limited research that looks into problems that a lot of organisations face in “...implementing, maintaining and
monitoring effective IT governance” has also been highlighted by Williams
(2006: 26). This research contributes to knowledge in this area especially in the public sector. The need for further research in use of computers has also been called for by Oates (2006: 22) who highlighted that computers and related technologies are still new to human beings and still developing, hence there is a need to find out how to use them effectively. The greatest challenge to success in utilisation of information technology has been shown to be more with people than the technology (Roepke et al., 2000: 327).
Figure 1.3 Nolan (1979: 117) maturity model
Application of the theory of psychological contract to investigate what could be the reasons for underperformance by civil servants will also provide understanding of the problem of underperformance in Botswana. This theory has not been applied to understanding the role of the users work environment in the increasing use of information technology in the workplace. However, psychometric tests provided valuable knowledge when used in information systems research. For example, Earl and Feeny (1994: 17) used the Myers Briggs Psychological Preference Test and Belbin’s team-role self perception inventory to determine the qualities of a chief information officer (CIO) who adds value. Botswana’s intervention measures on dealing with low performance by civil servants have been looking at contractual obligations only. Psychological contract testing has not been applied widely in information systems research; hence this research bridges this gap.
Research by Guest and Conway (1998) raised the concept of psychological contract when they looked at the state of the employment relationship in the UK. Guest and Conway (1998: ix) stated that “Employees develop a set of informal
assumptions, expectations and obligations about what the employer ‘owes’
them” that can be attributed to the psychological contract. A healthy
psychological contract was found to exist within the UK employment sector by
Stage 1 Stage 2 Stage 3 Stage 4 Stage 5
B
ud
ge
t Transition point
Guest and Conway (1998: vii). Despite negative publicity about UK employees, latest research by CIPD (2005: 4) still showed that this is still true. A comparison of state of psychological contract between Botswana and UK is made in this research.
This research covers the psychological contract and determines its state in trying to find out limiting factors to utilisation of information and communications technology in Botswana. A healthy psychological contract is likely to lead to the desire to perform well. It is when the motivation of employees is high that they are likely to exploit information and communications technology made available to them as observed by Bhatnagar (2000: 2). The national and public sector frameworks developed in this research contribute to knowledge about use of ICT in Botswana and can be adapted to other developing countries (Chapter 7)
1.7
Study Limitations
This research is exploratory as the aim was to find out if indeed customers are not satisfied as it is often alleged, whether Botswana government employees are content with their work environment and also if they have access to ICT as well as the required ICT skills. As it is exploratory the research does not pinpoint critical problems areas.
Customer perceptions were not specific to a particular department; hence their views might reflect the situation in a specific department. As the departments do not have structures in place to address customer complaints, a minor issue which might not have been a complaint if the customer has had the chance to express his/her feelings may turn out to be the only thing that is remembered. It is human nature to remember the bad experience and not the good ones.
There was low response rate to employee and user satisfaction questionnaires. This affected statistical analysis of results as it was not possible to do cross tabulation of variables to determine relationships. Due to time and financial constraints, interval quantitative data was collected during field study. This has limited data analysis to non-parametric analysis only.
general reports provided valuable information. Auditor general reports have statutory requirements and hence their preparation is based on information provided by senior officers.
Future research should try and adopt an in depth explanatory methodology within a single department, focussing also on customers specific to that department. This will allow for determination of factors and specific problems that leads to underutilisation of ICT and customer satisfaction. The recently introduced Botswana Customer Service Standards Framework will also provide relevant information on accessing performance of departments.
1.8
Structure of thesis
This thesis is organised in the following structure of chapters and sections. Each chapter has a short introduction which highlights areas covered in the various sections of the chapter. This is followed by the main body of material for the chapter followed by a chapter summary.
The first section is a short abstract which covers briefly what the whole research is about; looking at why and how this research has been done, major conclusions and recommendations that have emerged from the study. There is also a section on background information about Botswana. This section provides geographical location of the country and its brief history and economic development.
Chapter 1 is an introduction chapter which discusses the statement of the
problem researched, including aim and objectives as well as research limitations.
Chapter 2 and 3 cover review of literature related to this research. Chapter 2
looks at the global view of literature. This chapter shows that there has been concern about the effect of ICT in organisational performance before. This is still continuing. Fundamental terminologies associated with this research are provided in this chapter. Maturity models regarding adaptation and utilisation of ICT are also discussed. Organisational structure and how it affects exploitation of ICT applications is also discussed. The various factors that determine success of ICT applications as derived from literature are put forward.
and current strategies that have been adopted to address the problem, their limitations, are critically evaluated. The chapter also provides ICT developments in central government of Botswana. Botswana’s performance in terms of ICT diffusion is then presented and compared with other 8 international countries. These countries have been used before to benchmark Botswana’s ICT developments, except Singapore which has been included in this research as it is a classic example of how exploitation of human capital and not natural resources can improve economic and social life in a country. Challenges that face exploitation and diffusion of ICT application are also discussed.
Chapter 4 addresses the research methodology. The generic view of research
methodology is discussed first and this provides a foundation to justify why this research has adopted its particular research methodology. This research takes the social interpretivisim approach to knowledge creation. Rigour and relevance concepts are also discussed in this chapter. The research variables that have been derived from literature are presented. There is a discussion about how data was collected as well as problems experienced during data collection.
Chapter 5 discusses how the data has been analysed. Factors that determine
which analysis method to use are also presented. Results of analysis of the various research variables are presented in detail in this chapter. SPSS was used to do quantitative data analysis.
Chapter 6 is a discussion of the results of data analysis in relation to the
research objectives. This leads to Chapter 7 which discusses a proposed framework for ICT exploitation in Botswana.
Chapter 7 use materials from the previous chapters to propose an ICT
framework that can help the Botswana public sector exploit the existing ICT infrastructure. A national framework is also put forward that covers the whole country.
Chapter 8 is the last chapter which draws together conclusions and
recommendations deduced from this research. Further research on the topic is also provided. It is followed by list of references that have been used. The last section is a list of supporting materials that have been used and they are attached as appendices.
Figure 1.4 Structure of Thesis
Abstract
Background Information
Chapter 4
Research Methodology, Research Variables Data Generation
Chapter 5
Data Analysis Chapter 6 Discussion of Results
Chapter 8
Conclusions & Recommendations
Chapter 1 Chapter 2 Chapter 3 Research Question
Research Aim Research Hypothesis Research Objectives Research Problem Knowledge Gap Research Limitations
Literature Review Definitions Maturity Models Organisational Structure Utilisation Factors
Botswana Situation Public Sector Productivity ICT Developments Challenges
Chapter 7
CHAPTER 2: LITERATURE REVIEW
2.1
Introduction
This chapter looks at the literature that has been published on information and communication technology (ICT), performance/service delivery and productivity. It starts with terminology and then provides the results of previous research. A global picture is taken and this is narrowed down to the Botswana situation in chapter 3.
2.2
Terminology
In order to understand the topic under investigation, the main terminology used is explained in this section. The terms used in this research are those of information and communication technology, performance/service delivery and productivity. Broad definitions are given and then related to the case of the Botswana civil service to make it clear.
2.2.1 Information and Communication Technology (ICT).
Information and communication technology is defined by FOLDOC (2006) as
“The study of the technology used to handle information and aid
communication”. This is a broad definition as there are numerous technologies
that are used to deal with information and make communication easier, for example: telephone, fax, and transportation system. For this research the technology is restricted to computer technology, albeit computers are also embedded in other technologies. According to (FOLDOC, 2006) the phrase “information and communication technology” was made popular by the Stevenson (1997) report to UK government. Stevenson (1997) report looked at the best approach for the UK government to facilitate use of computers in public schools in UK. The phrase has grown in popularity throughout the world now.
Information and Communication technology has almost the same meaning as Information technology, but it is different from information systems as the following definition by (Heeks, 2002: 15) indicates
Information technology (IT) can be defined as computing and
Information systems (IS) can be defined as systems of human and technical components that accept, store, process, output and transmit information. They may be based on any combination of human endeavours, paper-based methods and IT. A financial information system of staff and computers that gathers data and processes it into reports used for managerial decision making
represents one example of an IS.
Peppard (1993) has argued that some literature uses the terms information systems and information technology interchangeably. However the two terms may not necessarily mean the same. According to Laudon and Laudon (2006) information systems (IS) is
“a set of interrelated components that collect (or retrieve), process, store, and distribute information to support decision making and
control in an organization” (Laudon and Laudon, 2006: 14).
The definition of information technology (IT) according to Laudon and Laudon (2006) is
“…all the hardware and software that a firm needs to use in order to
achieve its business objectives” (Laudon and Laudon, 2006: 13).
This above definition of IS implies that an information system might even be paper based, which is the oldest mode through which information is stored during its flow. However, with the increasing use of computers, more and more information systems are becoming computer based. There is a very close association between computer based IS and IT as one depends on the other, for example IT will not be of benefit if it did not support IS and similarly computer based IS needs IT to succeed.
In this work technology refers to a computer with the minimum hardware and software required for it to be used to accomplish a task. This also includes a computer network that might be put in place to facilitate sharing of information. Hence even where there is no network; provided the computer has the basic resources it needs for it to be used, this will still be valid for this research.
2.2.2 Performance and Service Delivery
OED(2006) gives a total of 13 different definitions for the word performance. The definitions are based on how the word is used, for example as a noun; it has at least 4 meanings. For this research the adopted definition is
machine, product, or person when measured against a standard” (OED, 2006).
Service delivery can be defined as process and actions that government employees or agents perform to meet demands of the society or other stakeholders. The execution of actions and processes facilitate service delivery. Gortmaker et al.(2005: 49) has shown that some of the service delivery processes can be simple and basic, such as issuing a parking ticket, while others can be highly complicated, such as issuing permit for the location of a chemical plant.
There are numerous stakeholders in evaluating the performance of civil servants such as consumers, taxpayers, politicians and staff. Each stakeholder may use different criteria or standard for evaluating public sector performance. However there are tangible elements of the service delivery process which are likely to be judged in the same way, for example speed of delivery, effectiveness etc (Boyne, 2003: 368).
2.2.3 Productivity/ Effectiveness
Productivity is used extensively in economics. It is defined as
“The rate of output per unit input, used especially in measuring capital growth, and in assessing the effective use of labour, materials and equipment” (OED, 2006).
In the private sector productivity is defined as above. The outputs, which can be in the form of goods or services, are expressed as a ratio of inputs used to produce them, such as labour, capital cost and land (Kelly, 1988: 8), (Hope, 1995: 43) (Hatry, 1978). This definition is difficult to apply to the public sector due to the type of outputs produced by such a sector. It is difficult to package goods and services into discrete units and price them like “ a ton of bricks”
(Kelly, 1988: 8) or “a bottle of milk” (Hope, 1995: 43).
There are direct as well as indirect outputs from the public sector. Some productivity analysts have called for measurement output to be limited to direct outputs only to be fair to government employees (Burkhead and Hennigan, 1978, Hatry, 1978) and (Hayward, 1976). They argue that productivity measurement must not include desired consequences as they are difficult to measure, as the following observation illustrates.
arrests they make, but cannot force citizens to report crimes or to be witness in court. Doctors can vaccinate children against diseases but they cannot ensure that children wash their hands before eating, or do not drink contaminated water, or eat junk food …. If public safety and public health (the desired consequences) do not improve, it is not fair, from this administrative efficiency perspective, to label public employees ‘unproductive’” (Kelly, 1988: 9)
The productivity of government employees must be measured against what they can control. However if citizens observe an increase in number of employees as well as resources allocated to them, they are justified in viewing government as being inefficient if the effects of such investments are not noticeable (Kelly, 1988).
The definition which is linked to the public sector is the one given by Hayward(1976) who defines productivity in government as:
… the efficiency with which resources are consumed in the effective delivery of public services. The definition implies not only quantity, but also quality” (Hayward, 1976: 544)
The definition of productivity in the public sector includes both efficiency and effectiveness. Hatry (1978) defines efficiency and effectiveness in the public sector as follows:
“Efficiency is the extent to which the government produces a given output with the least possible use of resources. Effectiveness indicates the amount of end product, the real service to the public,
Figure 2.1 Effect of Increase in Government Productivity. Adapted from (Hayward, 1976: 544)
For this research, effectiveness or performance is a much better term than productivity (see Section 2.2.2). This is because the research is looking at improvement in services provided by civil servants using available information and communications technology. The definition which is found to be appropriate is the one which Van-Reenen and Sadun (2006: 55) call labour productivity. They define it as the amount of output produced per hour worked. There will be lack of productivity if expectation of recipients of the service offered is not met.
The role of government is not necessarily to generate revenue, but to provide an environment which is conducive for businesses. This has been argued by Kelly (1988) who wrote:
“Whereas in business productivity is associated with success in the marketplace and, especially profitability; in government, where profitability is absent, productivity becomes harder to identify and measure” (Kelly, 1988: 1)
Hence the economic definition of productivity may not apply in this setting. This view has also been observed by Sugumaran and Arogyaswamy(2003: 79) who
Public Officer
Meet Customer needs Limited Resources
Increase In Government Productivity
Citizen
More Public Service Less Tax
Public Employee Job Security
Business
wrote that the traditional way of looking at performance as a ratio of input to output may not be adequate in information and communications technology environment. Productivity is easy to define for manual tasks. The ability to measure productivity for manual work was first brought by Taylor (1967) in theory of scientific management. Taylor (1967) argued that workers’ productivity can be improved by studying the process of doing work and reducing any redundancies. Today in the developed world manual work is almost 100% automated as observed by Ramirez and Nembhard (2004: 603). A new group of workers called knowledge workers (KWs) dominates the current labour force. As Ramirez and Nembhard (2004) pointed out the current economic drivers depend on knowledge work more than manual work; hence
“… the challenge today is not to increase manual worker’s
productivity but to measure and increase KW’s productivity” (Ramirez and Nembhard, 2004: 602).
Performance or productivity is difficult to measure when applied to the service industry. However they can be indirectly determined by the level of satisfaction of the people receiving the service. However performance of the Singapore Civil Service Computerisation Programme (CSCP) was quantified to be reduction or avoidance of some 5000 posts in government and
“…the government obtained a return of $2.8 dollars for every dollar
spent on IT in the CSCP” (NCB, 1992: 8).
Productivity can best be understood by studying the work of Edward Deming, the world wide management philosopher, well known for his work that built Japan from almost nothing after the Second World War to one of the most productive nations (Deming, 1986: vii). While economists like to measure productivity, unfortunately measures of productivity are
“like statistics on accidents: they tell you all about the number of accidents in the home, on the road, and at the work place, but they do not tell you how to reduce the frequency of accidents” (Deming, 1986: 15).
Productivity measurements only serve as comparison yard sticks. The most important thing is the action taken to address problem surrounding productivity.
using and producing sectors respectively. This was a comparison between the period 1990-1995 and 1995 – 2001 for USA. All the other sectors in the USA economy experienced a decline. The USA was found to be ahead of Europe where the same sectors experienced negative growth except for the ICT producing sectors(Van-Reenen and Sadun, 2006: 56).
At micro level, the impact of information technology was found to be difficult to determine as there are other non-IT investments which are difficult to control. Also the difference in firms and industry made evaluation of the impact of information to be problematic (Van-Reenen and Sadun, 2006: 57).
Increase in government productivity regardless of how it is measured benefit four main stakeholders namely, public officials, citizens, government employees and the business community (Hayward, 1976: 544). Figure 2.1 shows what each stakeholder benefits from increase in government productivity.
2.3
Results of Previous Studies
The problem of whether investments in information technology lead to any improvements in productivity has been researched and debated for a long time as discussed by Oz (2005: 789). Unfortunately a lot of these studies did not produce conclusive results, according to Sircar (2000: 69). The question of information technology investments and its impact on productivity has puzzled the research community for a long time; however organisations continue to increase their investments in information technology, despite not having any evidence that it leads to any positive returns. This has been referred to in literature as “IT productivity paradox” (Oz, 2005: 789).
An analysis of the information technology paradox by Mogotlhwane et al.(2006a) revealed that previous research showed the following:
• Measurement errors
• Adaptation strategy
• Effective use
• Type of business
2.3.1 Measurement errors
versa. The magnitude of the difference indicates the amount of productivity gain or loss.
The problem with evaluating the impact of information and communications technology is that it is almost impossible to isolate all the other input variables. In any organisation the input variables are many, including assets, human resource, information and communications technology etc. The problem of measurement was also highlighted by numerous researchers such as (Brynjolfsson, 1993) , (Anderson and Rust, 1997), (Strassman, 1997) etc.
2.3.2 Adaptation Strategy
Some research has revealed that it is how an organisation adapts information and communications technology that determines its effect (Bharadwaj, 2000),(Gates, 1999b). Adaptation strategy looks at the alignment of information and communications technology strategy and business strategy. The degree of miss-match can be an indicator of problems to come. This is because information and communications technology then becomes a burden that needs to be addressed along with daily demands of the business. The way around this is to get all stakeholders involved in the whole process from initiation to utilisation. Unfortunately organisations tend to rely heavily on external consultants. Often this does not work out well and may lead to increase in costs as observed by Collins and Simons (2006: 1).
2.3.3 Effective Use
Information and communications technology systems are often made with a lot of functionality incorporated. It is these that add to the price of the system. However, in reality, many people tend to use the bare minimum to get the work done. This was shown by the days of video recorders which could allow programming of television programmes well ahead of time, but few people often did so. An example that also shows lack of effective use is the current use of word processors merely as electronic type writers by majority of users. Lack of effective use has also been highlighted by other researchers like Sircar et al (2000) and Cron and Sobol (1983)
used it cannot benefit an organisation. In their research on perceived utilisation Fuerst and Cheney (1982: 554) also investigated age, education and user training as variables and found that user skills were the most important factors affecting usage. Snitkin and King (1986: 84) developed a model which showed that effective of use is a function of usage, user characteristics, application and system.
2.3.4 Type of Business
Some researchers have found that information and communications technology success depends on type of business (Quan et al., 2003), (Cron and Sobol, 1983). For organisations where the core business is routine in nature, such as banking, there is likely to be success. Chowdhury (2003) showed that information and communications technology was paying off in the banking industry. However with appropriate strategy, benefits can be realised in almost all business today as the technology has significantly improved.
Despite problems associated with measuring the impact of information technology, Singapore, one of the world leaders in information technology was able to determine the return on investments of information technology. The figure quoted by the National Computer Board of Singapore was almost “2.8
dollars for every dollar spent on information technology plan” (NCB 1992 as
quoted by (Choo, 1995).
The impact of information technology on productivity remains a problem that continues to be debated. Basden (2008: 32) has proposed a framework that uses Dooyeweerd’s philosophy to show that there are a set of beliefs that form the basis of evaluating information systems. Dooyeweerd’s philosophy argues that humans’ reactions to their reality can be explained by a set of beliefs such as economic, legal and ethical beliefs etc. (Basden, 2008: 65).
2.4
Maturity Models
2.4.1 Process-Based Maturity Models (ProsBMM)
Process-based maturity models looks at the development processes of an IT/IS system and its introduction all the way up to utilisation. These types of maturity models are ideal for software developers. As this research is not developing an IT system these models are not considered.
2.4.2 Product-Based Maturity Models (ProdBMM)
Product-based maturity models looks at the role of IT product in an organisation and how the organisation responds to this change. There are numerous ProdBMM that have been developed over time such as Nolan (1979), Bhabuta (1988) etc.
The (Nolan, 1979) model looks at utilisation of IT/IS system within an organisation. This model has been found to be the most appropriate maturity model for this study which looks at utilisation of IT systems in central government. Nolan’s model showed that IT expenditure and experience in managing IT were similar as they both exhibit the S shape (Earl, 1989: 30). The model is also not very difficult to use. The main limitation with Nolan’s model is that it is very old and needs to be updated.
2.4.3 General Practitioner IS (GPIS)
The general practitioner IS (GPIS) measurement model was developed by (Saleh and Alshawi, 2005). This model can be used to determine the readiness of an organisation before IS investments are made. It is a very good model that can guide managers in their IT investments. The GPIS model takes into consideration the following
• IT infrastructure
• People
• Process
• Work environment.
This study has not adopted this model because, in the case of Botswana, ICT investments have already been made, hence this might affect determining the pre-set criteria that the model required before investments are made.