Journal of Chemical and Pharmaceutical Research, 2014, 6(12):237-252
Research Article
ISSN : 0975-7384
CODEN(USA) : JCPRC5
Optimization of operating parameters for better performance and emission
using DICI engine operated with diesel-pungamia biodiesel blend
M. Venkatraman
1and G. Devaradjane
21Department of Mechanical Engineering, Aarupadai Veedu Institute of Technology, Paiyanoor, Chennai, Tamil
Nadu-India
2Department of Automobile Engineering, Anna University, MIT Campus, Chromepet, Chennai, Tamil Nadu-India
____________________________________________________________________________________________
ABSTRACT
The increase in number of automobiles in recent years has resulted in great demand for petroleum products. Vegetable oils might provide a viable alternative to diesel since they are renewable in nature and environmentally friendly. In the present investigation biodiesel was prepared from pungamia oil and blended with diesel. The prepared biodiesel blend of 20% was used for the present investigation. Tests were conducted in a single cylinder direct injection diesel engine fueled with 20% biodiesel blend for compression ratios of 19:1, 17:5 and 16:1,Injection timings of 27 °bTDC, 24°bTDC and 21°bTDC and Injection pressures of 240bar, 220bar and 200bar. From the detailed analysis of performance and emission characteristics, the optimized operating parameters such as compression ratio of 19:1, Injection timing of 27°bTDC and Injection pressure of 240 bar are identified for the diesel engine fueled with 20% biodiesel blend. For these optimized operating parameters ,highest brake thermal efficiency of (30.9%), lowest brake specific energy consumption of (11005 kJ / kW-hr) were observed .The heat release rate and harmful pollutants such as HC, CO are reduced in the 20% biodiesel blend compared to diesel fuel .At these optimized operating parameters emission of nitric oxide increases marginally for 20%biodiesel blend compared to diesel fuel .Finally it can be concluded that 20% biodiesel blend could be used as alternative fuel for optimized operating CI engine at compression ratio of 19:1, injection pressure of 240 bar and injection timing of 27ºbTDC for better engine performance and lower emissions. The results reveal that the pungamia biodiesel blend can be used safely without any modification to the engine.
Keywords: biodiesel; diesel engine; combustion; emissions; Pungam Methyl Esters,DICI direct injection
compression ignition.
____________________________________________________________________________________________
INTRODUCTION
investigators have used jatropha oil and pungamia oil methyl esters with various proportions as a CI engine fuel and the following conclusions have been made:Jatropha oil, diesel and their blends exhibited similar performance and emission characteristics under comparable operating conditions (Forson et.al, 2004).Pungamia oil methyl ester and their blends exhibited lower unburned hydrocarbon, carbon monoxide and soot emissions with a penalty of higher nitric oxide emission (Lakshminarayanan et.al, 2008)Jatropha methyl ester and its blends are a potential substitute for diesel. JTME produces lesser emissions than petroleum diesel, except NOx, and have satisfactory combustion and performance characteristics(Lakshminarayanan et.al, 2007)Improvement in performance characteristics and reduction in emissions were observed by preheating jatropha oil (Palaniswamy et al., 2006). A significant improvement in the performance and emissions was observed by optimizing the injector opening pressure, injection timing, injection rate and enhancing the swirl level when a diesel engine is to be operated with neat jatropha oil (Reddy and Ramesh, 2006).Performance and emission characteristics of JTME are superior when compared to other methyl esters produced from other feedstock. Peak pressure is higher for jatropha methyl ester compared to diesel (Sundarapandian and Devaradjane, 2005).Hsiang & Lin, 2007; Jo et al., 2006). The objective of the present study is to analyze the behavior of metal flow and to optimize the process parameters such as billet temperatures, bearing lengths (mandrel length), convex die angle and container temperature (tooling temperature) to yield good mechanical properties (Saidur et al. 2008).Most of the above research works are concentrated on performance and emission characteristics of PME and very limited work has been done to analyze the combustion characteristics. The present study investigates the combustion characteristics by highlighting their effect on performance and emission characteristics. This paper provides complete understanding and comprehensive analysis of the combustion, performance and emission characteristics of PME-diesel blends.15The objective of the project is to carryout experimental investigation on low heat rejection engine with raw jatropha oil, methyl ester of jatropha oil, methyl ester of jatropha oil–kerosene blend in the proportion of 70:30 and diesel. The results obtained indicate better performance and emission characteristics of the engine with methylester of jatropha oil.
EXPERIMENTAL SECTION
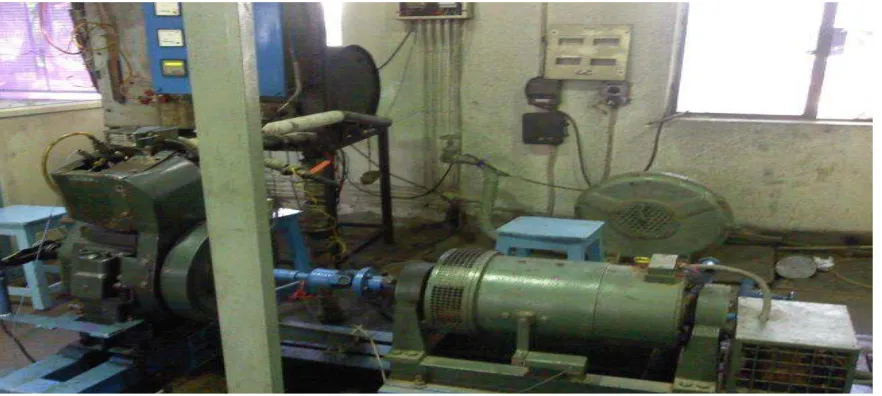
[image:2.595.80.521.471.669.2]Figure.1.shows the schematic line diagram of the experimental set up and its specification and operating ranges are given in Table .2.and Table.3. A Electrical dynamometer was used to apply the load on the engine. A water rheostat with an adjustable depth of immersion electrode was provided to dissipate the power generated. Tests were carried out at various loads starting from no load to full load condition at a constant rated speed of 1500 rpm.
Figure .1 Pictorial view of Experimental setup
At each load, the fuel flow rate various constituents of exhaust gases such aHydrocarbon (HC), carbon monoxide (CO) and nitrogen oxides (NOx), were measured with a 5-gas MRU Delta exhaust gas analyzer. The analyzer uses
measurement was by means of electrochemical sensors. Combustion analysis was carried out by means of an AVL 615 pressure pick-up fitted on the cylinder head and a TDC encoder fixed on the output shaft of the engine. The pressure and the crank angle signals were fed to a pentium personal computer. Various combustion parameters like heat release rate, cumulative heat release rate and peak pressure and its accurance were obtained using data acquisition system. The engine was first operated with diesel oil to generate the baseline data followed by Methyl Esters of pongamia oil and their blend such as PME20
.
TABLE.1.COMPARISON OF BIODIESEL PROPERTIES WITH DIESEL
Properties Diesel Pungamia Oil Bio-Diesel
(Methyl Ester)
Cetane No. 48– 56 47 57
Density(kg/m3) 821 934 892
Viscosity (cSt) 3.52 45.62 5.402
Calorific value (MJ/kg) 43 36.64 39.15
Flash point 0C 48 270 156
TABLE.2. SPECIFICATIONS OF ENGINE
Make Kirloskar
Model TAF 1
Type Direct injection, air cooled
Bore × Stroke (mm) 87.5 × 110
Compression ratio 17.5:1
Cubic capacity 0.661 lit
Rated power 4.4 KW
Rated speed 1500 rpm
Start of injection 24º bTDC
Connecting rod length 220 mm
Injector operating 220 bar
TABLE.3. OPERATING PARAMETERS CONSIDERED IN THE PRESENT INVESTIGATIONS
% Load 0,25,50,75,100
Speed (rev/min) 1500
Compression ratio 16:1,17.5:1,19:1
Injection Timing°bTDC 21,24,27
Injection Pressure(bar) 200,220,240
RESULTS AND DISCUSSION
Tests were carried out at different compression ratio, injection timing and injection pressure and its details are mentioned in Table.3. At injector opening pressure of 200bar and 220bar and injection timing of 21°bTDC and 24°bTDC and compression ratio of 17.5:1 and 16:1 were tried for PME20 but from the investigation it was found that the performance was very poor. Further the engine were set to run at higher compression ratio of 19:1,advanced injection timing of 27°bTDC and higher injector opening pressure of 240bar it arrives at the optimum range operating parameters PME20. It was observed that PME20 it gives better performance for the optimized operating parameters.
Figure.2.shows the effect of compression ratio on the variation of brake thermal efficiency with brake power for PME20. The maximum brake thermal efficiency obtained is about 30.9% for PME20 at compression ratio of 19:1.Increase in thermal efficiency is due to the increase in peak pressure and increases in combustion temperature. The other compression ratio of 16:1 and 17.5:1 offers relatively lower brake thermal efficiency than that of 19:1.
0 5 10 15 20 25 30 35
0 1 2 3 4 5
Brake Power(kW)
B
ra
k
e
T
h
er
m
a
l
E
ff
ic
ie
n
cy
(%
)
CR=16 CR=17.5 CR=19
Injection Timing =27°bTDC Injection Pressure=240bar CR=compression ratio
Figure.2.Effect of compression ratio on the variation of brake thermal efficiency with brake power
0 5 10 15 20 25 30 35
0 1 2 3 4 5
Brake Power (kW)
B
ra
k
e
T
h
er
m
a
l
E
ff
ic
ie
n
cy
(%
)
angle 21
angle 24
angle 27
CR=19:1
InjectionPressure=240bar angle=Injection Timing bTDC
Figure.3.Effect of injection timing on the variation of brake thermal efficiency with brake power
Figure.4.shows the effect of injection pressure on the variation of brake thermal efficiency with brake power for PME20.It was observed that the increase in brake thermal efficiency with increase in injection pressure may due finer spray and better entrainment.
Figure.5.shows the effect of compression ratio on the variation of brake specific energy consumption with brake power for PME20. From the results it is found that PME20 offers comparatively lower BSEC for compression ratio of 19:1 compare to other 16:1 and 17.5:1.This is due to better combustion of PME20 due to presence of high cetane of PME.
sufficient time to release heat, hence this particular timing offers lower BSEC compare to other injection timing 21°bTDC and 24°bTDC.
0 5 10 15 20 25 30 35
0 1 2 3 4 5
Brake Power(kW)
B
ra
k
e
T
h
er
m
a
l
E
ff
ic
ie
n
cy
(%
)
IP=200bar
IP=220bar
IP=240bar CR=19:1
Injection Timing=27° bTDC IP= Injection Pressure
Figure.4.Effect of injection pressure on the variation of brake thermal efficiency with brake power
0 5000 10000 15000 20000 25000
0 1 2 3 4 5
Brake Power(kW)
B
ra
k
e
S
p
ec
if
ic
E
n
er
g
y
C
o
n
su
m
p
ti
o
n
(k
J
/k
W
-h
r)
CR=16
CR=17.5
CR=19
Injection Timing =27°bTDC Injection Pressure=240bar CR=compression ratio
Figure.5.Effect of compression ratio on the variation of BSEC with brake power
Figure.7.shows the effect of injection pressure on the variation of brake specific energy consumption with brake power for PME20.It was observed that BSEC decreased with increase in injection pressure. The minimum BSEC was observed in PME20 at injection pressure 240bar whereas the maximum BSEC was obtained at injection pressure 200bar.This is due to finer spray, rapid heat release and shorter duration of combustion. Usually, finer spray and improved air entrainment cause lower BSEC for 240bar.
0 5000 10000 15000 20000 25000
0 1 2 3 4 5
Brake Power (kW)
B
ra
k
e
S
p
ec
if
ic
E
n
e
rg
y
C
o
n
su
m
p
ti
o
n
(
k
J
/k
W
-h
r)
angle 21 angle 24 angle 27
CR=19:1
InjectionPressure=240bar angle=Injection Timing bTDC
Figure.6.Effect of injection timing on the variation of BSEC with brake power
0 5000 10000 15000 20000 25000
0 1 2 3 4 5
Brake Power(kW)
B
ra
k
e
S
p
ec
if
ic
E
n
er
g
y
C
o
n
su
m
p
ti
o
n
(
k
J
/k
W
-h
r)
IP=200bar
IP=220bar
IP=240bar CR=19:1
Injection Timing=27° bTDC IP= Injection Pressure
Figure.7.Effect of injection pressure on the variation of BSEC with brake power
Figure.9.shows the effect of injection timing on the variation of cylinder pressure with crank angle for PME20.The change in injection timing changes the occurrence of peak pressure and combustion duration. The injection timing of 27°bTDC produces peak pressure few degree before TDC and utilizes the heat energy well before the completion of power stroke and hence the timing offers maximum peak pressure compare to other timing. This is the main reason for higher brake thermal efficiency of 27°bTDC.
0 10 20 30 40 50 60 70 80 90
-100 -80 -60 -40 -20 0 20 40 60 80 100
Crank Angle(deg)
C
y
li
n
d
er
P
re
ss
u
re
(b
a
r)
CR=16
CR=17.5
CR=19 Injection Timing =27°bTDC
Injection Pressure=240bar CR=compression ratio
Figure.8.Effect of compression ratio on the variation of cylinder pressure with crank angle
0 10 20 30 40 50 60 70 80 90
-100 -80 -60 -40 -20 0 20 40 60 80 100
Crank Angle(deg)
C
y
li
n
d
er
P
re
ss
u
re
(b
a
r)
angle 21
angle 24
angle 27 CR=19:1
InjectionPressure=240bar angle=Injection Timing bTDC
Figure.9.Effect of injection timing on the variation of cylinder pressure with crank angle
Figure.11.shows the effect of compression ratio on the variation of heat release rate with crank angle for PME20. It is seen that the height of premixed phase of combustion decreases with respect to increase in compression ratio. Also the compression ratio increases change the duration of combustion. Usually higher compression ratio offers shorter duration of combustion and cause better performance.
Figure.12.shows the effect of injection timing on the variation of heat release rate with crank angle for PME20. The injection timing of 27°bTDC offers comparatively shorter duration of combustion and produces peak heat release rate closer to diesel baseline operation. Hence this particular timing offers better performance compared to other injection timing of 21°bTDC and 24°bTDC.
0 10 20 30 40 50 60 70 80 90
-100 -80 -60 -40 -20 0 20 40 60 80 100
Crank Angle(deg)
C
y
li
n
d
er
P
re
ss
u
re
(b
a
r)
IP=200bar
IP=220bar
IP=240bar CR=19:1
Injection Timing=27° bTDC IP= Injection Pressure
Figure.10.Effect of injection pressure on the variation of cylinder pressure with crank angle
-100 -50 0 50 100 150
-20 -10 0 10 20
Crank Angle(deg)
H
ea
t
R
el
ea
se
R
a
te
(J
/C
A
)
CR=16
CR=17.5
CR=19 Injection Timing =27°bTDC
Injection Pressure=240bar CR=compression ratio
Figure.11.Effect of compression ratio on the variation of HRR with crank angle
Figure.14.shows the effect of compression ratio on the variation of cumulative heat release rate with crank angle for PME20. It is seen that the height of premixed phase of combustion decreases with respect to increase in compression ratio. Also the compression ratio increases change the duration of combustion. Usually higher compression ratio offers shorter duration of combustion and cause better performance.
Figure.15.Shows the effect of injection timing on the variation of cumulative heat release rate with crank angle for PME20. The injection timing of 27°bTDC offers comparatively shorter duration of combustion and produces peak heat release rate closer to diesel baseline operation. Hence this particular timing offers better performance compare to other injection timing of 21°bTDC and 24°bTDC.
-80 -60 -40 -20 0 20 40 60 80 100
-20 -10 0 10 20
Crank Angle(deg)
H
ea
t
R
e
le
a
se
R
a
te
(J
/C
A
)
angle 21
angle 24
angle 27 CR=19:1
InjectionPressure=240bar angle=Injection Timing bTDC
Figure.12.Effect of injection timing on the variation of HRR with crank angle
-80 -60 -40 -20 0 20 40 60 80 100
-20 -10 0 10 20
Crank Angle(deg)
H
ea
t
R
el
ea
se
R
a
te
(J
/C
A
)
IP=200bar
IP=220bar
IP=240bar CR=19:1
Injection Timing=27° bTDC IP= Injection Pressure
Figure.13.Effect of injection pressure on the variation of HRR with crank angle
Figure.17.Shows the effect of compression ratio on the variation of hydrocarbon with brake power for PME20. It was observed that the maximum rate of hydrocarbon is 35ppm for compression ratio at 19:1.It is also found that the hydrocarbon of 0.112 g/kW-hr for compression ratio at 17.5:1decreases with increase in concentration of the biodiesel blend. This may be due to improved combustion because of increased in injection pressure and advanced injection timing.
Figure.18.Shows the effect of injection timing on the variation of hydrocarbon with brake power for PME20. It was observed that the maximum rate of hydrocarbon is 0.129g /kW-hr for injection timing at 27deg bTDC.It is also found that the hydrocarbon of 0.122g /kW-hr for injection timing at 24deg bTDC decreases with increase in concentration of the biodiesel blend. This may be due to improved combustion because of increased in injection pressure and increase in compression ratio.
biodiesel blend. This may be due to improved combustion because of increased in compression ratio and advanced injection timing.
-200 0 200 400 600 800 1000 1200 1400 1600
-40 -20 0 20 40 60 80 100
Crank Angle(deg)
C
u
n
u
la
ti
v
e
H
ea
t
R
el
e
a
se
R
a
te
(J
/C
A
)
CR=16
CR=17.5
CR=19
Injection Timing =27°bTDC Injection Pressure=240bar CR=compression ratio
Figure.14.Effect of compression ratio on the variation of CHRR with crank angle
-200 0 200 400 600 800 1000 1200 1400 1600
-40 -20 0 20 40 60 80 100
Crank angle(deg)
C
u
m
u
la
ti
v
e
H
ea
t
R
el
ea
se
R
a
te
(J
/C
A
)
angle 21
angle 24
angle 27
CR=19:1 InjectionPressure=240bar angle=Injection Timing bTDC
Figure.15.Effect of injection timing on the variation of CHRR with crank angle
Figure.20.Shows the effect of compression ratio on the variation of carbon monoxide with brake power for PME20. It was noticed that CO emission of 0.968g/kW-hr for compression ration at 19:1.CO emissions decreases with increase in JME in the blend had sufficient time for combustion process because of advanced injection pressure.
Figure.21.Shows the effect of injection timing on the variation of carbon monoxide power for PME20. It was noticed that CO emission of 1.343g/kW-hr for injection timing 27deg bTDC because due to presence of oxygen in the biofuel.CO emissions decreases with injection timing at 21deg bTDC of 0.948 g/kW-hr.
-200 0 200 400 600 800 1000 1200 1400 1600
-40 -20 0 20 40 60 80 100
Crank Angle(deg)
C
u
m
u
la
ti
v
e
H
ea
t
R
el
ea
se
R
a
te
(J
/C
A
)
IP=200bar
IP=220bar
IP=240bar
CR=19:1
Injection Timing=27° bTDC IP= Injection Pressure
Figure.16.Effect of injection pressure on the variation of CHRR with crank angle
0.02 0.04 0.06 0.08 0.1 0.12 0.14 0.16
0 1 2 3 4 5
Brake Power(kW)
H
y
d
ro
ca
rb
o
n
(
g
/k
W
-h
r)
CR=16
CR=17.5
CR=19 Injection Timing =27°bTDC
Injection Pressure=240bar CR=compression ratio
Figure.17.Effect of compression ratio on variation of Hydrocarbon with Brake Power
Figure.23.Shows the effect of compression ratio on the variation of nitric oxide brake power for PME20. It can be observed that NOx emissions increases for PME20 49.3g/kW-hr at compression ratio 19:1 compare to compression ratio at 16:1 42.1g/kW-hr.Due to the advancement of compression ratio and pressure all the injected fuel burnt as a result higher combustion temperature is attained. The higher temperature promotes NOx formation.
Figure.24.Shows the effect of injection timing on the variation of nitric oxide brake power for PME20. It can be observed that NOx emissions increases for PME20 43.9g/kW-hr at injection timing 27deg bTDC compare to injection timing at 21deg bTDC 21.05g/kW-hr.This is due to the advancement of injection timing and pressure all the injected fuel burnt as a result higher combustion temperature is attained.The higher temperature promotes NOx formation.
0 0.02 0.04 0.06 0.08 0.1 0.12 0.14 0.16 0.18 0.2
0 1 2 3 4 5
Brake Power(kW)
H
y
d
r
o
ca
rb
o
n
(g
/k
W
-h
r
)
angle21
angle24
angle27 CR=19:1
InjectionPressure=240bar angle=Injection Timing bTDC
Figure.18. Effect of injection timing on the variation of hydrocarbon with brake power
0 0.02 0.04 0.06 0.08 0.1 0.12 0.14 0.16 0.18 0.2
0 1 2 3 4 5
Brake Power(kW)
H
y
d
ro
ca
rb
o
n
(g
/k
W
-h
r)
IP=200bar
IP=220bar
IP=240bar CR=19:1
Injection Timing=27° bTDC IP= Injection Pressure
0.1 0.3 0.5 0.7 0.9 1.1 1.3 1.5
0 1 2 3 4 5
Brake Power(kW)
C
a
rb
o
n
M
o
n
o
x
id
e(
g
/k
W
-h
r)
CR=16 CR=17.5 CR=19 Injection Timing =27°bTDC
Injection Pressure=240bar CR=compression ratio
Figure.20. Effect of Compression ratio on the variation of Carbon monoxide with Brake Power
0.1 0.3 0.5 0.7 0.9 1.1 1.3 1.5
0 1 2 3 4 5
Brake Power(kW)
C
a
rb
o
n
M
o
n
o
x
id
e(
g
/k
W
-h
r)
angle=21
angle=24
angle=27
CR=19:1
InjectionPressure=240bar angle=Injection Timing bTDC
0.1 0.6 1.1 1.6 2.1
0 1 2 3 4 5
Brake Power(kW)
C
a
rb
o
n
M
o
n
o
x
id
e(
g
/k
W
-h
r)
IP=200bar IP=220bar IP=240bar CR=19:1
Injection Timing=27° bTDC IP= Injection Pressure
Figure.22. Effect of Injection pressure on the variation of Carbon monoxide with Brake Power
0 10 20 30 40 50 60 70
0 1 2 3 4 5
Brake Power(kW)
N
it
ri
c
O
x
id
e(
g
/k
W
-h
r)
CR=16
CR=17.5
CR=19 Injection Timing =27°bTDC
Injection Pressure=240bar CR=compression ratio
0 10 20 30 40 50 60 70
0 1 2 3 4 5
Brake Power(kW)
N
it
ri
c
O
x
id
e(
g
/k
W
-h
r)
angle=21 angle=24 angle=27 CR=19:1
InjectionPressure=240bar angle=Injection Timing bTDC
Figure.24.Effect of Injection timing on the variation of Nitric oxide with Brake Power
0 10 20 30 40 50 60 70
0 1 2 3 4 5
Brake power(kW)
N
it
ri
c
O
x
id
e(
g
/k
W
-h
r)
IP=200bar
IP=220bar
IP=240bar CR=19:1
Injection Timing=27° bTDC IP= Injection Pressure
Figure.25. Effect of injection pressure on the variation of injection Nitric oxide with brake power
CONCLUSION
Following are the conclusions based on the experimental results obtained while operating single cylinder diesel engine fuelled with PME20.The maximum brake thermal efficiency (30.9%) is found to be PME20 injection timing at 27ºbTDC, Injection pressure at 240bar and compression ratio at 19:1.
Due to the advancement of injection timing, injection pressure and compression ratio all the injected fuel burnt as a result higher combustion temperature is attained. The higher temperature promotes NOx (1535ppm) formation.
Good mixture formation and lower smoke emission are the key factors for good CI engine performance.
Finally it can be concluded that PME20 could be used as alternative fuel for operating CI engine at compression ratio of 19:1, higher injector opening pressure of 240 bar and advanced injection timing of 27ºbTDC for better engine performance and lower emissions.
Acknowledgement
We thank the management of Sri Venkateswara College of Engineering for providing us with the necessary experimental setup to perform this research
REFERENCES
[1]Avinash kumar Agarwal and Deepak Agarwal (2007) Applied Thermal Engineering 2314-2323. [2]Forson F.K.and E.Hammond-Donkoh (2004) Renewable Energy 1135-1145.
[3]Hellgardt K. and Patterson, (2006) SAE 2006-01-0234.
[4]Kumar, M.S., Ramesh.A. Nagalingam.B.,(2003). Biomass and Bioenergy 25(3):309-318. [5]Lakshminarayanarao G. and K.Rajagopal(2007) Int Journal of Green Energy 2007.
[6]Lakshminarayanarao G. and K.Rajagopal(2008) Int Journal of Global Energy Issues. 29:314-328. [7]Pramanik,K.(2003). Renewable Energy 28:239-248.
[8]Sahoo P.K. and L.M.Das “(2009) Fuel 994-999.
[9]Reddy, J.N., Ramesh.A(2006). Renewable Energy 31:1994-2016.
[10]Sundarapandian.S., Devaradjane.G.,(2005).Experimental investigation of the performance of vegetable oil operated C.I.Engine.Proceedings of the 19th National conference on I.C.Engines and combustion.New Delhi Allied Publishers Private Limited,87-94.
[11]Palaniswamy, E., Manjula, P., Manoharan, N. (2006). Effects of Pre-Heating of Jatropha Curcas Oil on Performance and Emission Characteristics of C.I. Engines. Proceedings of the International Conference on Resource Utilisation and Intelligent Systems, New Delhi:Allied Publishers Private Limited, 315–319.
[12] Hasanuzzaman, M., Saidur, R., Ali, M., Masjuki, H.H. 2007. International Journal of Mechanical and
Materials Engineering, 2(2), 109-117