Journal of Chemical and Pharmaceutical Research, 2017, 9(10):125-132
Research Article
CODEN(USA) : JCPRC5
ISSN : 0975-7384
125
Polyelectrolyte Induced Metachromasy: Effect of Binding Sites
R Nandini
*Department of Chemistry MITE, Moodabidri, Karnataka, India
_____________________________________________________________________________
ABSTRACT
The interaction of a cationic dye namely, Methylene blue (MB) with anionic polyelectrolytes, namely, sodium carboxymethyl cellulose (NaCMC) and Sodium heparinate has been investigated by spectrophotometric technique. The polymers induced metachromasy in the dye resulting in the shift of absorption maxima of the dye towards shorter wavelengths. The stability of the complex formed between MB and NaCMC was found to be lesser than that formed between MB and NaHep. This fact was further confirmed by reversal studies using alcohols, urea and electrolytes. The interaction parameters revealed strong binding between MB-Na Hep complexes. The number of binding sites was found to affect metachromatic shift and other interaction parameters. Among the two polyelectrolytes, NaHep has a greater number of binding sites, hence dye aggregation was found to be greater in MB-NaHep complex than in MB-NaCMC complex.
Keywords: Metachromasy; Methyleneblue; Anionic polyelectrolytes; Aggregation; Binding sites
_____________________________________________________________________________
INTRODUCTION
126
MATERIALS AND METHODS
Methylene Blue (Acros Media) were used without further purification. Methanol, ethanol and propanol were obtained from (Merck, India) and were distilled before use. Sodium laurylsulphate and Sodium dodecyl benzene sulphonate (Lobachemie, India) were used as received. Sodiumcarboxymethyl cellulose was obtained from (BDH,UK) and Sodium heparinate was obtained from (Lobachemie, India). The spectral studies were carried out using Shimadzu UV-2550 spectrophotometer.
Determination of Stoichiometry and Interaction Parameters of Polymer-Dye Complexes
The equivalent weight of NaCMC sample was determined using standard methods and it was found to be 222 g. The equivalent weight of NaHep sample was determined using conductometric titration method and it was found to be 178 g [12-14].
Preparation of Dye and Polymer Solutions
The stock solutions of the various dyes were made in 100 ml volumetric flasks using distilled water. The stock
solutions of polymers of concentration 1 × 10⁻² M was made in 100 ml volumetric flask considering the equivalent
weights of the polymer.
Preparation of Electrolyte and Surfactant Solutions
The stock solutions of concentration 0.1 M were made in 100 ml volumetric flasks using distilled water. Appropriate
amount of these solutions were used to obtain concentrations in the range 0.01M-1 × 10⁻⁸ M in various experiments.
Preparation of Urea Solution
The stock solution of concentration 9 M was made in 100 ml volumetric flasks using distilled water. Appropriate amount of this stock solution were used to obtain concentrations in the range 1-8 M in various experiments.
Preparation of Polymer-Dye Solutions for Studying Reversal of Metachromasy
For the study of reversal of metachromasy, solutions containing polymer and dye in a fixed ratio, which exhibited
highest shift, were made. Generally 0.5 ml of 1 × 10⁻³ M dye solution and appropriate amount of polymer
solution(0.0-0.9 ml of 1 × 10⁻² M) solution were mixed in 10 ml volumetric flask and appropriate amounts of
alcohols, NaCl (0.1 M), urea (9 M), or surfactant (0.1 M) were added and the solution was made up to 10 ml with distilled water.
Determination of Thermodynamic Parameters
The thermodynamic parameters of interaction are determined as follows:
Solutions containing different amounts of polymer samples (1, 2, 4 and 5 ml × 10-3 M) and fixed amount of dye
solution (0.5 ml, 1 × 10⁻³ M) were made up to 10 ml in different volumetric flasks and the solutions were
equilibrated and the readings were measured at 4 different temperatures, 36°C, 42°C, 48°C and 54°C. The
absorbances were measured at both monomeric and metachromatic band. Absorbance results were treated using
Rose-Drago Equation [15]
CD.Cs/ (A-A0) = 1/(KcL (DS- D)) + Cs/(L (DS- D))
Where;
CD is the the initial molar concentration of the dye.
Cs is the molar concentration of the polymer.
A is the absorbance of the polymer-dye complex at the metachromatic band. Ao is the absorbance of the pure dye at the metachromatic band.
DS is the molar extinction coefficient of the polymer-dye complex.
Dis the molar extinction coefficient of the dye.
At each temperature the value of Kc was obtained from the slope and intercept of the plot of CDCs/A-A0 against CS at
each temperature studied.
Kc= Slope/(Intercept). The free energy change (G), enthalpy change (H) and entropy change (S) associated with
complex formation between dye and the polymer were calculated using the standard expressions, G = -RTlnKc;
127
RESULTS AND DISCUSSION
The spectra of pure Methylene blue (MB) dye, shows an absorption maxima at 628 nm. When Sodium carboxy methylcellulose solution is added to the above dye solutions, the spectra shows a blue shift, which occurs at 555 nm in case MB-NaCMC complex and at 528 nm in case of MB-NaHep complex. The reason for the blue shift being, the aggregation of dye molecules on the polymer backbone as reported by [16,17]. The results are shown in Figures 1 and 2
450 500 550 600 650 700
-0.2 0.0 0.2 0.4 0.6 0.8 1.0 1.2 1.4 1.6
A
b
s
o
rb
a
n
c
e
Wavelength(nm)
[image:3.612.212.400.164.323.2]P/D=0.0 P/D=0.5 P/D=1.0 P/D=2.0 P/D=4.0 P/D=5.0
Figure 1: Absorption spectra of MB-NaCMC
400 450 500 550 600 650 700
0.0 0.2 0.4 0.6 0.8 1.0 1.2 1.4
A
b
s
o
rb
a
n
c
e
Wavelength(nm)
[image:3.612.214.397.340.510.2]P/D=0.0 P/D=0.2 P/D=0.5 P/D=1.0 P/D=2.0 P/D=5.0 P/D=8.0
Figure 2: Absorption spectra of MB-NaHep
Stoichiometry
128
1 2 3 4 5 6
0.2 0.3 0.4 0.5 0.6 0.7 0.8
AMeta
/A
M
on
o
P/D ratio
[image:4.612.220.393.71.220.2]MB-NaCMC MB-NaHep
Figure 3: Stoichiometry of polymer-dye complexes
Effect of Alcohols and Urea on Metachromasy
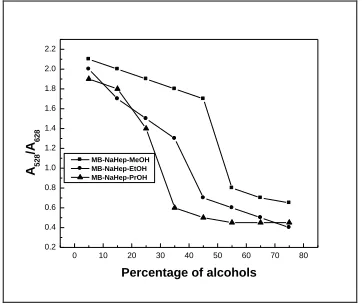
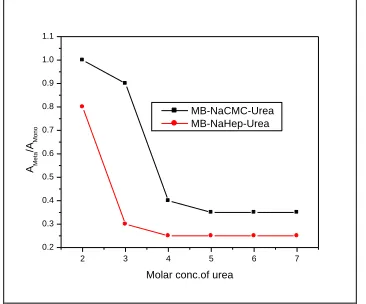
When alcohols such as Methanol, ethanol and 2-propanol were added to case of MB-NaCMC and MB-NaHep complexes the metachromatic bands disappeared and the bands of the pure dyes reappeared. This is due to breaking of the polymer-dye complex and release of pure dye in the solution. These observations indicated the involvement of hydrophobic forces in the polymer-dye complex formation. Further it was also observed that as the hydrophobic chain length of alcohols increases the reversal becomes quicker. Our observations matches well with that reported in the literature [20,21]. The results are shown in Figures 4-6 respectively.
10 20 30 40 50 60 70
0.2 0.4 0.6 0.8 1.0 1.2
AM
eta
/A
M
on
o
[image:4.612.216.396.325.480.2]Percentage of alcohols MB-NaCMC-MeOH MB-NaCMC-EtOH MB-NaCMC-PrOH
Figure 4: Effect of alcohols on MB-NaCMC system
0 10 20 30 40 50 60 70 80
0.2 0.4 0.6 0.8 1.0 1.2 1.4 1.6 1.8 2.0 2.2
A528
/A
628
Percentage of alcohols
MB-NaHep-MeOH MB-NaHep-EtOH MB-NaHep-PrOH
[image:4.612.216.397.502.654.2]129
2 3 4 5 6 7
0.2 0.3 0.4 0.5 0.6 0.7 0.8 0.9 1.0 1.1
AMeta
/A
M
on
o
[image:5.612.216.399.73.225.2]Molar conc.of urea MB-NaCMC-Urea MB-NaHep-Urea
Figure 6: Effect of urea on Polymer-dye systems
Effect of Electrolytes
On adding the electrolytes NaCl/KCl to the MB-NaCMC and MB-NaHep complexes them etachromatic band disappears and the original monomeric band reappears. The reason behind this being, the change in conformation of polymer from extended conformation before adding dye to compact coil conformation on binding with the dye. The reversal of metachromasy on addition of electrolytes indicates the involvement of electrostatic forces in polymer-dye interaction. These observations have been supported by literature reports of [22]. The results are depicted in Figures 7 and 8.
1x10⁻⁸M 1x10⁻⁷M 1x10⁻⁶M 1x10⁻⁵M 1x10⁻⁴M 1x10⁻³M 1x10⁻²M 0.3
0.4 0.5 0.6 0.7 0.8 0.9 1.0 1.1 1.2
A555
/A
628
Molar concentration of electrolytes
[image:5.612.212.400.334.491.2]MB-NaCMC-NaCl MB-NaCMC-KCl
Figure 7: Effect of electrolytes on MB-NaCMC system
0.1 1x10⁻³ 1x10⁻⁴ 1x10⁻⁵ 1x10⁻⁶ 1x10⁻⁷
0.2 0.4 0.6 0.8 1.0 1.2
AM
eta
/AM
on
o
[image:5.612.213.399.501.673.2]Molar conc.of electrolytes MB-NaHep-NaCl MB-NaHep-KCl
130
Effect of Surfactants
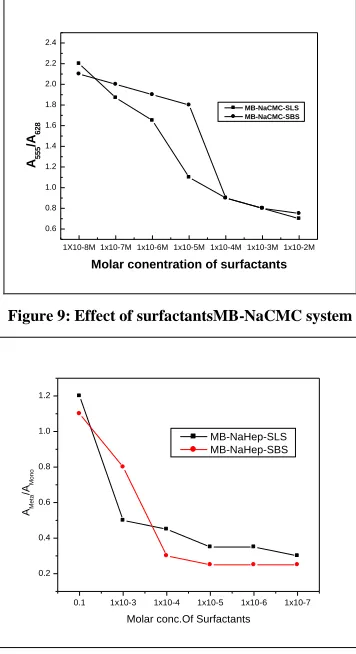
On adding surfactants to MB-NaCMC and MB-NaHep complexes the polymer interacts with the oppositely charged surfactant molecules and releases the free dye into the solution, as a result the monomeric band of the dye reappears. This is due to the interaction between anionic sites of the polymer with the surfactant thereby releasing the free dye into the solution, which indirectly indicates the involvement of electrostatic forces involved in polymer-dye binding. Morover as the chain length of the surfactant increases, the reversal became quicker, thus indicating that hydrophobic forces also play a vital role in polymer-surfactant interaction These facts were also supported by reports from [23-25]. Figures 9 and 10 shows the effect of surfactants.
1X10⁻⁸M 1x10⁻⁷M 1x10⁻⁶M 1x10⁻⁵M 1x10⁻⁴M 1x10⁻³M 1x10⁻²M 0.6
0.8 1.0 1.2 1.4 1.6 1.8 2.0 2.2 2.4
A555
/A
628
Molar conentration of surfactants
MB-NaCMC-SLS MB-NaCMC-SBS
Figure 9: Effect of surfactantsMB-NaCMC system
0.1 1x10⁻³ 1x10⁻⁴ 1x10⁻⁵ 1x10⁻⁶ 1x10⁻⁷
0.2 0.4 0.6 0.8 1.0 1.2
AM
eta
/A
M
on
o
[image:6.612.217.396.167.317.2]Molar conc.Of Surfactants MB-NaHep-SLS MB-NaHep-SBS
Figure 10: Effect of surfactantsMB-NaHep system
Determination of Interaction Parameters
The interaction between the polymer-dye were studied at various temperatures ranging from 309K-327K and the
interaction constant Kc and other thermodynamic parameters namely, G, H and S were evaluated as mentioned
[image:6.612.216.394.169.496.2]earlier. The negative value of ∆H indicates the exothermic nature of polymer-dye interaction. Also the negative value of ∆S indicates an orderly arrangement of ions. The results are given in Table 1.
Table 1: Thermodynamic parameters of Polymer-dye systems
System Temp (K) KC(dm3mol-1) GkJ.mol-1 kJ.mol-1 J.mol-1
MB-NaCMC
309 6218 -22.4
315 5415 -22.6 -23.5 -33.3
321 4321 -22.3
327 3785 -23.7
309 7315 -22.8 -20.2 -38.3
MB-NaHep 315 6512 -23
321 5423 -23.5
131
Effect of Binding Sites
The structures of sodium carboxymethyl cellulose and Sodium heparinate are given below:
O OH
OH
H
H
CH2
H
H OH
H
O CH2
COONa
O
H O
H H
OH
H CH2
OH H O CH2
COONa
O
O OH
OH
H
H
CH2
H
H OH
H
O CH2
[image:7.612.140.471.92.330.2]COONa n-2
Figure 11: Structure of NaCMC
Figure 12: Structure of NaHep
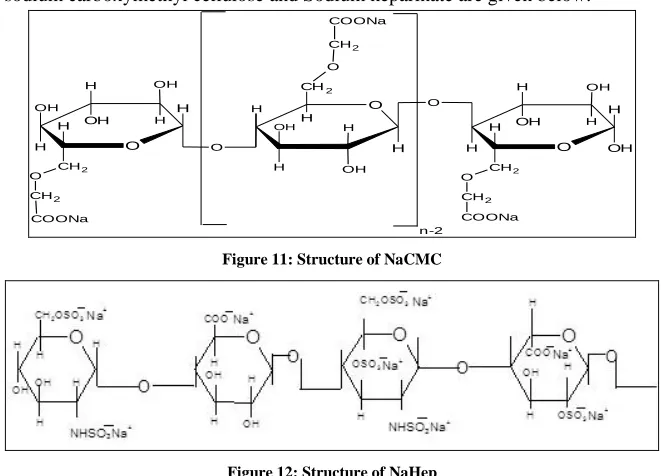
On comparing the above structures, it is evident that for heparin there are two binding sites (Figures 11 and 12), namely carboxylate and sulphate groups, whilst sodium carboxy methyl cellulose contains only carboxylate groups. Hence, binding between heparin Methylene Blue and is stronger than in the case of Methylene Blue and sodium carboxymethyl cellulose. These facts are further confirmed by the interactions constants and other interaction parameters.
CONCLUSION
From the present investigation it can be concluded that both the anionic polyelectrolytes, namely, NaCMC and NaHepinduced metachromasy in the dye Methylene Blue. The extent of metachromasy induced by in Sodiumheparinate was greater than that by Sodium carboxymethyl cellulose. Thisis evident in the extent of blue shift which is 100 nm in case of MB-NaHep complex and 73 nm in case of MB-NaCMC complex. The above fact is also confirmed by the interaction constants which are higher for MB-NaHep complex than that for MB-NaCMC
complex. Further it was also found that the number of bindingsites also influences metachromasy.
REFERENCES
[1] A Mitra; RK Nath; S Biswas; AK Chakraborty; AK Panda; A Mitra. J Photochrem Photobiol A: Chem. 1997,
111, 157.
[2] A Mitra; AK Chakraborty. J Photochem Photobiol A: Chem. 2006, 178, 98.
[3] GR Seely; RR Knots. Carbohydrate Polymer.1983, 3, 109.
[4] M Shirai; T Nagatsuka. M Tanaka. Makromol Chem. 1977, 178, 37.
[5] M Shirai; Y Nagaoka; M Tanaka. Makromol Chem. 1977, 178, 1633.
[6] M Shirai; Y Murakami; M Tanaka. Makromol Chem.1977, 178, 2141.
[7] M Shirai; T Nagatsuka; M Tanaka. Makromol Chem. 1978, 179, 173.
[8] M Shirai; M Yamashita; M Tanaka. Makromol Chem. 1978,179, 47.
[9] M Shirai; T Nagatsuka; M Tanaka. J Polym Sci: Polym Chem Ed. 1977, 5, 283.
[10] S Otsuki; K Adachi. Polymer J.1993, 25, 1107.
[11] S Ghosh; SP Moulik. Can J Chem. 1981, 59, 2449.
[12] ED Eyler Klug; F Depnis. Anal Chem.1947, 19, 24.
[13] B Casu; U Gennaro. Carbohydrate Res.1975, 39, 1.
132
[15] NJ Rose; RS Drago. J Am Chem Soc.1959, 81, 6138.
[16] S Basu; AK Gupta; KK Rohatgi-Mukherjee. J Indian Chem Soc.1982, 59, 578.
[17] MK Pal; MJ Schubert. Histochem Cytoche.1961, 9, 673.
[18] MK Pal; BK Ghosh. Macromol Chem.1980, 181, 1459.
[19] MK Pal; BK Ghosh. Macromol Chem. 1979, 180, 959.
[20] HS Frank; AS Quist. J Chem Phys. 1961, 34, 604.
[21] E Rabinowitch; LF Epstein. J Am Chem Soc. 1941, 63, 6938.
[22] JS Tan; RL Schneider. J Phys Chem.1975, 79, 1380.
[23] R Konradi; J Ruhe. Macromolecule. 2005, 38, 6140.
[24] MA Villeti; R Borsali; JS Crespo; V Soldi; K Fukada. Macromol Chem Phys. 2004, 205, 907.