Research Article
CODEN(USA) : JCPRC5
ISSN : 0975-7384
Optimization spectrophotometric determination of phosphor in soil and
compost mixture
Refilda Suhaili*, Jumeili Zoni Sudarnisa and Yefrida
Department of Chemistry, Faculty of Mathematics and Natural Sciences, Andalas University, Padang, 25163, Indonesia
_____________________________________________________________________________________________
ABSTRACT
Determination of phosphor in soil and compost mixtures by spectrophotometric method has been optimized. The method in this study was based on the formation of molybdenum blue complex by ammonium heptamolybdate as complexing and potassium antimonyltartarate to increase the intensity of the blue color. The optimum condition were found at solution pH 2, the wavelength 725 nm, complex stability for 10 minutes. Standard calibration curve obtained from the regression equation y = 0.349x + 0.006, with R2 0.995 for n = 3. Phosphor content in the mixtures of soil containing 0.3648 % phosphorand compostthat made from green yard waste with EM4 as activatorwas evaluated by variating mixture composition and incubation time.The highest phosphor content obtained 0.4165% in the composition of soil : compost 0.4 : 0.6 w/w with incubation time for 45 days.
Keywords: Compost, phosphor, soil, spectrophotometric method
_____________________________________________________________________________________________
INTRODUCTION
The use of inorganic fertilizer/chemical fertilizers continuously without control will hardened soil structure and land damaged [1]. Rehabilitation by adding organic matter to the soil was very efficient to recover land damaged [2] .
Compost can be given as the resource of additional nutrients to restore soil fertility. It should be given in sufficient quantities, so that plants can grow better. Compost is like multivitamins for the soil and plants will improve soil physical and chemical properties. Hard soil will become more loose, poor soil will be fertile, acid soils will become more neutral. Some element that is contained by the compost is nitrogen, phosphorus, calcium, potassium and magnesium [3].
The use of organic materials is currently getting a lot of attention from various circles. According to Singh. (1993), organic matter can increase the cation exchange capacity, the ability of nutrients and water, the activity of microorganisms, as well as a variety of other soil properties. Organic acids can effectively decrease the toxicity of Al to form a complex with Al, thereby increasing the availability of P, which is one of the important nutrient in plant growth [4-6].
EXPERIMENTAL SECTION Equipment and Materials
The equipments were used in this study: a set of UV-Vis spectrophotometer (Genesys 20, Thermo Scientific), analytical balance (Kern & Sohn GmbH), pH meter (Lovibond Senso Direct), hot plate and glassware. While the materials were: soil taken from its own grounds, compost from green waste yard, nitric acid (HNO3) p.a, hydrogen
peroxide (H2O2) p.a, sulfuric acid (H2SO4) p.a, potassium dihydrogen phosphate (KH2PO4), ammonium tetrahydrate
heptamolybdate ((NH4)6Mo7O24.4H2O), antimonyltartarate potassium (K(SBO)C4H4O6.½H2O), ascorbic acid
(C6H8O6), hydrochloric acid (HCl ) 0.01 M, nitric acid (HNO3) 0.1 M, filter paper, and distilled water.
Reagents Preparation
Nitric Acid 0.1 M, Chloride Acid Solution 0.01 M, Phosphorus Standard Solution 1000 mg / L, 10 mg / L were prapared by dilution and complexing reagen was prapered by weighing as much as 12 g Ammonium Heptamolybdate, add 50 mL of H2SO4 p.a and 0.2270 g of potassium antimonyltartarate then diluted in 500 mL
volumetric flask with distilled water and homogenized. As much as 250 mL of this solution was added 1.0600 g of ascorbic acid incorporated into the 1000 mL volumetric flask, then diluted with distilled water and homogenized [8] .
Sample Preparation
Preparation of Compost from Organic Yard Waste
Compost was prapered from organic yard waste such as dried leaves and fresh leaves that have been separated from a tree branch. The leaves were cut with a smaller size and homogenized, 50 kg of organic yard waste was poor with water until the leaves were wet. About 50 mL EM4 and 50 mL palm sugar solution (1 kg in 500 mL) were added and stirred, put into the composter, closed and stirred once a week until the compost pruduced. After harvest, sifted compost and compost obtained smooth .
Preparation of Composition Variation of Soil and Compost Mixture
Soil and compost were mixed with variation of the composition of the soil : compost (1:0; 0.8:0.2; 0.6:0.4; 0.4:0.6; 0.2:0.8; 0:1) in a plastic cup with a total weight of 50 g. The sample was incubated with the variation of time (0; 15; 30; 45; 60 and 75) days and watering every morning.
Sample Destruction
All samples were destructed byinserted each sample 0.5 g into the Kjeldahl flask. Then added 5 mL of HNO3 pa, 0.5
mL of H2O2and allowed 30 minutes to react completly and then heated with a heating mantle until the yellow runs
and the solution became clear, let it cool and filtered to obtain the extract clear. Then adjusted the pH to 2 by using a solution of NaOH or HCl, and then diluted to the appropriate volume of 50 mL with 0.01 M HCl.
Determination of Water Content in Soil and Compost Mixture
Water contained in soil and compost mixture were determined by gravimetric methode. The sample was weighed 1.0002 g at vaporizer cup. Then heated in an oven for ± 2 hours at temperature 1050 C until constant weight was found.
Optimum Condition Determination of Phosphorus by Spectrophotometric Method
Optimum conditions of Phosphor determination by spectrophotometric method were evaluated by determining maximum wavelength, effect of pH solution, effect of time, effect of potassium antimonyltartarate concentration and effect of ammonium heptamolybdate concentration on molybdenum blue complex stability.
Determination of Phosphorus Content in Soil and Compost Mixture Preparation of Standard Phosphorus Calibration Curve
Phosphorus standard solution was prepared with concentrations (0; 0.1; 0.2; 0.3; 0.4; 0.5; 1.0 and 2.0) mg/L at pH 2. Each standard solution of 1 mL was added with 9 mL of complexing reagents contained ammonium heptamolybdate and potassium antimonyltartarate 0.0194 M and 0.0014 M. Then left for 10 minutes and absorbance was measured by UV-Vis spectrophotometer at a wavelength of 725 nm.
Determination of phosphor in Samples
RESULTS AND DISCUSSION
Maximum Absorption
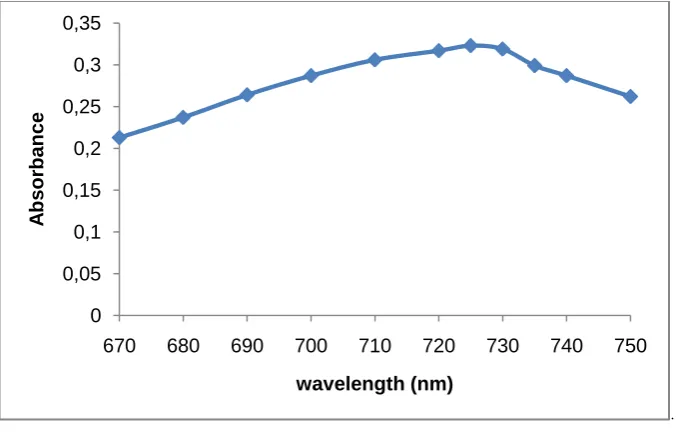
The absorbance of phosphomolybdate was measured atrange of wavelenght 670-750 nm by UV-Vis spectrophotometer, Figure 1 showed that the maximum wavelength at 725 nm.
[image:3.595.138.480.152.369.2].
Figure 1. Absorption curve of phosphomolybdate complex solution at a wavelength of 670-750 nm. 1 mL of phosphate standard solution of 10 mg/L, 9 mLcomplexing reagent
Absorbance value at a wavelength of 670-725 nm increased. But with increasing wavelength above 725 nm the absorbance decreased. So from the above data shows that the maximum wavelength obtained at a wavelength of 725 nm which is evidenced from the highest absorbance value.
Effect of Time on the Stability of Molybdenum Blue Complex
Determination of the effect of time on the stability of the complex carried out on the variation of time (0; 5; 10; 15; 20; 25; 30; 35; 40; 45; 50) minutes and the results can be seen in Figure 4.2.
[image:3.595.146.467.492.692.2].
Figure 2.Curve of time effect onthe Stability of Molybdenum Blue Complex.
Description: 1 mL of phosphate standard solution of 10 mg/L, 9 mLcomplexing reagent (ammonium heptamolybdate 0.0097 M and 0.0007 M potassium antimonyltartarate). Wavelength 725 nm.
Figure 2 indicated that the absorbance from 0-10 minutes increased slightly and after that it tend to stabile. From the curve can be concluded that the stability of phosphomolybdate complex was high and can be measured at long range
0 0,05 0,1 0,15 0,2 0,25 0,3 0,35
670 680 690 700 710 720 730 740 750
Ab
sor
b
an
ce
wavelength (nm)
0 0,1 0,2 0,3 0,4 0,5 0,6
0 5 10 15 20 25 30 35 40 45 50 55
Ab
sor
b
an
ce
Effect of Potassium Antimonyltartarate Concentration on the Stability of Molybdenum Blue Complex
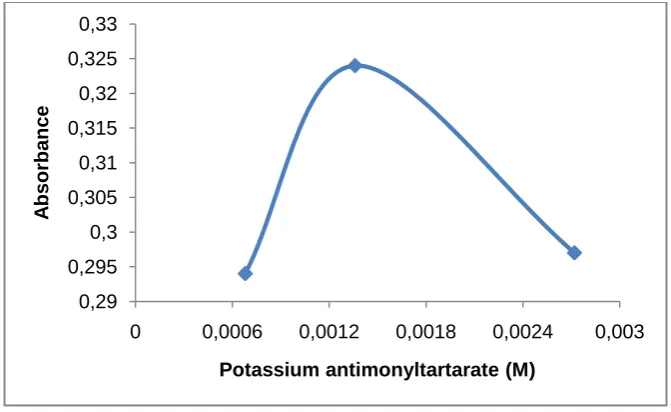
The complexing agent used was a mixture of ammonium heptamolybdate 0.0097 M with potassium antimonyltartarate (0.0007 ; 0.0014 ; 0.0027 M) were measured with a UV- Vis spectrophotometer at a wavelength of 725 nm .
[image:4.595.137.473.140.346.2].
Figure 3. Curve of Effect Potassium AntimonyltartarateConcentration onthe Stability of Molybdenum Blue Complex. Description: 1 mL of phosphate standard solution of 10 mg/L,9 mL of complexing reagents ammonium heptamolybdate (0.0097 M) and
potassium antimonyltartarate ( 0.0007 ; 0.0014 ; 0.0027 M ), for 10 minutes at wavelength725 nm.
From the variation of the concentration of potassium antimonylartarate, at a concentration of 0.0014 M has the highest absorbance value which indicateed that the stable molybdenum blue complex was performed and gave the maximum absorbance.
Effect of Ammonium Concentration on the Stability of Molybdenum Blue Complex.
Determination of the maximum concentration of ammonium heptamolybdate to perform the stability of molybdenum blue complex with phosphateby using various of concentration of ammonium heptamolybdate (0.0097; 0.0121; 0.0146; 0.0170; 0.0194; 0.0218 M) with potassium antimonyltartarate 0.0014 M as complexing reagent, which is measured with UV - Vis spectrophotometer at a wavelength of 725 nm. Result can be seen in Figure 4 .
.
Figure 4. Curve of Ammonium HeptamolybdateConcentration effect on the Stability of Molybdenum Blue Complex. Description: 1 mL of phosphate standard solution of 10 m /L,9 mL of complexing with the concentration of complexing reagents (ammonium heptamolybdate 0.0097; 0.0121; 0.0146; 0.0170; 0.0194; 0.0218 M andpotassium antimonyltartarate 0.0014 M), for 10
minutes at wavelength 725 nm.
0,29 0,295 0,3 0,305 0,31 0,315 0,32 0,325 0,33
0 0,0006 0,0012 0,0018 0,0024 0,003
Ab
sor
b
an
ce
Potassium antimonyltartarate (M)
0,1 0,125 0,15 0,175 0,2 0,225 0,25 0,275 0,3 0,325 0,35
0 0,005 0,01 0,015 0,02 0,025
A
b
sor
b
an
ce
[image:4.595.142.471.508.702.2]From Figure 4. The highest absorbance was obtained at a concentration of 0.0194 M. At that concentration, ammonium heptamolybdate performed a stable complex. This is evidenced from the molybdenum blue color is formed so clear. On the other hand at concentration bellow 0.0194 M the complex was uncomlitely performed,while the concentration of 0.0218 M the suspension was performed that interfered in the measurement. Therefore heptamolybdate ammonium concentration used was 0.0194 M, which reached maximum absorption.
Effect of pH onthe Stability of Molybdenum Blue Complex.
The effect of pH to performed the stable complex of molybdenum blue was determined by varying the pH 2; 3; 4; 5 and 6 of standard solution, from that variation only solution with pH 2 produced molybdenum blue color, whereas at pH 3; 4; 5 and 6 did not form complex. The blue color indicated that fosfomolybdate and well known as molybdenum blue complex.
To make sure the optimum pH that produced stable complex, a series of phospate solution with pH 1.5; 2; 2.5 and 3 reacted with complexing reagent and the results can be seen in Figure 5.
[image:5.595.110.540.238.466.2].
Figure 5. Curve of pH Effect on the Stability of Molybdenum Blue Complex.
Description: 1 mL of phosphate standard solution of 10 mg/L pH 1.5; 2; 2.5; 39 mL with a concentration of complexing reagent (ammonium heptamolybdate 0.0194 M and potassium antimonyltartarate 0.0014 M) for 10 minutes at wavelength 725 nm.
From Figure 5. the highest absorbance value wasat pH 2 This is because phosphomolybdate complex formed at pH 2 with blue color. At pH 1.5 and 2.5 the blue color of the solution was not very clear, because of the fosfomolybdate complex formed was not stable. Whereas at pH 3 did not form a blue color. This proved that the complex formation of phosphomolybdate (molybdenum blue) stable at pH 2
Phosphor Content in Soil and Compost Mixtures
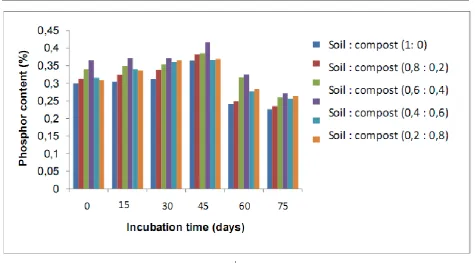
Determination of phosphorus in soil and compost mixture by spectrofotometry was done under optimum conditions with concentration of complexing agent (ammonium heptamolybdate and potassium antimonyltartarate 0.0194 M and 0.0014 M), pH 2, complex stability for 10 minutes and wavelength of 725 nm. Phosphor content in samples were calculated by using regression equation y = 0.349x + 0.006 with R2 = 0.995.
Figure 6. showed that the phosphorus content in each of the various time 0; 15; 30; 45; 60; 75 days had high levels of phosphorus and increased significantly with the addition of time. However, the highest phosphorus levels could be seen in the composition of the soil: compost 0.4 : 0.6 v/v 0.4165 % within 45 days and decreased at 60-75 days. Higa and Kinjo (1989) [20] stated that the vailability of P can be utilized effectively and efficiently by the plant for several weeks.
0 0,05 0,1 0,15 0,2 0,25 0,3 0,35 0,4
0 0,5 1 1,5 2 2,5 3 3,5
A
b
sorban
ce
.
Figure 6. The content of phosphorus in the soil and compost mixture with a variety of time and composition
Description: 1 mL of destructed samples pH 2 was added 9 mL complexing reagents (ammonium heptamolybdate and potassium antimonyltartarate 0.0194 M and 0.0014 M), complex stability 10 minutes at a wavelength of 725 nm.
CONCLUSION
Phosphorus levels in mixture of the soil containing 0.3648 % and compost containing 0.3691 % phosphorus had the highest content 0.4165 % in the composition of the soil: compost 0.4 : 0.6 w/w within 45 days incubation time. On this composition compost could increase the phosphorus content in soil about 0.05 %.
REFERENCES
[1] L. Bass, T.E. Bilderback, M.A. Powell, A Guide to Managing Organic Yard Wastes, North Carolina Coorperation Extension Service, 2014.
[2] J.C. Hargreaves, M.S. Adl and P.R. Compost Science & Utilization, 2009, 17, 2, 85-94.
[3] H.O Buckman and N.C Brady, The Nature and Properties of Soil. Mac. Milan Publishing Co. Inc Newyork,
1982
[4] C.P. Singh and D.S. Ruhal, Journal of the Indian Society of Soil Science, 1993, 41:443-446. [5] Cannon, J. P., E. B. Allen, L. M. Dudley and J. J. Jurinak. Ecologia, 1995, 102:265-272.
[6] Bhatti, J. S., N. B. Comerforddan C. T. Johnston, Soil Science Society of America, 1998, 62:1089-1095. [7] Y.Anita, Determination of Macro Nutrient content (N, P, K) in the compost made from Green yards waste
and Its Effect on the Growth of Tomato (Solanumlycopersicum Mill), Essay, Chemistry Department, Andalas University: Padang, 2013.
[8] Walinga, I., et al, Plant Analysis Procedurs, Part 7, Netherlands: Wageningen Agricultural University, 1989, Page 138-139.