International Journal of Emerging Technology and Advanced Engineering
Website: www.ijetae.com (ISSN 2250-2459, ISO 9001:2008 Certified Journal, Volume 3, Issue 6, June 2013)
316
High Voltage Direct Current Back to Back System with
Capacitor Commutated Converter
Priyanka Agrawal
1, Shruti Mishra Tiwari
21
M.E student, Power System, S.S.C.E.T, Bhilai
2 Sr. Assistant Professor,Electrical Department, S.S.C.E.T, Bhilai.
Abstract— This paper present the new control technique for HVDC back to back system, conventional line commutated converter (LCC) based HVDC system has difficulties to be connected to very weak ac systems so recently developed capacitor commutated converter (CCC) technology has shown to be more advantageous in many aspects.
Keywords— HVDC back to back, Line Commutated Converter, Capacitor Commutated Converter, control technique.
I. INTRODUCTION
The use of fast HVDC controls to stabilize a transmission system, gains more and more importance as today’s power systems are operated closer to their stability limits. Therefore, there is an increasing need to understand the dynamic interactions between HVDC converters and the ac systems. However, the analysis of HVDC converter systems is challenging because of their hybrid nature, as they incorporate both continuous-time dynamics and discrete events. When two systems operate at different frequencies (such as 50 Hz and 60 Hz), or even when they operate at the same nominal frequency but have divergent frequency control regimes, the only practical way to transmit power between them is by means of a dc
connection. The first high voltage direct current system
was designed by a French engineer, Ren´e Thury, at the end of the 19th century [1].
II. HIGH VOLTAGE DIRECT CURRENT
The first commercial HVDC transmission system built with mercury arc valves was a link between the Swedish mainland and the island of Gotland. The system began
service in 1954 and transmitted 20 MW at 100 kV over a
distance of 96 km through a single-conductor cable, with return path through the sea and earth. Later systems had ratings as high as 1854 MW at 463 kV such as Bipole 1 of the Nelson River HVDC transmission system in Manitoba, Canada, which was installed between 1970 and 1977 and transmits dc power over a distance of 900 km [3]. About 1955, a new solid-state switching device called thyristor was developed [4].
The thyristor was soon capable of handling the high voltages and powers required for HVDC transmission and began to replace the mercury arc valves. The first HVDC project with the new thyristor valves was again Gotland, commissioned in 1970. The voltage of these first converters was only 50 kV (6 pulse monopole), but since then the
highest ratings have grown to •+_600 kV, 6300 MW
(Itaip´u, built 1984– 1987, two 12 pulse bipoles) [5]. The
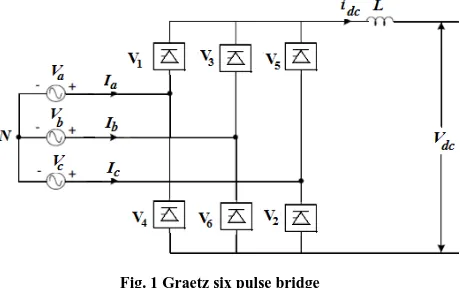
[image:1.612.334.564.414.558.2]basic module of a conventional HVDC converter using mercury-arc or thyristor valves is the three-phase, full-wave bridge circuit shown in Fig. 1, also known as a Graetz-bridge. Compared with several possible alternative configurations, this circuit provides the best utilization of the converter transformer and the lowest voltage across non-conducting valves [1], [2].
Fig. 1 Graetz six pulse bridge
Control Topologies
1. Series-compensated commutation
International Journal of Emerging Technology and Advanced Engineering
Website: www.ijetae.com (ISSN 2250-2459, ISO 9001:2008 Certified Journal, Volume 3, Issue 6, June 2013)
317
However, the negative impact of lower commutation impedance results in additional stresses on the valves and transformers and additional cost implications. The first CCC back-to-back converter station (2 x 550 MW) has been put into service at Garabi, on the Brazilian side of the Uruguay River.[R]
2. Voltage-source converters (VSC)
The use of self commutation with the new generation devices (i.e., GTOs and IGBTs) has resulted in the topology of a voltage-source converter (VSC) as opposed to the conventional converter using ordinary thyristors and current-source converter (CSC) topology. The VSC, being self-commutated, can control active=reactive power, and with PWM techniques, control harmonic generation as well. The switching losses and ratings of available devices presently limit the application of such circuits. The ongoing advances in power electronic devices are expected to have a major impact on the application of this type of converter on HVDC transmission.[R]
The conventional line commutated converter (LCC) based HVDC system has difficulties to be connected to very weak ac systems. The installed HVDC systems in world are with gradually reduced losses and costs, line-commutated converter (LCC) systems using thyristor valves. The recently developed capacitor commutated converter (CCC) technology has shown to be more advantageous in many aspects [1–4]. However, the conventional line-commutated HVDC technology has an inherent weakness, i.e., the commutation of the converter valves is dependent on the stiffness of the alternating voltage. The converter cannot work properly if the connected ac system is weak. Substantial research has been
performed in this field [5–9]. The most outstanding
contribution on this subject is [5], which recommends to use short-circuit ratio (SCR) as a description of the strength of the ac system relative to the power rating of the HVDC
link.Both [8] and [9] conclude that, for ac systems with an
SCR lower than 1.5, synchronous condensers have to be installed to increase the short-circuit capacity of the ac system.
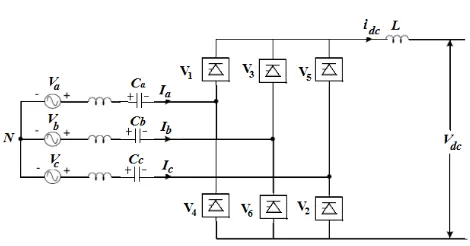
[image:2.612.328.563.146.269.2]III. CAPACITOR COMMUTATED CONVERTER
Fig. 2 Capacitor Commutated Converter
The CCC is characterized by having capacitors inserted in between the converter transformer and the converter valves. Thus, this capacitor is in series with the leakage impedance of the transformer and the main valves. This has a two-fold effect: The capacitor provides a forced commutation facility to the main valves, and the capacitor compensates for the leakage inductance (or reactive power
demand) of the converter transformer. Sizing of the
commutation capacitor, therefore, becomes a very important criteria as it impacts on the above two effects. A too-small capacitor will cause a large overvoltage across the capacitor (and valves), and not compensate sufficiently for the leakage inductance to result in a lagging current drawn from the ac bus. A too-large capacitor will result in low over voltages and over-compensate for the demanded reactive power and might even draw a leading current from the ac system
The capacitor voltage Vc is directly proportional to the
dc current Idc the (fixed) time t of conduction of the valve
and inversely proportional to the size of the capacitor C i.e.
Vc = (Id*t/C) Since Vc increases with this results in an
International Journal of Emerging Technology and Advanced Engineering
Website: www.ijetae.com (ISSN 2250-2459, ISO 9001:2008 Certified Journal, Volume 3, Issue 6, June 2013)
318 A. Control technique for HVDC back to back
The control principles for the rectifier and inverter converter depicted in Figure 3. The new control principle to be used for the operation of the inverter-side converter of the HVDC transmission is based on the ability of the CCC to control the exchange of reactive power with the AC network from the AC terminal of the converters, and by doing that controlling the alternating voltage of the converter bus. The new proposed control scheme for the inverter includes the following control loops: A main control loop that gives the inverter operation with constant alternating voltage (the controller uses the alternating voltage measured at the filter bus); Transiently, a direct-current controller can be selected (normally the rectifier controls the direct current, but during transients like disturbances in the connected AC network, the direct-current controller at the inverter can be selected to recover the HVDC transmission link from the fault); Transient operation of the inverter-side converter can also be made with constant commutation margin, when the calculated commutation margin is lower than a minimum reference, to avoid commutation failures;
[image:3.612.52.285.476.552.2]It should be stressed that the new control scheme is particularly suitable with the CCC. When properly sizing the commutating capacitor it allows the converter to generate or absorb reactive power from the connected AC system, making it possible to appropriately control the alternating voltage at the commutating bus.
Fig. 3 Control technique for HVDC back to back [13]
B. Minimum and maximum extinction angle as a function of direct current and operating voltage
To control the alternating voltage of the connected AC system the HVDC converter uses its internal output rating capability of maximum generation and absorption of reactive power. The maximum reactive power generation capability is determined by the operation at minimum extinction angle. To reduce the risk of frequent commutation failures this parameter is normally set not lower than 18 degrees. The value is chosen depending on
the characteristics of the connected system network.
The maximum reactive power absorption capability of the converter is a function of transmitted power and system alternating voltage level. The limitation factors are: the converter valves stresses when operating at too high angles and level of the voltage across the valves.
IV. SIMULATION IN PS-CAD&RESULTS
PSCAD/EMTDC is a powerful electromagnetic
transient’s simulation program [18]. It is most suitable for time domain simulations of the systems. It is an industry standard simulation tool . The graphical interface of the software makes it very easy to build the circuit and observe the results in within a single integrated environment. Due to the presence of the graphical interface the time for the development of the program is drastically reduced [18]. PSCAD/EMTDC uses subsystems, which breaks the whole job into smaller units and makes the understanding easy. In EMTDC there the user can write his own program, which best suits, his simulation and integrate it to the main
program. The PSCAD® graphical user interface greatly
enhances the power and usability of the simulation environment. It allows the user to efficiently construct a circuit schematic, run a simulation, analyze the results, and manage the data in a completely integrated graphical environment. PSCAD® provides intuitive and interactive control input, meters, and online plotting functions and graphs. PSCAD® has been adopted worldwide by utilities, manufacturers, research & educational institutions, and consultants as the premier tool for transient simulation.
HVDC Back To Back system with CCC-
1) During normal condition-
a) Rectifier side Voltage graph
Plot shows 120V dc voltage at rectifier side.
SE : Graphs
Time S 0.0 1.0 2.0 3.0 4.0 5.0 ...
... ... 0
20 40 60 80 100 120 140 160
V
o
lt
a
g
e
(
kV
)
[image:3.612.324.575.545.680.2]dcVoltage Rec
International Journal of Emerging Technology and Advanced Engineering
Website: www.ijetae.com (ISSN 2250-2459, ISO 9001:2008 Certified Journal, Volume 3, Issue 6, June 2013)
319 b) Inverter side Voltage graph
Due to back to back system the inverter side also has 120V dc voltage.
RE : Graphs
Time S 0.0 1.0 2.0 3.0 4.0 5.0 ...
... ... 0
20 40 60 80 100 120 140 160
V
o
lt
a
g
e
(
k
V
)
[image:4.612.323.580.152.310.2]dcVoltage Inv
Fig. 4b Inverter side voltage graph
c) per unit voltage graph at rectifier and inverter side
Blue colour graph show per unit value of voltage at rectifier side & green colour graph shows per unit value of voltage at inverter side, both having value of 1.00 pu.
SE,RE : Graphs
Time S 0.0 1.0 2.0 3.0 4.0 5.0 ...
... ... 0.00
0.20 0.40 0.60 0.80 1.00 1.20
V
o
lt
a
g
e
(
p
u
)
[image:4.612.48.297.180.314.2]Vpu_R Vpu_I
Fig. 4c Per unit voltage graph at rectifier and inverter side
d) Machine angle graph
Plot shows machine angle graph of synchronous generator.
SE : Graphs
Time S 0.0 1.0 2.0 3.0 4.0 5.0 ...
... ... 0
20 40 60 80 100 120 140
d
e
g
(
d
e
g
)
M/CAngle
Fig. 4d Machine angle graph
e) Rotor speed graph
Plot shows system with CCC is having constant rotor speed
SE : Graphs
Time S 0.0 1.0 2.0 3.0 4.0 5.0 ...
... ... 376.875
376.900 376.925 376.950 376.975 377.000 377.025 377.050 377.075 377.100
ra
d
/s
e
c
[image:4.612.47.297.384.503.2]Rotor Speed
Fig. 4e Rotor speed graph
2) During fault condition at inverter side-
a) Rectifier side and inverter side voltage graph
During single line to ground fault at 2.1second for 0.05second a small voltage fluctuation occur at that time period on both side.
Dc voltage at rectifier side
SE : Graphs
Time S 0.0 1.0 2.0 3.0 4.0 5.0 ...
... ... 0
20 40 60 80 100 120 140 160
V
o
lt
a
g
e
(
kV
)
dcVoltage Rec
Fig. 5a Rectifier side voltage graph
Dc voltage at inverter side
RE : Graphs
Time S 0.0 1.0 2.0 3.0 4.0 5.0 ...
... ... 0
20 40 60 80 100 120 140 160
V
o
lt
a
g
e
(
kV
)
dcVoltage Inv
[image:4.612.324.588.408.544.2] [image:4.612.323.582.564.697.2] [image:4.612.47.296.569.679.2]International Journal of Emerging Technology and Advanced Engineering
Website: www.ijetae.com (ISSN 2250-2459, ISO 9001:2008 Certified Journal, Volume 3, Issue 6, June 2013)
320 b) per unit voltage graph at rectifier and inverter side
Graph show inverter side has a sag in voltage during fault condition.
SE,RE : Graphs
Time S 0.0 1.0 2.0 3.0 4.0 5.0 ...
... ... 0.00
0.20 0.40 0.60 0.80 1.00 1.20
V
o
lt
a
g
e
(
p
u
)
[image:5.612.47.302.178.305.2]Vpu_R Vpu_I
Fig. 5b Per unit voltage graph at rectifier and inverter side
c) Machine angle graph
Machine angle doesn’t has any effect during fault condition
SE : Graphs
Time S 0.0 1.0 2.0 3.0 4.0 5.0 ...
... ... 0
20 40 60 80 100 120 140
d
e
g
(
d
e
g
)
[image:5.612.323.579.188.337.2]M/CAngle
Fig. 5c Machine angle graph
d) Rotor speed graph
Plot show damping oscillation during fault time thus transient state occurs & the system become unstable for that period.
SE : Graphs
Time S 0.0 1.0 2.0 3.0 4.0 5.0 ...
... ... 376.875
376.900 376.925 376.950 376.975 377.000 377.025 377.050 377.075 377.100
ra
d
/s
e
c
Rotor Speed
Fig. 5d Rotor speed graph
HVDC Back To Back system without
CCC-1) During normal condition-
a) Rectifier side Voltage graph
Plot shows 120V dc voltage at rectifier side
SE : Graphs
Time S 0.0 1.0 2.0 3.0 4.0 5.0 ...
... ... 0
20 40 60 80 100 120 140 160
V
o
lt
a
g
e
(
kV
)
[image:5.612.48.302.363.513.2]dcVoltage Rec
Fig. 6a Rectifier side voltage graph
b) Inverter side Voltage graph
Due to back to back system the inverter side also has 120V dc voltage.
RE : Graphs
Time S 0.0 1.0 2.0 3.0 4.0 5.0 ...
... ... 0
20 40 60 80 100 120 140 160
V
ol
ta
ge
(
kV
)
[image:5.612.325.585.386.513.2]dcVoltage Inv
Fig. 6b Inverter side voltage graph
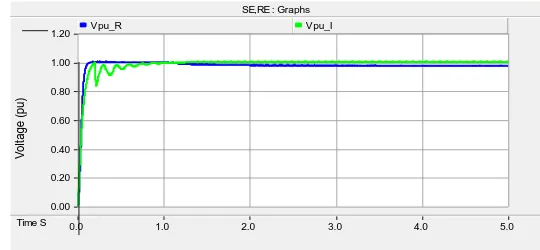
c) per unit voltage graph at rectifier and inverter side
Blue colour graph show per unit value of voltage at rectifier side & green colour graph shows per unit value of voltage at inverter side, both having value of 1.00 pu.
SE,RE : Graphs
Time S 0.0 1.0 2.0 3.0 4.0 5.0 ...
... ... 0.00
0.20 0.40 0.60 0.80 1.00 1.20
V
o
lt
a
g
e
(
p
u
)
Vpu_R Vpu_I
[image:5.612.48.301.576.704.2] [image:5.612.319.589.578.703.2]International Journal of Emerging Technology and Advanced Engineering
Website: www.ijetae.com (ISSN 2250-2459, ISO 9001:2008 Certified Journal, Volume 3, Issue 6, June 2013)
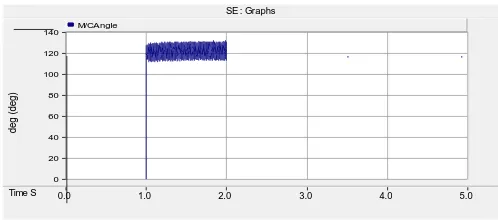
321 d) Machine angle graph
Plot shows machine angle graph of synchronous generator.
SE : Graphs
0.0 1.0 2.0 3.0 4.0 5.0 ...
... ... 0
10 20 30 40 50 60 70 80
d
e
g
(
d
e
g
)
[image:6.612.325.584.149.285.2]M/CAngle
Fig. 6d Machine angle graph
e)
Rotor speed graphPlot shows system without CCC is not having constant rotor speed
SE : Graphs
Time S 0.0 1.0 2.0 3.0 4.0 5.0 ...
... ... 376.875
376.900 376.925 376.950 376.975 377.000 377.025 377.050 377.075 377.100
ra
d
/s
e
c
Rotor Speed Rotor Speed
Fig. 6e Rotor speed graph
2) During fault condition at inverter side-
a) Rectifier side and inverter side voltage graph
During single line to ground fault at 2.1second for 0.05second a small voltage fluctuation occur at that time period on both side.
Dc voltage at rectifier side
SE : Graphs
Time S 0.0 1.0 2.0 3.0 4.0 5.0 ...
... ... 0
20 40 60 80 100 120 140 160
V
o
lt
a
g
e
(
k
V
)
[image:6.612.48.297.173.314.2]dcVoltage Rec
Fig. 7a Rectifier side voltage graph
Dc voltage at inverter side
RE : Graphs
Time S 0.0 1.0 2.0 3.0 4.0 5.0 ...
... ... 0
20 40 60 80 100 120 140 160
V
o
lt
a
g
e
(
kV
)
[image:6.612.324.582.315.450.2]dcVoltage Inv
Fig. 7b Inverter side voltage graph
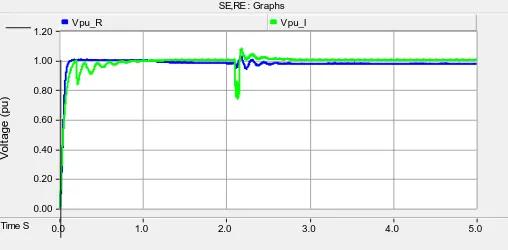
b) per unit voltage graph at rectifier and inverter side
Graph show inverter side has a sag in voltage during fault condition.
SE,RE : Graphs
Time S 0.0 1.0 2.0 3.0 4.0 5.0 ...
... ... 0.00
0.20 0.40 0.60 0.80 1.00 1.20
V
o
lt
a
g
e
(
p
u
)
Vpu_R Vpu_I
[image:6.612.49.293.360.497.2] [image:6.612.327.581.506.631.2]International Journal of Emerging Technology and Advanced Engineering
Website: www.ijetae.com (ISSN 2250-2459, ISO 9001:2008 Certified Journal, Volume 3, Issue 6, June 2013)
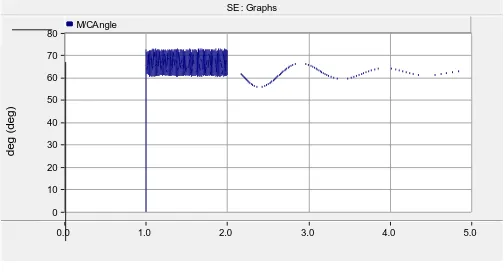
322 c) Machine angle graph
Machine angle was unstable due to fault in the case of system without CCC
SE : Graphs
0.0 1.0 2.0 3.0 4.0 5.0 ...
... ... 0
10 20 30 40 50 60 70 80
d
e
g
(
d
e
g
)
[image:7.612.324.584.126.273.2]M/CAngle
Fig. 7d Machine angle graph
d) Rotor speed graph
Plot shows during faulty condition the damping oscillation is more & the system is unstable.
SE : Graphs
Time S 0.0 1.0 2.0 3.0 4.0 5.0 ...
... ... 376.875
376.900 376.925 376.950 376.975 377.000 377.025 377.050 377.075 377.100
ra
d
/s
e
c
Rotor Speed Rotor Speed
Fig. 7e Rotor speed graph
e) Rotor speed of the back to back system with CCC & without CCC-
Plot shows that during faulty condition swing is more in the system without CCC as compared to system with CCC. And also transient state in the system with CCC is only during faulty period but in another case it is unstable.
SE : Graphs
Time S 0.0 1.0 2.0 3.0 4.0 5.0 ...
... ... 375.80
376.00 376.20 376.40 376.60 376.80 377.00 377.20 377.40 377.60 377.80
ra
d
/s
e
c
[image:7.612.48.300.179.315.2]Rotor Speed Rotor Speed
Fig.7f Rotor speed of the system with CCC & without CCC
V. CONCLUSION
From the result it was conclude that the HVDC back to back system with CCC is better than system with LCC in terms of stability. Because at faulty condition in back to back system with CCC there is very less swing in rotor speed and system was unstable only during fault period but with LCC the system become unstable. Thus stability is more in HVDC back to back system with Capacitor Commutated Converter.
REFERENCES
[1] ―VSC transmission,‖ Cigr´e Working Group B4.37-269, Tech. Rep., 2005.
[2] G. Asplund, K. Eriksson, and H. Jiang, ―DC transmission based on voltage source converters,‖ in Cigr´e Colloquium on HVDC and FACTS, South Africa, 1997.
[3] M. Durrant, H.Werner, and K. Abbott, ―Model of a VSC HVDC terminal attached to a weak ac system,‖ in IEEE Conference on Control Applications, Istanbul, 2003.
[4] P. Fischer, ―Modelling and control of a line-commutated HVDC transmission system interacting with a VSC STATCOM,‖ Ph.D. dissertation, Royal Institute of Technology, Stockholm, Sweden, 2007.
[5] S. Johansson, G. Asplund, E. Jansson, and R. Rudervall, ―Power system stability benefits with VSC DC-transmission systems,‖ in Cigr´e Conference B4-204, Paris, France, 2004.
[image:7.612.47.300.371.528.2]International Journal of Emerging Technology and Advanced Engineering
Website: www.ijetae.com (ISSN 2250-2459, ISO 9001:2008 Certified Journal, Volume 3, Issue 6, June 2013)
323 [7] ―IEEE guide for planning DC links terminating at AC locations
having low shortcircuit capacities,‖ IEEE Std 1204-1997, Tech. Rep., 1997.
[8] B. Franken and G. Andersson, ―Analysis of HVDC converters connected to weak systems,‖ IEEE Trans. Power Syst., vol. 5, no. 1, pp. 235–242, February 1990.
[9] A. Gavrilovic, ―AC/DC system strength as indicated by short circuit ratios,‖ in AC/DC Power Transmission International Conference, London, 1991.
[10] O. B. Nayak, A. M. Gole, D. G. Chapman, and J. B. Davies, ―Dynamic performance of static and synchronous compensators at an HVDC inverter bus in a very weak ac system,‖ IEEE Trans. Power Syst., vol. 9, no. 3, pp. 1350–1358, August 1994.
[11] D. Jovcic, N. Pahalawaththa, and M. Zavahir, ―Investigation of the use of inverter control strategy instead of synchronous condensers at inverter terminal of an HVDC system,‖ IEEE Trans. Power Delivery, vol. 15, no. 2, pp. 704–709, April 2000.
[12] D. Jovcic, L. A. Lamont, and L. Xu, ―VSC transmission model for analytical studies,‖ in IEEE Power Engineering Society General Meeting, Toronto, Canada, 2003.
[13] P. Fischer, L. Angquist and H.P. Nee, ―A new control scheme for an HVDC transmission link with capacitor-commutated converters having the inverter operating with constant alternating voltage‖ in Cigr´e Conference B4_106, PARIS, 2012.
[14] L. Harnefors, M. Bongiornos, and S. Lundberg, ―Input-admittance calculation and shaping for controlled voltage-source converters,‖ IEEE Trans. Ind. Electron., vol. 54, no. 6, pp. 3323–3334, December 2007.
[15] ―On voltage and power stability in ac/dc systems,‖ Cigr´e Working Group 14.05- 222, Tech. Rep., 2003.
[16] P. Kovacs, Transient Phenomena in Electrical Machines. Elsevier, 1984.
[17] P. Krause, O. Wasynczuk, and S. D. Sudhoff, Analysis of Electric Machinery and Drive Systems, 2nd Edition. Piscataway, NJ: IEEE Press, 2002.
[18] M. P. Kazmierkowski, R. Krishnan, and F. Blaabjerg, Control in Power Electronics. Academic Press., 2002.
[19] J. Holtz, ―The representation of ac machines dynamics by complex signal flow graphs,‖ IEEE Trans. Ind. Electron., vol. 42, no. 3, pp. 263–271, June 1995.
[20] D. N. Zmood, D. G. Holmes, and G. H. Bode, ―Frequency-domain analysis of three phase linear current regulators,‖ IEEE Trans. Ind. Applicat., vol. 37, no. 2, pp. 601– 610, March/April 2001.
[21] L. Harnefors, ―Modeling of three-phase dynamic systems using complex transfer functions and transfer matrices,‖ IEEE Trans. Ind. Electron., vol. 54, no. 4, pp. 2239–2248, August 2007.
[22] P. M. Anderson, B. L. Agrawal, and J. E. V. Ness, Subsynchronous resonance in power systems. Piscataway, NJ: IEEE Press, 1989. [23] K. R. Padiyar, Analysis of subsynchronous resonance in power
systems. United States of America: Kluwer Academic Publishers, 1999.
[24] E. W. Kimbark, Direct Current Transmission, Vol. I. New York: Wiley, 1971.
[25] J. Arrillaga, High Voltage Direct Current Transmission, 2nd Edition. London: The Institution of Electrical Engineers, 1998. [26] B. M. Weedy and B. J. Cory, Electric Power Systems, 4th Edition.
West Sussex, England: John Wiley & Sons Ltd., 1998.
[27] J. Setr´eus and L. Bertling, ―Introduction to HVDC technology for reliable electrical power systems,‖ in The 10th International Conference on Probablistic Methods Applied to Power Systems, Rincon, Puerto Rico, 2008.
[28] S. Corsi, A. Danelli, and M. Pozzi, ―Emergency-stability controls through HVDC links,‖ in IEEE Power Engineering Society Summer Meeting, Chicago, USA, 2002.
[29] T. Smed and G. Andersson, ―Utilizing HVDC to damp power oscillations,‖ IEEE Trans. Power Delivery, vol. 8, no. 2, pp. 620– 627, April 1993.
[30] W. Breuer, M. Lemes, and D. Retzmann, ―Perspectives of HVDC and FACTS for system interconnection and grid enhancement,‖ in Cigr´e Workshop: Brazil-China- India SummitMeeting on HVDC and Hybrid Systems, Rio de Janeiro, Brazil, 2006.
[31] G. Andersson, P. Donalek, R. Farmer, and N. Hatziargyriou, ―Causes of the 2003 major grid blackouts in North America and Europe, and recommended means to improve system dynamic performance,‖ IEEE Trans. Power Syst., vol. 20, no. 2, pp. 1922– 1928, November 2005.
[32] PSCAD website: http://www.pscad.com
![Fig. 3 Control technique for HVDC back to back [13]](https://thumb-us.123doks.com/thumbv2/123dok_us/8728743.886173/3.612.52.285.476.552/fig-control-technique-hvdc.webp)