BIROn - Birkbeck Institutional Research Online
Sivalingam, G.N. and Cryar, A. and Williams, Mark A. and Gooptu,
Bibekbrata
and
Thalassinos,
Konstantinos
(2018)
Deconvolution
of
ion
mobility
mass
spectrometry
arrival
time
distributions
using
a
genetic algorithm approach: application to 1-antitrypsin peptide binding.
International Journal of Mass Spectrometry 426 , pp. 29-37. ISSN
1387-3806.
Downloaded from:
Usage Guidelines:
Please refer to usage guidelines at or alternatively
1
Deconvolution of ion mobility mass spectrometry arrival time distributions using a genetic algorithm approach: application to α1-antitrypsin peptide binding.
Ganesh N. Sivalingam,† Adam Cryar,† Mark A Williams,‡ Bibek Gooptu,¶ and Konstantinos
Thalassinos ‡,† $
† Institute of Structural and Molecular Biology, Division of Biosciences, University College
London, Gower Street, London, WC1E 6BT, UK,
‡ Institute of Structural and Molecular Biology, Department of Biological Sciences, Birkbeck
College, University of London, London WC1E 7HX, United Kingdom,
¶ Leicester Institute of Structural and Cellular Biology and NIHR BRC-Respiratory, Henry
Wellcome Building, Lancaster Road, Leicester, LE1 7RH, United Kingdom
$ Correspondence to Konstantinos Thalassinos [email protected]
Abstract
Ion mobility mass spectrometry (IM-MS) is a fast and sample-efficient method for analysing the gas phase conformation of proteins and protein complexes. Subjecting proteins to increased collision energies prior to ion mobility separation can directly probe their unfolding behaviour. Recent work in the field has utilised this approach to evaluate the effect of small ligand binding upon protein stability, and to screen compounds for drug discovery. Its general applicability, however, for high-throughput screening will depend upon new analytical methods to make the approach scalable. Here we describe a fully automated program, called Benthesikyme, for summarising the ion mobility results from such experiments. The program automatically creates collision induced unfolding (CIU) fingerprints and summary plots that capture the increase in collision cross section and the increase in conformational flexibility of proteins during unfolding. We also describe a program, based on a genetic algorithm, for the deconvolution of arrival time distributions from the CIU data. This multicomponent analysis method was developed to require as little user input as possible. Aside from the IM-MS data, the only input required is an estimate of the number of conformational families to be fitted to the data. In cases where the appropriate number of conformational families is unclear, the automated procedure means it is straightforward to repeat the analysis for several values and optimize the quality of the fit. We have employed our new methodology to study the effects of peptide binding to α1-antitrypsin,
2
Introduction
Ion mobility and native conformation
Ion mobility mass spectrometry (IM-MS) is increasingly used in the field of structural biology to address a number of challenging questions relating to the structure and dynamics of proteins and protein complexes [1, 2]. IM-MS offers several advantages compared to more established tools used in the field, namely the ability to study proteins of high flexibility [3-5] and polydispersity [6], the ability to monitor and separate distinct conformational families co-existing in solution [7, 8] and all this whilst having modest sample requirements. IM-MS separates ions, typically generated from nano-electrospray ionization (nESI), based on their mass, charge and collision cross section (CCS). A large number of studies have shown that under carefully controlled experimental conditions and at low collision energies, the structures from IM-MS are closely related to those in solution for globular proteins and protein complexes [9-11].
Gas phase unfolding of proteins
By intentionally increasing the internal energy of an ion prior to IM-MS analysis, however, a number of interesting observations can be carried out. In some of the early applications of IM-MS to study protein structure, the groups of Jarrold, Clemmer and Bowers used injection energy studies to probe the unfolding of a number of model and disease-related proteins [12-14]. These experiments revealed the relative stability of different proteins. Proteins held together with disulphide bonds were more resistant to unfolding compared to those without them. Injection energy studies have also been used to probe the oligomeric state for a number of proteins involved in protein aggregation diseases. Oligomers dissociate to lower aggregation states and eventually to monomer at increasing injection energies [15].
Unfolding of protein complexes
Collision induced dissociation (CID) followed by IM-MS analysis has also been used to study large protein complexes [10]. Unlike CID of peptides, which results in the fragmentation of the peptide bond, for non-covalent complexes the increase in energy results in unfolding, typically of the smallest surface accessible subunit and so the term collision induced unfolding (CIU) is used in this case. This unfolding is followed by an asymmetric dissociation of the complex with many charges from the precursor being transferred to the smallest subunit, which is now able to accommodate more charges due to its largest surface area, prior to its dissociation from the complex [16]. More recent work, however, has shown that the above process depends on the tertiary structure of the protein complex [17] and on the charge state selected for CIU [18]. Since its initial description, CIU has been used to study a number of different processes, including gas phase protein stability due to anion and cation binding [19, 20], peptide binding [21], and lipid binding selectivity [22].
3
Another major application area of the CIU-IM-MS approach is examining the effect of ligand binding on the protein or protein complex structure. Comparison of the arrival time distributions obtained at increased collision energies between apo- and ligand-bound forms, for a number of proteins [23] and protein complexes, enabled characterisation of the changes in structural stability induced by ligand binding. The influence of different ligand-bound states has also been examined, illustrating the power of this approach in studying heterogeneous systems having multiple ligand binding stoichiometries [24] [25].
Ligand-specific CIU signatures may report other consequences of ligand binding. This has been demonstrated for small molecule inhibitors of the protein kinase domain of the Abl protein. These are defined by their binding specificity as type I (non-specific for the active conformer of the Abl kinase domain) or type II (active state specific) inhibitors. Although binding of either type of ligand to the protein did not substantially alter the conformation at low collision energies, they displayed distinct unfolding signatures. These ‘reference’ type I and type II signatures were then compared to the CIU signatures of novel ligands to predict their inhibitory mechanism. [26].
The need for computational tools
Consequently, the unfolding of proteins and protein complexes in the gas phase followed by IM-MS analysis provides valuable information that cannot be easily obtained by other structural methods. The development of commercial IM-MS instrumentation [27] has also led to an expansion in the number of laboratories that have access to this technology. As a consequence of an increased IM-MS user base, and the development of new types of data acquisition methods such as CIU, new computational methods to process these data are required. Programs to process the IM-MS data [28, 29], and CIU data [30, 31] have been recently developed. It is particularly desirable to report data from IM-MS studies in a standardised, quantitative manner to allow them to be compared. This requires the definition of parameters that reduce the dimensionality of IM-MS data whilst retaining important information about the ensemble behaviours that IM-MS is particularly well suited to characterise.
Here we describe a new computational approach for the analysis of CIU experiments. We present the benefit of summarising the data using the intensity weighted mean (IWMATD) and
standard deviation (IWSDATD) of each arrival time distribution (ATD). The results are a
quantitative method for representing the degree of unfolding in terms of change in CCS. We also describe a new genetic-based algorithm for the deconvolution and subsequent multicomponent analysis of CIU, capable of dealing with the conformational heterogeneity of unfolding proteins. Deconvolution allows accurate determination of the centre of conformational populations. It also facilitates more accurate calculation of the abundance of each resolvable conformational family in comparison to existing methodology, which uses peak heights. To demonstrate the efficacy of these methods, three proteins that have been previously well-characterised by native MS methods have been analysed; myoglobin, lysozyme and β -lactoglobulin, as well as the protein α1-antitrypsin in both its apo-form and bound to a peptide
previously shown to inhibit its aggregation.
4
(http://www.homepages.ucl.ac.uk/~ucbtkth/resources.html) while the genetic algorithm program is available on request.
Materials and Methods
Mass spectrometry sample preparation
Proteins were analysed in 200 mM ammonium acetate (Sigma Aldrich, St. Louis, MO). Buffer exchange was carried out using BioRad (Hercules, CA) BioSpin 6 columns, with additional concentration and dilution steps using Amicon Ultra 0.5 ml centrifugal filter devices (Millipore UK Ltd, Watford, UK). The concentration of these samples was monitored using a Qubit 2.0 fluorometer (Life Technologies, Carlsbaαd, CA). Samples were analysed after diluting to a final concentration of 10 µM.
Peptide binding to α1-antitrypsin
α1-antitrypsin was buffer exchanged into 250 mM ammonium acetate (pH 7) by 3 rounds of
dilution-concentration using 10 kDa Millipore Amicron Ultra centrifuge filters. The Ac-TTAI-NH2 peptide was also made up in ammonium acetate (pH 7). A molar ratio of 2:1 peptide:protein was used and the sample incubated for 72 hours at 37.5 degrees C before analysis. The final concentration of α1-antitrypsin was 15 μM.
IM-MS analyses
Experiments were performed on a Synapt HDMS mass spectrometer (Waters Corp., Manchester, UK) [27]. The Synapt geometry has two collision cells bracketing the ion mobility device. the trap, which Is situated before the IM device, and the transfer which is located after the IM device. To carry out CIU experiments, it is the voltage in the trap cell that is increased. The instrument was mass calibrated using 30 µM caesium iodide (Sigma Aldrich, St. Louis, MO) dissolved in 250 µM ammonium acetate. 2.5 - 4.5 µl aliquots of sample were delivered to the mass spectrometer using gold coated borosilicate capillaries prepared in-house [32].
The source temperature was 40 °C, the capillary voltage was set to 1.1 kV, and the cone voltage was kept at 30 V throughout all the experiments. The gas in the T-Wave IM separation cell was nitrogen, and the pressure was 0.54 mbar. The bias voltage was kept at 20 V while the T-Wave velocity was set to 350 m/s. The T-Wave height was optimised at 9 and 10 V for the study of the model proteins and α1-antitrypsin respectively. Unfolding of proteins was performed by
varying the trap voltage. The TOF analyzer was operated in V-optic mode and tuned for an operating resolution of 9,000 FWHM. Mass spectra were acquired at an acquisition rate of 2 spectra/sec with an interscan delay of 100 ms.
5
For the α1-antitrypsin unfolding experiments the quadrupole was used to isolate the +13 charge
state. The CCS calibration curves for these experiments were determined using β-lactoglobulin monomer and dimer charge states as well as concanavalin A tetramer.
Experiments analysing model proteins also used the quadrupole to isolate certain charge states (+7 lysozyme, +8 myoglobin and +8 β-lactoglobulin). All data reported for myoglobin are only for the heme-bound form. CCS calibration curves were calculated using BSA and bradykinin as the calibrants.
Software development
The genetic algorithm was developed in the C programming language before transferring to Cuda C. The software has been tested on GNU/Linux and Windows. Successfully tested graphics cards include Nvidia Tesla C1060, GeForce 560 Ti and 660 Ti.
Processing and displaying the results generated by the genetic algorithm is handled by the Python programming language, in conjunction with Python modules Numpy, Scipy, Matplotlib and Amphitrite [29].
Simulated data are generated as a sum of Gaussian peaks as defined in Equation 1, where d is the number of data points per ATD, n the number of Gaussian distributions (conformations) being fit, S is the vector of simulated data points and μ, Γ and A are the mean position, full width half maximum (FWHM) and amplitude of the Gaussian distribution, respectively.
Equation 1
! = $ $ %&'
( )*+,- ( .+/
0
1)2+⁄1√1 45 1/0 7
&89 :
;89
Results
Summarising unfolding data
The large amount of data produced by collision induced unfolding experiments can be difficult to represent graphically. In many cases the ATDs are displayed by vertically stacking them. Such a figure illustrates the key structural features of each distribution clearly. When the number of energy conditions increases however, quantitative evaluation of multiple overlapping and emerging features can become difficult to discriminate between ATDs (for example see
6
identification of promising ‘hits’ without detailed, time-consuming, processing of the resulting raw data.
To illustrate the issues involved in summarising ATD data, Figure 1A shows three hypothetical ATDs generated using Equation 1. Even though the maximum intensity is found at an arrival time of 10 ms in all three ATDs, the distributions are quite different. Simply selecting the position of the peak maximum, would not differentiate between them. ATD (a) consists of a single narrow conformational family, (b) has an additional conformation at a higher arrival time (shown as a shoulder on the main peak), while (c) represents an ATD that is much broader than that shown in (a).
In order for a single metric to compactly summarise an ATD its calculation must capture changes in the average arrival time, in peak width, and the presence of distinct minor conformations. The intensity weighted mean of arrival times (IWMATD) is sensitive to changes
in these features. IWMATD is calculated as in Equation 2, where I is the intensity in each time
interval, t is the arrival time and n is the number of data points in the arrival time axis).
Equation 2.
<=>?@A =
∑7&89<&C&
∑7&89<&
The intensity weighted standard deviation (IWSDATD), calculated using Equation 3, is a
complementary metric that reports the degree of conformational variation represented by the overall ATD and is directly comparable between different ATDs.
Equation 3
<=!D?@A = E
∑7&89<&(C&− <=>?@A)1
∑7&89<&
The IWMATD and IWSDATD values for the synthetic example are indicated on Figure 1A, and,
7
IM-MS CIU data were obtained on three model proteins, lysozyme, β-lactoglobulin and myoglobin (Figure 1B) and used to analyse the utility of this approach with real data. In order to remove the effects of mass and charge, and provide a direct comparison between proteins, we choose to convert the ATDs to CCSs (see materials and methods) and the trap collision voltages to laboratory frame voltage (charge state multiplied by voltage, which enables the comparison of different charge states). The equivalent metrics are then the intensity weighted mean of the CCS values (Equation 4) and the corresponding intensity weighted standard deviation (Equation 5).
Equation 4
<=>IIJ =
∑7&89<&KK!&
∑7&89<&
and
Equation 5
<=!DIIJ = E
∑7&89<&(KK!&− <=>IIJ)1
∑7&89<&
where I is the intensity in each CCS interval.
Figure 1C shows the results of calculating the IWMCCS from the experimental data. For
lysozyme, IWMCCS does not change as much as for the other two proteins. This is expected as
lysozyme is held together with four disulphide bonds. Whilst β-lactoglobulin and myoglobin have very close CCSs at low energies, at higher energies myoglobin (that contains no disulphide bonds) unfolds more readily than β-lactoglobulin (stabilized by disulphide bonding). After the IWMCCS of myoglobin reaches its highest value, it starts to reduce. This effect is likely
due to the heme group dissociating from the most extended conformational family, which causes a m/z shift outside the quadrupole isolation window, and consequently an over representation of the more compact conformations is observed. In Figure 1D the difference in CCS in relation to the CCS measured at the lowest voltage is shown. This representation simplifies for the direct comparison of proteins that differ in size.
Figure 1E shows the intensity weighted standard deviation CCS (IWSDCCS) as a function of
increasing collision energies. Regions with higher standard deviation values are indicative of conformational variability; the protein likely exists in several distinct conformations increasing the spread of the ATD. For myoglobin the highest IWSDCCS is observed at 100–200 V, (from
8
For both these proteins, there is a decline in this value at higher collision energies indicating that fewer distinct conformations are present. In contrast, for lysozyme the variability of the CCS increases almost uniformly, indicating that the protein is still experiencing relatively early, partial unfolding and has not begun converging on a single ensemble of structures.
Summarising the data as described here allows for a reproducible and objective means of describing ATDs with no requirement for peak fitting to the data. These metrics are fast to perform, allow for the quantification of differences in stability and conformational diversity between different proteins and different bound forms of a protein. The use of our described methodology therefore concisely reports upon multiple useful data characteristics present in the original ATDs or CCS vs. collision energy plots.
Multicomponent analysis of ATDs
The unfolding of proteins often yields several intermediate conformational families. Changes in the abundance of such intermediate conformational families can be used to compare different variants of a given protein, e.g. wild-type versus mutant forms, or to probe the effects of ligand binding to a protein. Up until now, estimates of the abundance of conformers have been made using peak heights at manually chosen drift times. The individual ATDs for each conformational family, however, are almost always never baseline resolved, therefore, inferring their abundance using peak heights does not provide a true reflection of their actual abundance. The strongly overlapped character of the data also makes the use of gradient descent optimisation techniques, such as non-linear least squares, inefficient in fitting individual Gaussians (used to represent one conformational family) to the data. Here we describe and evaluate a novel genetic algorithm (GA)-based approach for the fitting and deconvolution of ATDs obtained from gas phase unfolding experiments.
Genetic algorithms (GAs) are a class of artificial intelligence optimisation algorithms, which mimic evolution in order to find an optimal solution. Potential solutions to a problem are encoded as chromosomes and a set of chromosomes make up a population. A single chromosome contains all the parameters which are to be optimised, which are known as genes. Populations of chromosomes evolve over a number of generations with different evolutionary processes operating on these genes and chromosomes (crossover, mutation) with each chromosome evaluated for its fitness in finding an improved solution [36, 37].
A purpose-built framework for deconvoluting unfolding data has been developed and is presented here. An important feature of proteins revealed in the ion mobility data is that, as a protein unfolds in the gas-phase, it shifts between discrete families of conformations and does not progressively unfold in a continuous manner. This feature is used as a constraint in the fitting procedure; multiple ATDs recorded at different collision energies are deconvoluted simultaneously but the peak centres of each conformation are kept constant across all ATDs.
9
dataset, μ, Γ and A are the mean, full width half maximum (FWHM) and amplitude of each Gaussian distribution, respectively.
Equation 6
L = − $ $ ⎝
⎛$ O%&,P'
( )*+,-,Q(.+/
0
1)2+,Q⁄1√1 45 1/0R
1 7
&89
− S;,P1
⎠ ⎞
:
;89 V
P89
This fitness measure adds a greater penalty for large deviations, in comparison to the sum of absolute differences, between experimental and simulated data allowing it to more aggressively optimise against larger deviations between the fit and the data. The result of this is that the algorithm obtains fits that are close to the original data within fewer generations.
Multiple runs of the algorithm were performed in order to establish the optimal, mutation, crossover and population size (see Supplementary text and Supplementary Figures 3 and 4).
Deconvolution and abundance analysis of CIU in model proteins
10
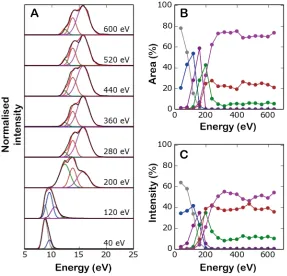
the percentage of all conformations present. Figure 2C shows the equivalent population estimates of each conformation when only peak heights are taken into account. Even though the overall trends shown in Figures 2B and 2C are similar, the relative abundances of each conformation are different. For the lowest collision energy, the adundances of the two major conformations, coloured blue and grey, are 63% and 35% using the peak height method, but 79% and 20% for the peak area analysis thus illustrating the benefits of defining conformational abundance as the relative areas enclosed within deconvoluted peaks rather than simply using their heights.
CIU-IM-MS characterization of α1-antitrypsin interaction with the tetrapeptide TTAI
To illustrate the applicability of our new software in analyzing a real-world biological problem, we used it to study the effects of peptide binding on the conformational behavior of the protein α1-antitrypsin.
α1-antitrypsin is the most abundant human plasma protease inhibitor, circulating at
concentrations of 1–2 mg/ml. Under physiological conditions α1-antitrypsin, like other members
of the serpin (serine protease inhibitor) protein superfamily, adopts a metastable conformation upon folding within the cell. An unstructured region in the protein termed the reactive centre loop (RCL) is used as substrate for the target enzyme. A transition from a metastable to a hyperstabilised enzyme-complexed state underlies their functional mechanism [38] during which, following cleavage by the enzyme, the RCL inserts as an extra strand in the main beta-sheet of α1-antitrypsin. Homopolymerisation of α1-antitrypsin, due to pathological mutations that
enable strand insertion without cleavage, results in a disease called α1-antitrypsin deficiency
which is associated with severe lung (early-onset, panacinar emphysema) and liver (hepatic cirrhosis, hepatocellular carcinoma) disease [39, 40].
We have recently analysed the interaction of α1-antitrypsin with TTAI, a peptide identified from
a combinatorial chemistry approach that has been shown to inhibit α1-antitrypsin polymerisation
[41], using a combination of native and ion mobility mass spectrometry, X-ray crystallography and NMR spectroscopy [25]. We observed that TTAI binds with a 2:1 peptide:protein stoichiometry and that binding of two copies of TTAI increases the conformational stability of α1-antitrypsin. We demonstrated that IM-MS is an ideal method for high-throughput screening
of compounds for the inhibition of diseases mediated by protein kinetic instability. However, although the time required to obtain the CIU IM-MS data was much less than either the X-ray or NMR experiments, data analysis was limited and labor-intensive due to the lack of programs to process CIU data at that time. We therefore focused on deconvoluting the ATDs between bound and unbound versions at only one collision voltage representative of the most conformational variability. Here we revisit the binding of TTAI to α1-antitrypsin by a) acquiring
many more collision voltages during the unfolding process and b) processing the data using our newly developed software so that abundance of each conformational family is measured across the entire CIU experiment. The ability to deal with more finely grained collision voltages during a CIU experiment ensures that greater detail of the structural transitions, at specific energies, is observed for the native (apo) form. This enables the study of conformational intermediates and how these are affected by small molecule / peptide binding events.
11
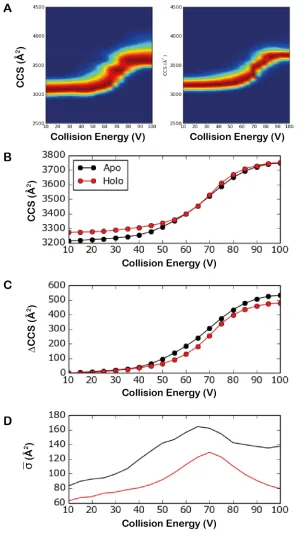
can be seen that the variation in CCS is greater for the apo protein than for the peptide-bound protein indicating that the double-bound protein has less conformational flexibility than the unbound protein.
Unfolding curves were generated from the data, whereby the increase in IWMCCS is plotted
against increases in the collision energy (Figure 3B and C). The unfolding curves in panel A show that even though the CCS of the double-bound protein is larger than the apo form under native-like conditions, as the collision energy increases the apo form appears to unfold more readily. This is shown more clearly when monitoring the change in CCS as a function of increasing collision energy. The double-bound form consistently demonstrates a reduced degree of unfolding in terms of increase in CCS.
To quantify and further confirm the change in conformational flexibility seen in the CIU fingerprint analysis, the IWSDCCS was plotted (Figure 3D). Critically the bound form has a
30-40% smaller IWSDCCS, indicating lower conformational heterogeneity, across all collision
energies. This confirms that the reduction in conformational lability (increase in kinetic stability) induced by TTAI binding previously described at higher energies by CIU-IM-MS holds true at the lowest energy (most native-like) conditions. Towards the highest collision energy, the variability of the apo form appears to start increasing; this may indicate another unfolding event taking place. In contrast, these energies are associated with reduced variability in the ternary-complex state. This indicates that at the highest energies studied the protein:peptide ternary-complex converges on a specific, stable conformation. It is possible, however, that this convergence could represent the behaviour of the peptide-bound state before peptide release since TTAI dissociation would cause a concomitant shift out of the region of the m/z spectrum selected for IM-MS analysis.
Deconvolution of α1-antitrypsin data
The summary statistics shown in Figure 3 confirm that on average the binding of TTAI stabilises the ensemble behaviour of α1-antitrypsin. We used our GA-based algorithm to understand this
in more detail, in terms of the populations of different conformeric states within the ensemble. The results of the deconvolution are shown in Figure 4.
In the original ATD data, families of different conformational states are indicated by inflection points (directly observable ‘peaks’, ‘shoulders’ and ‘tails’). The relative populations of the different states, however, cannot be directly assessed and then compared without deconvolution. α1-antitrypsin is a highly metastable protein in solution and so the composite
ATD profile likely reflects varying rates of conformational exchange between different species in the gas phase during the timescale of the IM-MS experiment. Conformational exchange rates that are slow relative to this timescale will tend to cause distinct inflection points, whilst those that are more rapid will tend to cause peak broadening. Moreover, the differences in CCS between different conformer families of the same monomeric protein approach the technical limits of current resolution on the instruments used. Together these factors result in increased peak overlap. Deconvolution is therefore key to quantitative analysis of such phenomena. The results of such deconvolution using our GA-based algorithm are shown in Figure 4.
12
number of species (i.e. the number of Gaussians to include in the deconvolution) will improve the apparent fit of the solutions to the data, beyond the resolution of the data. We were therefore keen to establish a quantitative method to select the appropriate number of families that the data could define. To this end we ran our GA algorithm several times, each time varying the number of conformational families (each represented by a Gaussian) to be fitted and the seed number used by the GA to randomly generate the initial population. The resulting ‘elbow plot’ of fitting error versus number of conformational families is shown in Supplementary Figure 5. This plot shows that the fitting error reaches a plateau beyond approximately 5 or 6 families. The results shown in Figure 4 from the fitting of the ATDs with 6 conformational families and from the run that resulted in the lowest fitting error.
The individual peaks fitted to the data for the apo and holo forms of the protein are shown in Figures 4A and 4B respectively. The abundance for each deconvoluted peak is shown in Figures 4C and 4E while Figures 4D and 4F show the variation in FHWM for each peak across the collision energy ramp.
The more compact conformational family, coloured in grey, is present over the same range of collision energies and persists until about 30 V, after which it disappears. However, the width of this family, as shown in figures 4D and 4F, is much narrower for the holo than the apo form, illustrating stabilization induced by peptide binding. This is consistent with a reduction in conformational lability relating to increased activation energy for transitions between states within the conformational family, that are more evident in the apo form. It is interesting to note that the third and fourth conformational families, coloured in purple and green, appear at much lower energies in the apo versus the holo form and persist over a larger range of voltages. We attribute the delay in appearance of these families in the holo-form to peptide-induced stabilization.
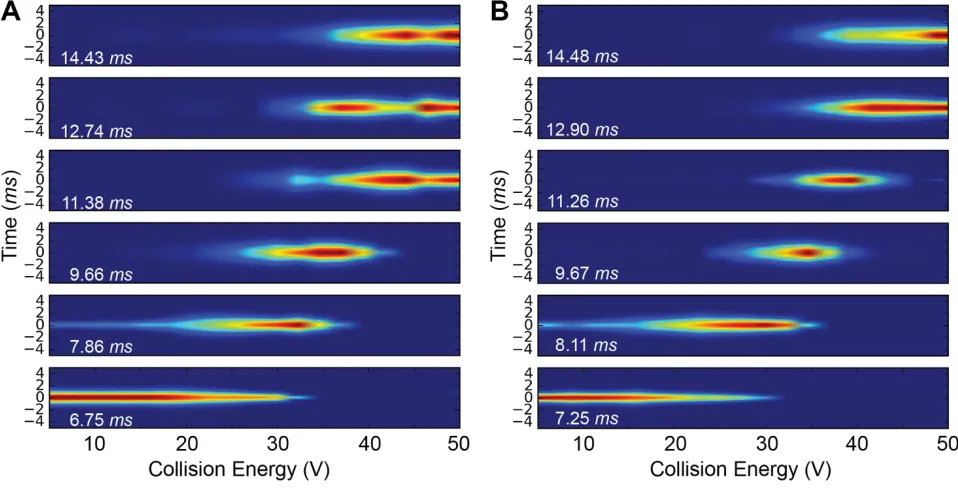
Our program also allows the same data to be represented more intuitively, in heat map format so that both the conformation and the width of each family can be seen at once as seen in Figure 5. This view makes it much easier to evaluate the effects of peptide binding on the different conformational families. Such differences may have been difficult to detect and, certainly, to accurately quantify without multi-component deconvolution analysis of these data.
Conclusions
The benefits of statistically summarising gas phase unfolding data have been outlined here. By using the intensity-weighted mean (IWMATD and IWMCCS) and standard deviation (IWSDATD and
IWSDCCS) to describe the ion mobility data (Figure 1) the degree of unfolding and
conformational flexibility can be readily compared between different proteins and protein-ligand complexes. A novel method for deconvoluting IM-MS arrival time distributions, based on a genetic algorithm, is also presented. This approach offers a more accurate representation of the peak positions, abundance and CCS variation for each conformational family present in the unfolding data.
13
robots like the TriVersa NanoMate. Raw data can be extracted in an automated fashion using our previously published software, Amphitrite [29]. Our current software can then automatically create unfolding and variability curves along with CIU fingerprints. The software presented here reports quantitative measures of benefit when screening putative drug molecules for their effects upon the conformational behaviour of the protein. For proteins liable to pathogenic conformational change each of these measures may have specific relevance. In the case of a1
-antitrypsin, the conformational variability of disease variants may correlate better with pathogenicity than overall stability or resistance to unfolding [25, 42].
In a high throughput process, our summary metrics could allow standardised selection of molecules of interest for subsequent, in-depth analysis, by the GA deconvolution algorithm. An example of this would be to select ligands where at a given voltage the percentage change in CCS is under 5 % and the standard deviation is under 150 Å2. Without the introduction of robust
CIU processing software the use of consistent threshold values would not be possible due to the high variability of manual interpretation.
The GA deconvolution algorithm can produce detailed information for the unfolding process within the same time frame as the data acquisition. For increased accuracy we would recommend proceeding to run the GA multiple times with varying number of conformational families as this will provide evidence that helps in selecting the most appropriate number of Gaussian peaks to fit to the data. Running the GA a few times with different random seeds, used by the GA to generate the initial population, can have an effect on the resulting fit. The user can then assure themselves of the robustness of the fitting procedure and select the run resulting in the lowest overall error.
We have illustrated how this approach can be used for this purpose by studying the effects of peptide binding on the medically important protein α1-antitrypsin. Our current analysis reveals
a more in-depth picture of how peptide binding alters intermediate stability compared to our previous study [25]. Future work will involve screening a large number of drug molecules against wild-type and disease variant forms of α1-antitrypsin. Once a large number of molecules
are screened, machine learning methods can be used to classify them and generate ‘fingerprints’ such as in the work of [26]. The availability of such fingerprints would likely further limit the time of experimental analysis as only data at select collision energies would be required in order to classify the behavior of a new drug.
Acknowledgements
14
References
1. Konijnenberg, A., A. Butterer, and F. Sobott, Native ion mobility-mass spectrometry and related methods in structural biology. Biochimica Et Biophysica Acta-Proteins and Proteomics, 2013. 1834(6): p. 1239-1256.
2. Thalassinos, K., et al., Conformational States of Macromolecular Assemblies Explored by Integrative Structure Calculation. Structure, 2013. 21(9): p. 1500-1508.
3. Jurneczko, E., et al., Probing the Conformational Diversity of Cancer-Associated Mutations in p53 with Ion-Mobility Mass Spectrometry. Angewandte Chemie-International Edition, 2013. 52(16): p. 4370-4374.
4. Pagel, K., et al., Intrinsically Disordered p53 and Its Complexes Populate Compact Conformations in the Gas Phase. Angewandte Chemie-International Edition, 2013.
52(1): p. 361-365.
5. Wojnowska, M., et al., Autophosphorylation Activity of a Soluble Hexameric Histidine Kinase Correlates with the Shift in Protein Conformational Equilibrium. Chemistry & Biology, 2013. 20(11): p. 1411-1420.
6. Hilton, G.R., et al., C-terminal interactions mediate the quaternary dynamics of alpha B-crystallin. Philosophical Transactions of the Royal Society B-Biological Sciences, 2013.
368(1617).
7. Smith, D.P., et al., Monitoring copopulated conformational states during protein folding events using Electrospray ionization-ion mobility spectrometry-mass spectrometry. Journal of the American Society for Mass Spectrometry, 2007. 18(12): p. 2180-2190. 8. Wyttenbach, T., et al., The Effect of Calcium Ions and Peptide Ligands on the Relative
Stabilities of the Calmodulin Dumbbell and Compact Structures. Journal of Physical Chemistry B, 2010. 114(1): p. 437-447.
9. Leary, J.A., et al., Methodology for Measuring Conformation of Solvent-Disrupted Protein Subunits using T-WAVE Ion Mobility MS: An Investigation into Eukaryotic Initiation Factors. Journal of the American Society for Mass Spectrometry, 2009. 20(9): p. 1699-1706.
10. Ruotolo, B.T., et al., Evidence for macromolecular protein rings in the absence of bulk water. Science, 2005. 310(5754): p. 1658-1661.
11. Scarff, C.A., et al., Travelling wave ion mobility mass spectrometry studies of protein structure: biological significance and comparison with X-ray crystallography and nuclear magnetic resonance spectroscopy measurements. Rapid Communications in Mass Spectrometry, 2008. 22: p. 3297-3304.
12. Bernstein, S.L., et al., alpha-synuclein: Stable compact and extended monomeric structures and pH dependence of dimer formation. Journal of the American Society for Mass Spectrometry, 2004. 15(10): p. 1435-1443.
13. Shelimov, K.B., et al., Protein structure in vacuo: Gas-phase confirmations of BPTI and cytochrome c. Journal of the American Chemical Society, 1997. 119(9): p. 2240-2248. 14. Valentine, S.J., et al., Disulfide-intact and -reduced lysozyme in the gas phase:
Conformations and pathways of folding and unfolding. Journal of Physical Chemistry B, 1997. 101(19): p. 3891-3900.
15
16. Ruotolo, B.T., et al., Ion mobility-mass spectrometry reveals long-lived, unfolded intermediates in the dissociation of protein complexes. Angewandte Chemie-International Edition, 2007. 46(42): p. 8001-8004.
17. Erba, E.B., et al., Ion Mobility-Mass Spectrometry Reveals the Influence of Subunit Packing and Charge on the Dissociation of Multiprotein Complexes. Analytical Chemistry, 2010. 82(23): p. 9702-9710.
18. Pagel, K., et al., Alternate Dissociation Pathways Identified in Charge-Reduced Protein Complex Ions. Analytical Chemistry, 2010. 82(12): p. 5363-5372.
19. Han, L., et al., Bound anions differentially stabilize multiprotein complexes in the absence of bulk solvent. Journal of the American Chemical Society, 2011. 133(29): p. 11358-67.
20. Han, L., S.J. Hyung, and B.T. Ruotolo, Bound cations significantly stabilize the structure of multiprotein complexes in the gas phase. Angew Chem Int Ed Engl, 2012. 51(23): p. 5692-5.
21. Nyon, M.P., et al., An integrative approach combining ion mobility mass spectrometry, X-ray crystallography, and nuclear magnetic resonance spectroscopy to study the conformational dynamics of alpha1-antitrypsin upon ligand binding. Protein Science, 2015. 24(8): p. 1301-1312.
22. Laganowsky, A., et al., Membrane proteins bind lipids selectively to modulate their structure and function. Nature, 2014. 510(7503): p. 172-175.
23. Hopper, J.T.S. and N.J. Oldham, Collision Induced Unfolding of Protein Ions in the Gas Phase Studied by Ion Mobility-Mass Spectrometry: The Effect of Ligand Binding on Conformational Stability. Journal of the American Society for Mass Spectrometry, 2009.
20(10): p. 1851-1858.
24. Hyung, S.J., C.V. Robinson, and B.T. Ruotolo, Gas-Phase Unfolding and Disassembly Reveals Stability Differences in Ligand-Bound Multiprotein Complexes. Chemistry & Biology, 2009. 16(4): p. 382-390.
25. Nyon, M.P., et al., An integrative approach combining ion mobility mass spectrometry, X-ray crystallography and NMR spectroscopy to study the conformational dynamics of alpha -antitrypsin upon ligand binding. Protein Science, 2015.
26. Rabuck, J.N., et al., Activation State-Selective Kinase Inhibitor Assay Based on Ion Mobility-Mass Spectrometry. Analytical Chemistry, 2013. 85(15): p. 6995-7002.
27. Pringle, S.D., et al., An investigation of the mobility separation of some peptide and protein ions using a new hybrid quadrupole/travelling wave IMS/oa-ToF instrument. International Journal of Mass Spectrometry, 2007. 261(1): p. 1-12.
28. Marty, M.T., et al., Bayesian Deconvolution of Mass and Ion Mobility Spectra: From Binary Interactions to Polydisperse Ensembles. Analytical Chemistry, 2015. 87(8): p. 4370-4376.
29. Sivalingam, G.N., et al., Amphitrite: A program for processing travelling wave ion mobility mass spectrometry data. International Journal of Mass Spectrometry, 2013. 345–347(0): p. 54-62.
30. Eschweiler, J.D., et al., CIUSuite: A Quantitative Analysis Package for Collision Induced Unfolding Measurements of Gas-Phase Protein Ions. Analytical Chemistry, 2015.
87(22): p. 11516-22.
16
32. Hernandez, H. and C.V. Robinson, Determining the stoichiometry and interactions of macromolecular assemblies from mass spectrometry. Nature Protocols, 2007. 2(3): p. 715-726.
33. Bush, M.F., et al., Collision Cross Sections of Proteins and Their Complexes: A Calibration Framework and Database for Gas-Phase Structural Biology. Analytical Chemistry, 2010. 82(22): p. 9557-9565.
34. Thalassinos, K., et al., Characterization of Phosphorylated Peptides Using Traveling Wave-Based and Drift Cell Ion Mobility Mass Spectrometry. Analytical Chemistry, 2009.
81: p. 248-254.
35. Zhong, Y., S.J. Hyung, and B.T. Ruotolo, Ion mobility-mass spectrometry for structural proteomics. Expert Rev Proteomics, 2012. 9(1): p. 47-58.
36. Holland, J.H., Genetic Algorithms. Scientific American, 1992. 267(1): p. 66-72.
37. Eiben, A.E. and J. Smith, From evolutionary computation to the evolution of things. Nature, 2015. 521(7553): p. 476-482.
38. Gooptu, B. and D.A. Lomas, Conformational pathology of the serpins: themes, variations and therapeutic strategies. Annu Review of Biochemistry, 2009. 78: p. 147-176.
39. Gooptu, B., J.A. Dickens, and D.A. Lomas, The molecular and cellular pathology of α1-antitrypsin deficiency. Trends in Molecular Medicine, 2014. 20(2): p. 116-127.
40. Stockley, R.A. and A.M. Turner, alpha-1-Antitrypsin deficiency: clinical variability, assessment, and treatment. Trends in Molecular Medicine, 2014. 20(2): p. 105-115. 41. Chang, Y.P., et al., Small-molecule peptides inhibit Z alpha1-antitrypsin polymerization.
Journal of Cellular and Molecular Medicine, 2009. 13: p. 2304-2236.
Figures
Figure 1. (A) Synthetic data demonstrating spectral differences that can be identified by the proposed summary statistics - Arrival time (td) of the spectral maximum is shown as blue line and the intensity
weighted average (IWMATD) is marked in red and the intensity weighted standard deviation (IWSDATD)
given in the top right of each panel; (B) CIU fingerprints for lysozyme (left), β-lactoglobulin (middle) and myoglobin (right); Unfolding curves for model proteins presented as (C) intensity weighted mean collision cross-section (IWMCCS), (D) change in IWMCCS, and (E) IWSDCCS (indicative of
[image:18.595.72.359.422.698.2]conformational variability).
Figure 2
coloured the same throughout the figure. (B) Relative proportions of deconvoluted conformational families assessed by area under the corresponding Gaussian. (C) Relative abundance determined using peak height analysis.
Figure 3
α1-antitrypsin collision induced unfolding fingerprints (A) for apo (left) and TTAI-bound (right); (B)
unfolding curves showing the IWMCCS at varying collision energies, (C) as with (B) except showing
change in IWMCCS from the lowest voltage, (D) Conformational variability analysis; IWSDCCS vs.
Figure 4
Deconvolution of gas phase unfolding data for apo (A) and double bound (B) α1-antitrypsin.
Experimental data is shown in black, with the sum of the deconvolution in red. The deconvoluted distribution of each conformation is shown with coloured lines. The abundance analysis of each conformational family determined by the deconvolution is shown for the apo (C) and holo (E) protein with the FWHM for each of the deconvoluted peaks shown in E and F respectively.
[image:20.595.82.561.472.718.2]1 Supplementary Text
Genetic Algorithm optimisation
Genetic algorithms are inspired by Darwin’s theory of evolution. Problems are solved by an evolutionary process resulting in the best (fittest) solution. Potential solutions to a problem are encoded as chromosomes with a set of chromosomes making up a population. A single chromosome contains the individual parameters to be optimized, referred to as genes. Evolutionary processes acting on the population include crossover and mutation.
The basic outline of a genetic algorithm is:
1. Creation of a random population of k chromosomes
2. Evaluation of the fitness f(x) for each chromosome x (see equation 6 in main text) 3. Creation of a new population
(a) Two parent chromosomes are selected from the population (Selection) (b) A crossover operation is performed between the parents to create offspring
chromosomes (Crossover)
(c) The resulting offspring chromosomes are mutated (Mutation) (d) The newly derived chromosomes are placed back in the population 4. The new population is used to evaluate the fitness of each new chromosome 5. A check is performed to evaluate whether an end condition is satisfied
Crossover
Crossover is the method used to simulate the biological process of recombination. The genes (parameter values) of two parent chromosomes are mixed together to create the offspring. There are several different crossover implementations, and two common methods are compared here. In single point crossover, a point along the chromosome is randomly chosen, the genes after that point are taken from one parent chromosome and the genes before from the other. The second method is uniform crossover where each gene of the offspring is independently randomly chosen from one of the parents. The single point crossover is most true to the biological process of recombination and only requires a single random number to be generated. In comparison, for uniform crossover many random numbers have to be created at each generation, which can cause a significant increase to computation time. Uniform and single-point crossover search parameter space differently and one may converge to a good solution more quickly than the other for particular problems.
To test the two crossover methods, the lysozyme data set was run with a population size of 2,000, using three different mutation rates. The algorithm was run 32 times using different random number generator seeds to ensure that the different runs followed different evolutionary paths and the results are shown in Supplementary Figure 3A.
Single point crossover outperformed uniform crossover at the highest mutation rate, however this was not maintained for lower mutation rates where uniform crossover resulted in better convergence. The single point crossover took only 81 % of the time taken by the uniform method when all other factors were constant, however the single point method resulted in 33 % greater variation between runs at lower mutation rates.
2
The probability that a gene (parameter value) will be mutated in each generation. High mutation rates mean that a larger variety of values can be tested, which is especially important with small population sizes. Detrimentally, high mutation rates can disrupt the convergence of the genetic algorithm by introducing too much randomness for the other simulated evolutionary processes to function.
Three mutation rates, 0.01 (representative of a 1 % mutation chance), 0.001 and 0.0001, were compared and the results are shown in Supplementary Figure 3A. The highest mutation rate performed very poorly, with much higher error values than the lower mutation rates.
The difference between mutation rates 0.001 and 0.0001 is small, and although the average error is lower using the lowest mutation rate, the standard deviation is higher. To further investigate this, a histogram was plotted (Supplementary Figure 3B), and here we can see that though the variability is greater for the lowest mutation rate the distribution of the error values is better in comparison to the 0.001 mutation rate.
There is additionally a small time benefit for using lower mutation rates, as new values have to be generated less frequently. Upon testing, the 0.0001 mutation rate took 5 % less time to complete than the 0.001 mutation rate.
Population size
An important factor in the performance of a genetic algorithm is the population size, or number of chromosomes per generation. Larger population sizes improve the chance that the solution to a problem can be constructed from the initial population without having to rely on mutation to generate appropriate genes. This comes at the cost of the run time of the program as the amount of computation required scales linearly with the number of chromosomes which are to be processed.
In order to select an appropriate population size to use for experimental data the lysozyme dataset was tested again. Uniform crossover was used with a 0.0001 mutation rate for a variety of population sizes. The algorithm was run for 200,000 generations and each result was replicated six times using different random number seeds, the results are shown in
Supplementary Figure 4.
The smaller population sizes, 50, 500 and 1,000, all perform substantially worse than 2,000 and 8,000. The difference between population sizes 2,000 and 8,000 is much smaller. The latter population does consistently perform better, but it may not be worth the additional computation time.
3
Number of generations to achieve convergence
The algorithm runs for a certain number of rounds of simulated evolution, with each round known as a generation. The error from one generation to the next never worsens, due to the use of elitism, where the best chromosome from the last generation is retained.
The comparison of the effect of generations is shown in Suppl. Figure 4. Generation 0 indicates the error for the fittest chromosome in the starting population, and the biggest reduction in error is shown in the first 50,000 generations. Supplementary Table 1 shows the reduction in error from each additional set of 50,000 generations, and it shows that though the initial decrease in error is the largest, there is still consistent improvement even to 200,000 generations. This indicates that the algorithm could still achieve a lower error, and when running the algorithm it is preferable to run it for as many generations as possible and examine convergence.
On the GPU-equipped computer used for these calculations, it took approximately 1 hour to run using the optimum settings above for 200,000 generations.
Generation Error DeltaError
0 5587.1 n/a
50000 106.4 -5480.7
100000 95 -11.4
150000 85.1 -9.9
200000 77.8 -7.4
Supplementary Table 1. Table showing the average error and the change in error over the
previous 50,000 generations for the population size of 2,000. Data are taken from Supplementary Figure 4.
4 Supplementary figures
5
distributions for A) lysozyme (blue), B) β-lactoglobulin (green) and C) myoglobin (black).
Supplementary Figure 2. Results of the deconvolution algorithm. (A) Synthetic collision
6
Supplementary Figure 3. Optimising the mutation rate and crossover parameters, for
experimental data. The algorithm was run 32 times for each combination of settings using the lysozyme dataset and a population size of 2,000, and the results are shown in (A). The error bars indicate the spread of 2 standard deviations. (B) Histogram comparing the error results for the two best performing configurations, uniform crossover with mutation rates of 0.001 and 0.0001.
Supplementary Figure 4. Optimising the population size for experimental lysozyme data.
7
Supplementary Figure 5. Determining the optimal number of conformations (each