BIROn - Birkbeck Institutional Research Online
Mares, Ines and Smith, Marie L. and Johnson, Mark H. and Senju, Atsushi
(2018) Revealing the neural time-course of direct gaze processing via spatial
frequency manipulation of faces. Biological Psychology 135 , pp. 76-83.
ISSN 0301-0511.
Downloaded from:
Usage Guidelines:
Please refer to usage guidelines at or alternatively
1 1
Revealing the neural time-course of direct gaze processing via spatial frequency manipulation 2
of faces 3
Inês Maresa,b, Marie L. Smitha,b, Mark H. Johnsona and Atsushi Senjua 4
5
aCentre for Brain and Cognitive Development, Department of Psychological Sciences,
6
Birkbeck, University of London 7
Henry Wellcome Building, Malet Street, London WC1E 7HX, United Kingdom 8
9
bDepartment of Psychological Sciences, Birkbeck, University of London
10
Birkbeck College, Malet Street, London WC1E 7HX, United Kingdom 11
12
Authors emails Inês Mares – [email protected]; Marie L. Smith - 13
[email protected]; Mark H Johnson - [email protected] and Atsushi Senju - 14
a.senju@bbk.ac.uk 15
16
Corresponding Author- Inês Mares, 17
Department of Psychological Sciences 18
Birkbeck, University of London 19
Malet St, London, WC1E 7HX 20
2 1
Abstract 2
Direct gaze is a powerful social cue signalling the attention of another person toward oneself. 3
Here we investigated the relevance of low spatial frequency (LSF) and high spatial frequency 4
(HSF) in facial cues for direct gaze processing. We identified two distinct peaks in the ERP 5
response, the N170 and N240 components. These two components were related to different 6
stimulus conditions and influenced by different spatial frequencies. In particular, larger N170 7
and N240 amplitudes were observed for direct gaze than for averted gaze, but only in the 8
N240 component was this effect modulated by spatial frequency, where it was reliant in LSF 9
information. By contrast, larger N170 and N240 components were observed for faces than for 10
non-facial stimuli, but this effect was only modulated by spatial frequency in the N170 11
component, where it relied on HSF information. The present study highlights the existence of 12
two functionally distinct components related to direct gaze processing. 13
Keywords: Direct gaze; face processing; spatial frequency; event-related potentials; N170 14
15
16
17
18
19
20
3 Highlights:
1
- Contribution of spatial frequency information to direct gaze processing was tested 2
- Two early face-sensitive ERP components, N170 and N240, were identified 3
- N170 reflected high spatial frequency processing of face vs non-face information 4
- N170 enhancement to direct gaze motion is independent of spatial frequency content 5
- N240 reflects low spatial frequency information for direct gaze processing 6
7
8
9
10
11
12
13
14
15
16
17
18
4 1. Introduction
1
Rapid and accurate perception of eye-gaze direction is an essential social function 2
which permits the understanding of another’s allocation of attention. Direct eye-gaze, in 3
particular, signals when the attention of another is directed towards oneself and is therefore 4
crucial for human social interaction throughout development to adulthood (Kleinke, 1986). In 5
line with its importance, a number of visual search studies have suggested that direct gaze is a 6
more salient visual cue than other gaze directions (Doi, Ueda, & Shinohara, 2009; Senju, 7
Hasegawa, & Tojo, 2005; von Grünau & Anston, 1995), a phenomenon termed the stare-in-8
the-crowd effect. This faster orienting towards faces with direct gaze, compared with averted 9
gaze, has further been shown in express saccades (saccades occurring under 130 ms), 10
supporting the very early processing of gaze information (Mares, Smith, Johnson, & Senju, 11
2016). Accordingly, neural responses as observed through event related potentials (ERP) 12
have shown that direct gaze is differentiated from averted gaze in early components such as 13
the P100 (Berchio et al., 2016; Conty, Dezecache, Hugueville, & Grèzes, 2012) . 14
The importance of different spatial frequency bands for the fast processing of direct 15
gaze remains, however, poorly understood. It has been proposed that coarser information, 16
meaning low spatial frequencies (LSF), are important for fast object processing by activating 17
faster magnocellular pathways reliant on this type of visual information (Bar, 2003, 2004). 18
Early processing and detection of direct gaze in particular, has been suggested to rely on LSF 19
information (Senju & Johnson, 2009). However, different studies have yielded very mixed 20
results regarding the spatial frequencies that support gaze processing. The importance of LSF, 21
for gaze processing has been shown in a gaze cueing paradigm (de Jong, van Engeland, & 22
Kemner, 2008). de Jong et al. (2008) found a N200 ERP component effect, in neurotypical 23
participants, for gaze cueing validity in which larger N200 amplitudes were observed for 24
5 high spatial frequency (HSF) information. This pattern was reversed for participants with 1
autism spectrum disorders (ASD). Similarly, newborns, who lack sensitivity to HSFs (Norcia, 2
Tyler, & Hamer, 1990) and rely on LSF for face recognition (de Heering et al., 2008), are 3
sensitive to gaze information, looking longer towards faces with direct gaze than towards 4
faces with averted gaze (Farroni, Csibra, Simion, & Johnson, 2002). 5
On the other hand, it is not clear how the critical spatial frequency bandwidths for 6
gaze processing change throughout development, with HSF information being critical for the 7
explicit discrimination between leftwards and rightwards gaze directions in adults (Vida & 8
Maurer, 2015). Furthermore, early neural differentiation between direct and averted gaze has 9
only been observed for broad spatial frequency, while no effects of gaze direction were found 10
for stimulus displayed only with high or low spatial frequency information (Burra, Kerzel, & 11
George, 2016). 12
Thus, the present study aims to analyse the contribution of LSF and HSF for direct 13
gaze processing in an adapted version of a task that has previously shown to lead to enhanced 14
processing of direct gaze, both at neural and behavioural levels (Conty, N’Diaye, Tijus, & 15
George, 2007). The ERP paradigm used by Conty et al. (2007) has previously shown a larger 16
N170 component for dynamically presented direct gaze in comparison with averted gaze, 17
which was accompanied by a better recognition of direct gaze. Several studies have shown 18
the face selective N170 component, an early negativity occurring over lateral occipito-19
temporal brain regions, is routinely and robustly associated with face perception and 20
encoding (e.g. Bentin, Allison, Puce, Perez, & McCarthy, 1996; Itier & Taylor, 2004) and is 21
sensitive to dynamic gaze motion (Conty et al., 2007; Latinus et al., 2015; Puce, Smith, & 22
Allison, 2000). 23
ERP studies analysing LSF and HSF modulation of the N170/M170 in face 24
6 no differences in this component between stimuli containing HSF or LSF information 1
(Holmes, Winston, & Eimer, 2005; Pourtois, Dan, Grandjean, Sander, & Vuilleumier, 2005), 2
other studies have reported either an advantage for stimuli containing only LSF information 3
(Goffaux, Gauthier, & Rossion, 2003; Halit, de Haan, Schyns, & Johnson, 2006; Vlamings, 4
Goffaux, & Kemner, 2009) or for stimuli containing only HSF information (Hsiao, Hsieh, 5
Lin, & Chang, 2005; Nakashima et al., 2008). Task dependent effects have been observed to 6
modulate N170 amplitudes to specific bandwidths of spatial frequency in faces (Goffaux, 7
Jemel, Jacques, Rossion, & Schyns, 2003). Similarly, the use of different spatial frequency 8
bands has been shown to be task dependent in a previous behavioural study (Schyns & Oliva, 9
1999). Thus, to try to avoid a direct impact of task, the present study only asked participants 10
to detect a rarely occurring target to keep participants attentive. 11
Original images of faces with direct and averted gaze were filtered to create stimuli 12
presenting high, low and broad (unfiltered) spatial frequencies. Furthermore, matched 13
conditions were created with pictures of buildings, which allowed for the dissociation 14
between general motion processing and eye gaze processing. As a secondary question, the 15
current study also allowed us to analyse separately the impact of HSF and LSF information 16
on the ERP components associated with facial motion compared to non-facial motion, and 17
those associated with different direction of gaze shift. 18
19
2. Methods 20
2.1.Participants
21
Fifteen participants (10 female, between 21-48 years old, mean age: 33.13 years) were 22
tested. They were right handed, with normal or corrected to normal vision. All participants 23
7 for their participation. The study was approved by the ethical committee of the Department of 1
Psychological Sciences, Birkbeck College, University of London. 2
2.2.Stimuli
3
Twenty-four greyscale digitized photographs were used as stimuli, 12 of which were 4
of faces (6 male and 6 female) and the other 12 were of buildings. Faces had neutral 5
expressions and were cropped to exclude external features such as hair. A similar oval 6
cropping was used for the building stimuli. Faces with direct and averted (30° of center, 7
counterbalanced between right and left) gaze directions were included (see George et al., 8
2001 for details about the stimuli generation process). Faces were presented oriented to the 9
left and to the right (30°), to avoid a symmetry confound. To be able to simulate a change in 10
gaze direction, a morphed version of direct and averted gaze was created to establish a 11
common baseline for both conditions (eye-gaze at approximately 15°). Similarly, a black bar 12
was inserted in building images either centred, deviated to the left or to the right or morphed 13
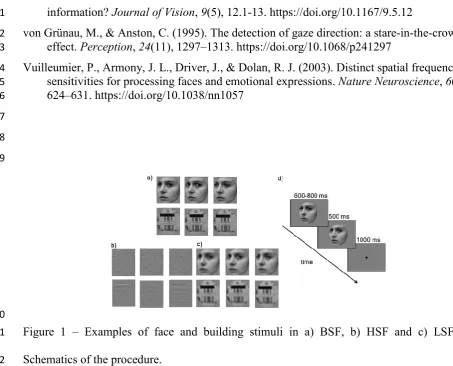
between them (Figure 1a). This control was used to account for differences in the perception 14
of motion to the centre or towards the periphery. HSF (Figure 1b) and LSF (Figure 1c) 15
versions of all images were created by applying a high (above 24 cycles per stimuli) and low 16
(below 8 cycles per stimuli) pass filter. Second order Butterworth filters were used to filter 17
stimuli, using an in house Matlab script (The Mathworks, Natick, MA). The selected spatial 18
frequency cut-offs per image and filtering were similar to the ones used by Schyns and Oliva 19
(1999). These spatial frequency cut-offs are outside the mid-range spatial frequencies 20
considered crucial for face recognitions (8-16 Hz) and have been previously used in other 21
ERP studies tackling the spatial frequency information used for face processing (Halit, de 22
Haan, & Johnson, 2003). Images without any filtering were also presented (BSF). Mean 23
8 has been shown to be the best index for perceived contrast in natural images (Bex & Makous, 1
2002). Stimuli subtended 14°×18° degrees of visual angle. 2
2.3.Procedure
3
Participants sat comfortably in a chair in an electrically shielded and soundproofed 4
room at a fixed viewing distance of 60 cm from the computer screen (fixed via the use of a 5
chin rest). Stimuli were presented with E-Prime software (Psychology Software Tools, 6
Pittsburgh, PA, USA). Trials began with a fixation cross presented for 500 ms at the 7
horizontal midline and at the height equivalent to the eye region of the face stimuli. Illusion 8
of movement was accomplished by the successive presentation of a morphed stimulus, 9
followed by the same stimulus in its direct or averted version. The initial intermediate gaze 10
stimuli appeared for a random duration between 600-800 ms followed by its version in direct 11
or averted gaze for 500 ms. The same sequence was used with buildings as a non-social 12
stimulus to control for the direction of perceived motion. Overall participants performed 6 13
blocks of 156 trials. Each stimulus sequence was randomly presented in its direct/centred and 14
averted/deviated conditions, and in the three spatial frequency conditions: broad, high and 15
low. An equal number of building and face trials were shown counterbalanced between 16
direct/centred and averted/deviated conditions. To maintain attention participants were 17
instructed to press a key upon the appearance of a red square superimposed on the stimuli. 18
This occurred in 11.1% of the trials, which were excluded from further analysis. Note that red 19
squares were not filtered, and thus were always presented in broad spatial frequency. 20
2.4.ERP recording and Data analyses
21
Electroencephalographic (EEG) activity was continuously recorded from 60 Ag/AgCl 22
electrodes placed according to the international 10/10 system on a fitted cap (EASYCAP, 23
9 the eyes to detect horizontal eye movements and a third was placed underneath one eye to 1
detect vertical eye movements and blinks. Data was online referenced to the mastoids and 2
acquired at a sampling rate of 1000 Hz. Electrode impedance was kept below 10 kΩ. Data 3
analysis was performed via the Matlab (The Mathworks, Inc., Natick, MA, USA) toolbox 4
EEGLAB (Delorme & Makeig, 2004). Data was offline band pass filtered between 0.1 and 5
40 Hz and an average reference was used. Epochs were created around the second image 6
onset (-100 to 600 ms). Large artefacts or saccades were removed trough visual inspection 7
prior to the use of Independent Components Analysis (ICA) to remove blinks. Number of 8
removed components varied between participants with zero components removed in 5 9
participants due to lack of blinks, 1 component removed in 9 participants, and 2 10
components removed in 1 participant to completely remove blinks. An average of 18.6% 11
trials were rejected per participant. Epochs were baseline corrected using the 100 ms prior to 12
the onset of the second face/building. 13
Two early negative peaks were identified in occipital-temporal areas bilaterally. 14
Channels in occipital-temporal areas were chosen where these peaks were maximal in 15
amplitude (TP7/8, P7/8, PO7/8, Figure 2). The existence of two peaks around this time 16
window has previously been described in a study of biological motion as the N170 and the 17
N240 (Hirai, Fukushima, & Hiraki, 2003). To strengthen the observation and identification of 18
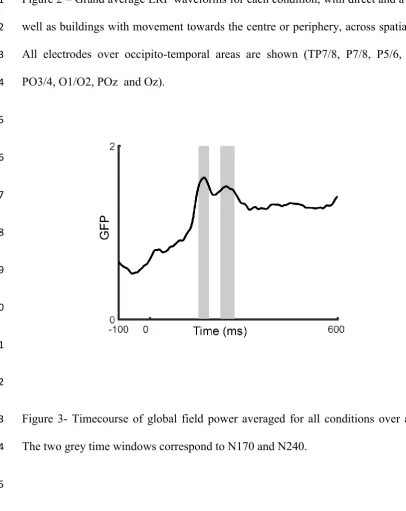
the two distinct components, we used the global field power metric (GFP, Skrandies, 1990) to 19
identify them and select the appropriate time windows (Figure 3; Supplementary material). 20
GFP computes the voltage spatial standard deviation from each electrode’s voltage at each 21
time sample. This provides a single measure for each time point in which a larger signal 22
standard deviation corresponds to more signal strength. The same two separate components 23
were identified via the GFP and time windows were created to encompass them around 50% 24
10 Due to the type of paradigm, in which epochs are centred around the second image 1
onset, the P100 component was very diminished. Nonetheless, an early time window from 90 2
to 125 ms was also considered to analyse possible early effects of gaze direction in the P100 3
component. This analysis was performed in the previously mentioned occipital-temporal 4
electrodes (TP7/8, P7/8, PO7/8). 5
Mean amplitudes for all time windows were calculated per participant, from the 6
pooled data of the selected channels in each hemisphere (Figure 4 for the ERP waveforms). 7
Statistical analysis of the mean amplitudes was carried out using a four-way repeated 8
measures ANOVA with hemisphere (right and left), spatial frequency (broad, low, high), 9
category of stimulus (face and buildings) and direction of motion (towards the centre or 10
periphery) as within-subject factors. When appropriate, post hoc planned comparisons were 11
performed. Violations of sphericity were corrected with the Greenhouse-Geisser correction. 12
Effect sizes for dependent t-tests were calculated using the formula proposed in Eq(3) of 13
Dunlap, Cortina, Vaslow & Burke (1996), to correct for an overestimation of the effect size 14
for paired comparisons. 15
16
3. Results 17
3.1.Behavioural results
18
Accuracy on the detection task was at ceiling level (M=94±3%), with no effect of 19
spatial frequency (F[2,28]=0.62, p=.544, p2=.043), category of stimulus (F[1,14]=0.02, 20
p=.902, ηp2=.001), or direction of motion (F[1,14]=0.02, p=.890, ηp2=.001), or an interaction 21
between any of them. 22
3.2.ERP results
23
3.2.1. P100
11 An interaction between category (face vs buildings) and direction of motion (centre vs 1
periphery) was not observed (F[1,14]=.40, p=.539, ηp2=.03), nor between these two factors 2
and special frequency (F[1,14]=1.56, p=.229, ηp2=.100), showing that no effect of gaze was 3
found in this component. There was only an effect of stimulus category (F[1,14]=7.48, 4
p=.016, ηp2=.348), driven by larger P100 for faces (M=.05 µV) than buildings (M=-.16 µV). 5
6
3.2.2. N170
7
For the N170 component, main effects of hemisphere (F[1,14]=14.50, p=.002, 8
ηp2=.509) and spatial frequency (F[2,28]=15.34, p<.001, ηp2=.523) were significant, driven 9
by larger responses over the right hemisphere (M=-2.00) than the left (M=-.87; p=.002) and 10
smaller responses for LSF stimuli (M=-1.08µV) compared with HSF (M=-1.51µV; p=.004) 11
and BSF (M=-1.72µV; p<.001). 12
Furthermore, an interaction between the category (face vs buildings) and direction of 13
motion (centre vs periphery) was observed (F[1,14]=6.25, p=.025, ηp2=.309), which did not 14
interact with spatial frequency content (F[2,28]=1.05, p=.364, ηp2=.070). Faces with direct 15
gaze (M=-1.66µV) showed a significantly larger negative amplitude than faces with averted 16
gaze (Figure 5, M=-1.41 ±.85 µV; t[14]=2.47, p=.027, Cohen’s d=.274). No effect was found 17
between the direction of motion in the two building conditions (t[14]=-1.52, p=.151, Cohen’s
18
d= -.193). Differences between faces with direct gaze and buildings with centred bar were 19
marginal (t[14]=2.10, p=.054, Cohen’s d=.444). No significant difference was observed 20
between averted gaze and buildings with deviated bar (t[14]=-.064, p=.950, Cohen’s d= -21
.012). An interaction between spatial frequency and category modulated these effects, 22
(F[2,28]=6.63, p=.004, ηp2=.321), with an enhanced processing of high spatial frequency face 23
stimuli (vs. buildings, Figure 6, M= -1.81µV vs. M= -1.22 µV, t[14]=-3.98, p=.001, Cohen’s
12
d=-.632), in the absence of category effects for BSF(t[14]=-.53, p=.602, Cohen’s d=-.149) 1
and LSF stimuli (t[14]=1.09, p=.296, Cohen’s d=.188). 2
3.2.3. N240
3
Main effects of hemisphere (F[1,14]=4.93, p=043., ηp2=.261), spatial frequency 4
(F[2,28]=7.88, p=.002, ηp2=.360) and category were observed (F[1,14]=30.644, p<.001, 5
ηp2=.686) for the N240 component, where larger amplitudes were observed for the right 6
hemisphere (M=-1.66µV) than the left (M=-1.13µv; p=.043), for BSF stimuli (M=-1.75 µV) 7
than HSF (M=-1.06µV; p=.001) and LSF (M=-1.38 µv; p=.047) and for faces (M=-1.93 µv) 8
than buildings (M=-.86 µv; p<.001). Importantly, a three way interaction between spatial 9
frequency, category of stimulus and direction of motion (Figure7, F[2,28]=3.964, p=.030, 10
ηp2=.221) was observed. To interpret this interaction, separate two-way ANOVAS were 11
conducted to analyse the interaction between category and direction of motion in each spatial 12
frequency band. 13
In BSF a main effect of category was observed (F[1,14]=13.47, p=.003, ηp2=.490) 14
with a larger negativity for faces (M= -2.31µV) than buildings (M= -1.19µV). No effect of 15
direction of motion (F[1,14]=3.93, p=.067, ηp2=.219), or an interaction between these two 16
factors was found (F[1,14]=.10, p=.921, ηp 2=.001). 17
Similarly in HSF a main effect of category was observed (F[1,14]=64.71, p<.001, ηp 18
2=.822) with a larger negativity for faces (M= -1.75µV) than buildings (M= -.37µV), in the 19
absence of an effect of direction of motion (F[1,14]=0.75, p=.402, ηp 2=.051), or an 20
interaction between them (F[1,14]=0.001, p=.973, ηp2<.001). 21
In LSF, we observed a main effect of category (F[1,14]=7.56, p=.016, ηp2=.351; with 22
13 of direction motion (F[1,14]=3.93, p=.067, ηp2=.219). However, we also observed a two-way 1
interaction between these factors (F [1,14]=10.08, p=.007, ηp2=.418). Crucially, faces moving 2
to direct gaze (M= -1.98µV) elicited larger N240 amplitudes than faces moving to averted 3
gaze (M=-1.47µV; t[14]=2.44, p=.029, Cohen’s d=.386). Unexpectedly, a difference 4
between the direction of motion in the two building stimuli was also observed (t[14]=-2.47, 5
p=.027, Cohen’s d=-.411). Importantly this difference was in the opposite direction, with 6
buildings with a bar moving towards the periphery showing a larger negative amplitude (M=-7
1.23 µV) than buildings with a bar moving towards the centre (M=-.83 µV). A comparison 8
between faces and buildings with motion towards the centre showed a larger N240 for faces 9
with direct gaze than for buildings with a centred bar (t[14]=3.54, p=.003, Cohen’s d=1.23), 10
while no difference was found between faces and buildings with motion towards the 11
periphery (t[14]=.921, p=.373, Cohen’s d=.335). 12
4. Discussion 13
The present study analysed the importance of LSF and HSF information for the 14
differential processing of direct gaze. Our findings suggest that gaze is processed in two 15
stages, an initial step, corresponding to the N170 component, that is not specifically 16
modulated by the spatial frequency content of the stimuli and a later step, corresponding to 17
the N240 component, which is dependent on LSF information. By contrast, larger N170 18
amplitudes for faces compared to non-faces relied on HSF information, while the larger N240 19
amplitudes for faces was not modulated by spatial frequency manipulation. 20
To our knowledge, the presence of a bifid N2 (i.e. composed by two distinct 21
subcomponents) has not been previously described in studies analysing gaze modulation of 22
the N170 component in adults. Despite this, several studies have shown the time window 23
14 et al., 2007; Myllyneva & Hietanen, 2015; Pönkänen, Alhoniemi, Leppänen, & Hietanen, 1
2011). Furthermore, although not directly reported as such, a similar bifid structure over 2
occipito-temporal areas can also be seen in the results of Conty’s (2007) study, were a larger 3
amplitude for faces with direct gaze was observed over occipito-temporal electrodes between 4
160 and 210 ms. Other ERP studies that analysed gaze processing have looked at occipito-5
temporal electrodes activity in an early time window following N170 (e.g. 160-300 ms 6
Myllyneva & Hietanen, 2015; 190-290 ms, Pönkänen, Alhoniemi, Leppänen, & Hietanen, 7
2010), and found differences between gaze direction in these periods. Taken together these 8
findings support the existence of a second component critical for gaze processing, especially 9
when considering the bifid nature of the GFP wave presently found. 10
4.1.N170 component
11
Overall, larger amplitudes were observed in the N170 component for HSF and BSF 12
than LSF stimuli, possibly related with the importance of HSF for face specific processing. 13
This is consistent with studies reporting larger N170 amplitudes for stimuli containing only 14
HSF information (Hsiao et al., 2005; Nakashima et al., 2008). Nonetheless several studies 15
have reported opposite findings with larger N170/M170 for LSF than HSF stimuli (Goffaux 16
et al., 2003; Goffaux, Jemel, Jacques, Rossion, & Schyns, 2003; Halit, de Haan, Schyns, & 17
Johnson, 2006). Face specific N170 effects in particular, have yielded mixed results either 18
supporting their reliance on LSF information (Goffaux, Gauthier, et al., 2003), HSF 19
information (Nakashima et al., 2008), or reporting no difference between spatial frequencies 20
(Holmes et al., 2005). The use of different spatial frequency bands has been shown to be task 21
dependent (Schyns & Oliva, 1999) and as observed with the N170 component (Goffaux, Jemel, 22
et al., 2003). Similarly, in the present findings, while HSF information seems critical for face 23
15 A limitation of the present study is the use of physically different stimuli, which does 1
not allow to completely disregard possible low level confounds, even though we tried to 2
minimise this issue by matching both contrast and luminance across all categories. Note that 3
no effect of gaze or spatial frequency were found in the P100, the component which would be 4
sensitive to low level features, suggesting that low level confound, if any, would be 5
negligible. 6
7
8
4.2.Gaze effects in N170 and N240
9
A larger N170 negativity for faces with direct gaze than faces with averted gaze 10
replicates the original findings of Conty et al. (2007). Larger amplitudes for direct gaze in 11
this component have been associated with a larger Superior Temporal Sulcus (STS) 12
activation for direct gaze (Conty et al., 2007). These results are also in line with other 13
imaging studies using dynamic gaze shifts that showed a larger STS activation for direct gaze 14
(Ethofer, Gschwind, & Vuilleumier, 2011; Kuzmanovic et al., 2009; Pelphrey, Viola, & 15
McCarthy, 2004). Although it can be argued that the differences found for gaze direction 16
could be linked to the incongruence between direct gaze and averted head position, this 17
seems unlikely given the similar pattern of results for both frontal and oriented faces in an 18
earlier study with a comparable paradigm (Conty et al., 2007). Furthermore, the larger 19
amplitudes for direct gaze shown in the current study cannot be fully attributed to low-level 20
visual features such as direction of motion, since the observed effects in the buildings’ 21
conditions occurred in the opposite direction. The larger amplitude in the N240 component 22
observed for LSF buildings motion towards the periphery compared with the centre was not 23
predicted. This might suggest that the N240 component is particularly tuned to motion 24
16 N200 have been previously shown to be mediated by LSF but not HSF (de Jong et al., 2008). 1
In their experiment, faces initially in direct gaze dynamically changed their gaze leftwards or 2
rightwards, cueing a target in 50% of the trials. In typical participants, they found a larger 3
N200 to LSF faces than HSF faces to correctly cued targets, although this pattern was 4
reversed in participants with autism spectrum disorder (ASD). Combined with the current 5
results, LSF information could be relevant for implicit processing of direct gaze, as well as 6
gaze cueing (de Jong et al., 2008) in a second stage of processing. 7
Interestingly, for LSF stimuli in the N240 peak, only direct gaze faces, and not 8
averted gaze faces, differed from their building stimuli counterparts. Similarly, larger N170 9
amplitudes for faces compared with buildings were marginally observed for faces with direct 10
gaze but were absent for faces with averted gaze. These results give some support to the 11
proposal that faces with direct gaze are a better match to a face template due to the contrasts 12
between iris and sclera in the eye region (Senju & Johnson, 2009). 13
14
4.3. Two stages of direct gaze processing
15
The current results support the existence of at least two stages of gaze processing 16
sensitive to different spatial frequencies. An initial component, N170 was sensitive to direct 17
gaze information but not dependent on low spatial frequency information, while 18
differentiation between gaze directions in a second component, N240, seemed to rely on LSF. 19
This could signify that an initial stage of gaze processing observable by surface EEG relied 20
mostly on cortical pathways independently of magnocellular input, while a later stage, 21
occurring around 225 ms relied on LSF information which could possibly be mediated by 22
amygdala activation (Morris, DeGelder, Weiskrantz, & Dolan, 2001; Vuilleumier, Armony, 23
Driver, & Dolan, 2003). In support of the role of the amygdala for this second component, 24
17 200 ms after stimulus onset (Dumas et al., 2013; Meletti et al., 2012; Sato et al., 2011 but see 1
Huijgen et al., 2015 for a longer cluster of amygdala activation starting from 123 ms until 258 2
ms). Furthermore, considering both the effects on face and gaze processing, these findings are 3
consistent with those reported by Vuilleumier et al. (2003). In Vuilleumier et al (2003) fMRI 4
study, a face identity repetition effect was found in the fusiform gyrus (an area linked with 5
face processing and the N170 component) mediated by HSF while an emotion effect was 6
observed in the amygdala driven by LSF information. 7
Nonetheless, the present data does not provide support for the hypothesis that direct 8
gaze information transmitted through magnocellular inputs enhances face perception, which 9
would be associated with a fast modulation of earlier components of the ERP. Due to the 10
nature of the present paradigm, in which the ERPs are associated with the appearance of the 11
gaze shift, there was a very small P100 component. No difference between gaze direction was 12
identified in the P100, as has been observed in other studies (Berchio et al., 2016; Conty, 13
Dezecache, Hugueville, & Grèzes, 2012). 14
Nonetheless, the current results showed that the selective gaze effect on the LSF 15
condition was observed later, in the N240 component. To understand the neural 16
underpinnings of this later effect further imaging and/or lesion studies are needed. It will also 17
be crucial to develop experimental paradigms that are reliably sensitive to gaze direction in 18
earlier components than the N170, to test whether these earlier ERP components could be 19
modulated by the LSF information. 20
21
5. Conclusion 22
The present study suggests that processing of direct gaze occurs in two stages with the 23
later one being modulated by LSF information. Overall, HSF information appears to be 24
18 component, while LSF information appears to be crucial for gaze discrimination over the 1
N240 component. Future imaging studies combining EEG and fMRI should be conducted to 2
analyse the underlying structures mediating these two stages of gaze processing as well as 3
their function. 4
5
6
6. Acknowledgements 7
IM was supported by Fundação para a Ciência e a Tecnologia (SFRH / BD / 84737 / 2012), 8
AS was supported by a UK Medical Research Council Career Development Award 9
(G1100252), MLS was supported by the Leverhulme Trust (RPG-2013-019) and MHJ by the 10
UK Medical Research Council (MR/K021389/1). 11
7. Conflicts of interest 12
Authors have no conflicts of interest. 13
14
8. Bibliography 15
Bar, M. (2003). A cortical mechanism for triggering top-down facilitation in visual object 16
recognition. Journal of Cognitive Neuroscience, 15(4), 600–609. 17
https://doi.org/10.1162/089892903321662976 18
Bar, M. (2004). Visual objects in context. Nature Reviews. Neuroscience, 5(8), 617–29. 19
https://doi.org/10.1038/nrn1476 20
Bentin, S., Allison, T., Puce, A., Perez, E., & McCarthy, G. (1996). Electrophysiological 21
Studies of Face Perception in Humans. Journal of Cognitive Neuroscience, 8(6), 551– 22
565. https://doi.org/10.1162/jocn.1996.8.6.551 23
Berchio, C., Rihs, T. A., Piguet, C., Dayer, A. G., Aubry, J.-M., & Michel, C. M. (2016). 24
Early averted gaze processing in the right Fusiform Gyrus: An EEG source imaging 25
study. Biological Psychology. https://doi.org/10.1016/j.biopsycho.2016.06.008 26
19 images. Journal of the Optical Society of America. A, Optics, Image Science, and Vision, 1
19(6), 1096–1106. https://doi.org/10.1364/JOSAA.19.001096 2
Burra, N., Kerzel, D., & George, N. (2016). Early left parietal activity elicited by direct gaze: 3
A high-density EEG study. PLoS ONE, 11(11), 1–23. 4
https://doi.org/10.1371/journal.pone.0166430 5
Conty, L., Dezecache, G., Hugueville, L., & Grèzes, J. (2012). Early binding of gaze, gesture, 6
and emotion: neural time course and correlates. The Journal of Neuroscience : The
7
Official Journal of the Society for Neuroscience, 32(13), 4531–9. 8
https://doi.org/10.1523/JNEUROSCI.5636-11.2012 9
Conty, L., N’Diaye, K., Tijus, C., & George, N. (2007). When eye creates the contact! ERP 10
evidence for early dissociation between direct and averted gaze motion processing. 11
Neuropsychologia, 45(13), 3024–3037. 12
https://doi.org/10.1016/j.neuropsychologia.2007.05.017 13
de Heering, A., Turati, C., Rossion, B., Bulf, H., Goffaux, V., & Simion, F. (2008). 14
Newborns’ face recognition is based on spatial frequencies below 0.5 cycles per degree. 15
Cognition, 106(1), 444–54. https://doi.org/10.1016/j.cognition.2006.12.012 16
de Jong, M. C., van Engeland, H., & Kemner, C. (2008). Attentional effects of gaze shifts are 17
influenced by emotion and spatial frequency, but not in autism. Journal of the American
18
Academy of Child and Adolescent Psychiatry, 47(4), 443–454. 19
https://doi.org/10.1097/CHI.0b013e31816429a6 20
Delorme, A., & Makeig, S. (2004). EEGLAB: an open source toolbox for analysis of single-21
trial EEG dynamics including independent component analysis. Journal of Neuroscience
22
Methods, 134(1), 9–21. https://doi.org/10.1016/j.jneumeth.2003.10.009 23
Doi, H., Ueda, K., & Shinohara, K. (2009). Neural correlates of the stare-in-the-crowd effect. 24
Neuropsychologia, 47(4), 1053–1060. 25
https://doi.org/10.1016/j.neuropsychologia.2008.11.004 26
Dumas, T., Dubal, S., Attal, Y., Chupin, M., Jouvent, R., Morel, S., & George, N. (2013). 27
MEG Evidence for Dynamic Amygdala Modulations by Gaze and Facial Emotions. 28
PLoS ONE, 8(9), 1–11. https://doi.org/10.1371/journal.pone.0074145 29
Dunlap, W. P., Cortina, J. M., Vaslow, J. B., & Burke, M. J. (1996). Meta-analysis of 30
experiments with matched groups or repeated measures designs. Psychological Methods, 31
1(2), 170–177. https://doi.org/10.1037/1082-989X.1.2.170 32
Ethofer, T., Gschwind, M., & Vuilleumier, P. (2011). Processing social aspects of human 33
gaze: a combined fMRI-DTI study. NeuroImage, 55(1), 411–19. 34
https://doi.org/10.1016/j.neuroimage.2010.11.033 35
Farroni, T., Csibra, G., Simion, F., & Johnson, M. H. (2002). Eye contact detection in 36
humans from birth. Proceedings of the National Academy of Sciences of the United
37
States of America, 99(14), 9602–9605. https://doi.org/10.1073/pnas.152159999 38
George, N., Driver, J., & Dolan, R. J. (2001). Seen gaze-direction modulates fusiform activity 39
and its coupling with other brain areas during face processing. NeuroImage, 13(6 Pt 1), 40
1102–12. https://doi.org/10.1006/nimg.2001.0769 41
Goffaux, V., Gauthier, I., & Rossion, B. (2003). Spatial scale contribution to early visual 42
20 424. https://doi.org/10.1016/S0926-6410(03)00056-9
1
Goffaux, V., Jemel, B., Jacques, C., Rossion, B., & Schyns, P. G. (2003). ERP evidence for 2
task modulations on face perceptual processing at different spatial scales. Cognitive
3
Science, 27(2), 313–325. https://doi.org/10.1016/S0364-0213(03)00002-8 4
Halit, H., de Haan, M., & Johnson, M. . H. (2003). Cortical specialisation for face processing: 5
face-sensitive event-related potential components in 3- and 12-month-old infants. 6
NeuroImage, 19(3), 1180–1193. https://doi.org/10.1016/S1053-8119(03)00076-4 7
Halit, H., de Haan, M., Schyns, P. G., & Johnson, M. H. (2006). Is high-spatial frequency 8
information used in the early stages of face detection? Brain Research, 1117(1), 154– 9
161. https://doi.org/10.1016/j.brainres.2006.07.059 10
Hirai, M., Fukushima, H., & Hiraki, K. (2003). An event-related potentials study of 11
biological motion perception in humans. Neuroscience Letters, 344(1), 41–44. 12
https://doi.org/10.1016/S0304-3940(03)00413-0 13
Holmes, A., Winston, J. S., & Eimer, M. (2005). The role of spatial frequency information 14
for ERP components sensitive to faces and emotional facial expression. Brain Research.
15
Cognitive Brain Research, 25(2), 508–20. 16
https://doi.org/10.1016/j.cogbrainres.2005.08.003 17
Hsiao, F. J., Hsieh, J. C., Lin, Y. Y., & Chang, Y. (2005). The effects of face spatial 18
frequencies on cortical processing revealed by magnetoencephalography. Neuroscience
19
Letters, 380(1–2), 54–59. https://doi.org/10.1016/j.neulet.2005.01.016 20
Huijgen, J., Dinkelacker, V., Lachat, F., Yahia-Cherif, L., El Karoui, I., Lemaréchal, J.-D., … 21
George, N. (2015). Amygdala processing of social cues from faces: an intracrebral EEG 22
study. Social Cognitive and Affective Neuroscience, nsv048-. 23
https://doi.org/10.1093/scan/nsv048 24
Itier, R. J., & Taylor, M. J. (2004). Source analysis of the N170 to faces and objects. 25
Neuroreport, 15(8), 1261–1265. https://doi.org/10.1097/01.wnr.0000127827.73576.d8 26
Kleinke, C. L. (1986). Gaze and eye contact: a research review. Psychological Bulletin, 27
100(1), 78–100. Retrieved from http://www.ncbi.nlm.nih.gov/pubmed/3526377 28
Kuzmanovic, B., Georgescu, A. L., Eickhoff, S. B., Shah, N. J., Bente, G., Fink, G. R., & 29
Vogeley, K. (2009). Duration matters: dissociating neural correlates of detection and 30
evaluation of social gaze. NeuroImage, 46(4), 1154–1163. 31
https://doi.org/10.1016/j.neuroimage.2009.03.037 32
Latinus, M., Love, S. A., Rossi, A., Parada, F. J., Huang, L., Conty, L., … Puce, A. (2015). 33
Social decisions affect neural activity to perceived dynamic gaze. Social Cognitive and
34
Affective Neuroscience, 10(11), 1557–1567. https://doi.org/10.1093/scan/nsv049 35
Mares, I., Smith, M. L., Johnson, M. H., & Senju, A. (2016). Direct gaze facilitates rapid 36
orienting to faces: Evidence from express saccades and saccadic potentials. Biological
37
Psychology, 121, 84–90. https://doi.org/10.1016/j.biopsycho.2016.10.003 38
Meletti, S., Cantalupo, G., Benuzzi, F., Mai, R., Tassi, L., Gasparini, E., … Nichelli, P. 39
(2012). Fear and happiness in the eyes: An intra-cerebral event-related potential study 40
from the human amygdala. Neuropsychologia, 50(1), 44–54. 41
https://doi.org/10.1016/j.neuropsychologia.2011.10.020 42
21 extrageniculostriate and amygdala responses to presentation of emotional faces in a 1
cortically blind field. Brain : A Journal of Neurology, 124(Pt 6), 1241–52. Retrieved 2
from http://www.ncbi.nlm.nih.gov/pubmed/11353739 3
Myllyneva, A., & Hietanen, J. K. (2015). There is more to eye contact than meets the eye. 4
Cognition, 134, 100–109. https://doi.org/10.1016/j.cognition.2014.09.011 5
Nakashima, T., Kaneko, K., Goto, Y., Abe, T., Mitsudo, T., Ogata, K., … Tobimatsu, S. 6
(2008). Early ERP components differentially extract facial features: Evidence for spatial 7
frequency-and-contrast detectors. Neuroscience Research, 62(4), 225–235. 8
https://doi.org/10.1016/j.neures.2008.08.009 9
Norcia, A., Tyler, C., & Hamer, R. (1990). Development of Contrast Sensitivity in the 10
Human Infant. Vision Research, 30(10), 1475–1486. https://doi.org/10.1016/0042-11
6989(90)90028-J 12
Pelphrey, K. A., Viola, R. J., & McCarthy, G. (2004). When strangers pass: processing of 13
mutual and averted social gaze in the superior temporal sulcus. Psychological Science, 14
15(9), 598–603. https://doi.org/10.1111/j.0956-7976.2004.00726.x 15
Pönkänen, L. M., Alhoniemi, A., Leppänen, J. M., & Hietanen, J. K. (2011). Does it make a 16
difference if I have an eye contact with you or with your picture? An ERP study. Social
17
Cognitive and Affective Neuroscience, 6(4), 486–494. 18
https://doi.org/10.1093/scan/nsq068 19
Pourtois, G., Dan, E. S., Grandjean, D., Sander, D., & Vuilleumier, P. (2005). Enhanced 20
extrastriate visual response to bandpass spatial frequency filtered fearful faces: Time 21
course and topographic evoked-potentials mapping. Human Brain Mapping, 26(1), 65– 22
79. https://doi.org/10.1002/hbm.20130 23
Puce, A., Smith, A., & Allison, T. (2000). Erps evoked by viewing facial movements. 24
Cognitive Neuropsychology, 17(1), 221–39. https://doi.org/10.1080/026432900380580 25
Sato, W., Kochiyama, T., Uono, S., Matsuda, K., Usui, K., Inoue, Y., & Toichi, M. (2011). 26
Rapid Amygdala Gamma Oscillations in Response to Eye Gaze. PLoS ONE, 6(11), 27
e28188. https://doi.org/10.1371/journal.pone.0028188 28
Schyns, P. G., & Oliva, A. (1999). Dr. Angry and Mr. Smile: when categorization flexibly 29
modifies the perception of faces in rapid visual presentations. Cognition, 69(3), 243– 30
265. https://doi.org/10.1016/S0010-0277(98)00069-9 31
Senju, A., Hasegawa, T., & Tojo, Y. (2005). Does perceived direct gaze boost detection in 32
adults and children with and without autism? The stare-in-the-crowd effect revisited. 33
Visual Cognition, 12(8), 1474–1496. https://doi.org/10.1080/13506280444000797 34
Senju, A., & Johnson, M. H. (2009). The eye contact effect: mechanisms and development. 35
Trends in Cognitive Sciences, 13(3), 127–134. https://doi.org/10.1016/j.tics.2008.11.009 36
Skrandies, W. (1990). Global field power and topographic similarity. Brain Topography, 37
3(1), 137–141. https://doi.org/10.1007/BF01128870 38
Vida, M. D., & Maurer, D. (2015). A comparison of spatial frequency tuning for judgments 39
of eye gaze and facial identity. Vision Research, 112, 45–54. 40
https://doi.org/10.1016/j.visres.2015.04.018 41
Vlamings, P. H. J. M., Goffaux, V., & Kemner, C. (2009). Is the early modulation of brain 42
22 information? Journal of Vision, 9(5), 12.1-13. https://doi.org/10.1167/9.5.12
1
von Grünau, M., & Anston, C. (1995). The detection of gaze direction: a stare-in-the-crowd 2
effect. Perception, 24(11), 1297–1313. https://doi.org/10.1068/p241297 3
Vuilleumier, P., Armony, J. L., Driver, J., & Dolan, R. J. (2003). Distinct spatial frequency 4
sensitivities for processing faces and emotional expressions. Nature Neuroscience, 6(6), 5
624–631. https://doi.org/10.1038/nn1057 6
7
8
9
10
Figure 1 – Examples of face and building stimuli in a) BSF, b) HSF and c) LSF. d) 11
[image:23.595.49.503.67.433.2]23 1
2
3
4
5
24 Figure 2 – Grand average ERP waveforms for each condition, with direct and averted gaze as 1
well as buildings with movement towards the centre or periphery, across spatial frequencies. 2
All electrodes over occipito-temporal areas are shown (TP7/8, P7/8, P5/6, PO7/8, P3/4, 3
PO3/4, O1/O2, POz and Oz). 4
5
6
7
8
9
10
11
12
Figure 3- Timecourse of global field power averaged for all conditions over all electrodes. 13
The two grey time windows correspond to N170 and N240. 14
15
16
17
25 1
2
3
4
Figure 4- Grand averaged ERPs for faces with direct and averted gaze as well as buildings 5
with movement towards the centre or periphery. Grand averages were taken from 6 electrodes 6
(TP7/8, P7/8, PO7/8) for each spatial frequency considered. Shadowed areas corresponded to 7
the time windows analysed for N170 and N240. 8
[image:26.595.54.499.74.361.2]9
Figure 5 - Mean amplitudes of the N170 across categories from electrodes TP7/8, P7/8, P5/6, 10
[image:26.595.141.445.480.693.2]26 1
Figure 6 - Mean amplitudes of the N170 across spatial frequencies from electrodes TP7/8, 2
P7/8, P5/6, PO7/8, P3/4, PO3/4, O1/O2, POz and Oz. Error bars with standard error. 3
4
5
6
Figure 7 - Mean amplitudes of the N240 across categories and spatial frequencies from 7
electrodes TP7/8, P7/8, P5/6, PO7/8, P3/4, PO3/4, O1/O2, POz and Oz. Error bars with 8
standard error. 9
[image:27.595.150.443.69.260.2] [image:27.595.111.482.383.554.2]