Papera, Massimiliano and Richards, Anne (2016) Attentional Gain and
Processing Capacity Limits Predict the Propensity to Neglect Unexpected
Visual Stimuli. Psychophysiology 55 (3), pp. 639-649. ISSN 0048-5772.
Downloaded from:
Usage Guidelines:
Please refer to usage guidelines at or alternatively
Attentional Gain and Processing Capacity Limits Predict the
Propensity to Neglect Unexpected Visual Stimuli
Massimiliano Papera* and Anne Richards
Mace Experimental Research Laboratories in Neuroscience (MERLiN), Department
of Psychological Sciences, Birkbeck College, University of London, London WC1E 7HX,
UK
*
Abstract
Exogenous allocation of attentional resources allows the visual system to encode and
maintain representations of stimuli in visual working memory (VWM). However, limits in
the processing capacity to allocate resources can prevent unexpected visual stimuli from
gaining access to VWM and thereby to consciousness. Using a novel approach to create
unbiased stimuli of increasing saliency, we investigated visual processing during a visual
search task in individuals who show a high or low propensity to neglect unexpected stimuli.
When propensity to inattention is high, ERP recording show a diminished amplification
concomitantly with an increase in theta band power during the N1 latency, followed by a
poor target enhancement during the N2 latencies. Furthermore, a later modulation in the P3
latency was also found in individuals showing propensity to visual neglect, suggesting that
more effort is required for conscious maintenance of visual information in VWM. Effects
during early stages of processing (N80 and C1) were also observed suggesting that sensitivity
to contrasts and medium to high spatial frequencies may be modulated by low-level saliency
(albeit no statistical group differences were found).
In accordance with the Global Workplace Model (GWM), our data indicate that a lack of
visual attention resources in the low-level processors may be responsible for the failure to
“ignite” a state of high-level activity spread across several brain areas that is necessary for
stimuli to access awareness. These findings may aid in the development of diagnostic tests
and intervention to detect/reduce inattention propensity to visual neglect of unexpected
When one is performing a resource-consuming visual task, the appearance of an
unexpected stimulus may go undetected. This phenomenon is calledInattentional Blindness
(IB; Jensen, Yao, Street, & Simons, 2011), and exhibiting it may provide an indication of a
general tendency to neglect unexpected visual stimuli in analogous scenarios. Such a
tendency has important implications for areas of human risk assessment (e.g., aviation, rail,
nuclear power plants, surgery; see: Green, 2003; Harris, 2011; Budau, 2011; Musson, 2009;
Paries & Amalberti, 1995), attention, and the conscious awareness of visual stimuli (Mack &
Rock, 1998; Most, Scholl, Clifford, & Simons, 2005; Most et al., 2001). IB can be seen as an
experimentally induced analogue of unilateral visual neglect, albeit functionally-based as
opposed to the lesion-based neglect syndrome, since both are caused by a failure to attend a
given stimulus (Mack & Rock, 1998); therefore IB can lead to a better understanding of the
conditions that are associated with the neglect of visual stimuli. Recently, research has also
shown that the attention deficit hyperactivity disorder (ADHD), a condition characterised by
inattention, excessive motor activity, and impulsivity may be associated with a selective
impairment in visual search behaviour as a result of inattention (Maccari, Casagrande,
Martella, Anolfo, Rosa, Fuentes et al. 2013). Controversially, genetics studies have shown
that the genes that provide a predisposition to ADHD are more ancestral than those that
protect from ADHD, suggesting that in the past traits associated with this disorder may have
be evolutionary advantageous (e.g., seeing an ‘unexpected predator’; Arcos-Burgos et al.,
2010).
Studying individual differences in the propensity to visual neglect allows us to
explore how resources are allocated during visual exploration when selective attention is
modulated by top-down factors (Hannon & Richards, 2010; Richards, Hannon, & Derakshan,
2010; Richards, Hannon, & Vitkovitch, 2010) and saliency-driven capture (Papera, Cooper &
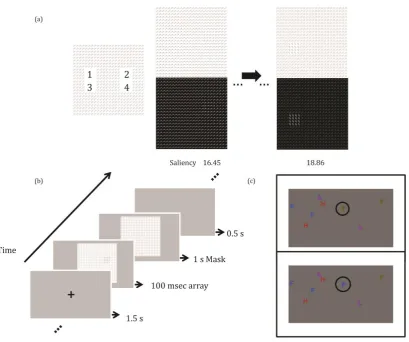
Figure 1 (a) Example images of the Randmorph Task (top) and associated saliency map (bottom; for implementation see Papera, Cooper, & Richards, 2014). The Randmorph Task comprises a set of unique artificial stimuli that have no reference with real-life objects to produce a pop-out effect. Thus, effect of strategic processing can be controlled for. Images with increasingly higher saliency present a more visible pop-out target. Targets were presented four times, once in each of the four locations. (b) Experimental procedure: A fixation cross is presented for 1.5 s and is followed by the test array for 100 ms. This is replaced by a mask for 1 s during which participants can make a response. A blank screen was presented for 0.5 s before the presentation of the next trial. (c) In the IB task, participants track two blue Fs and two green Ts as they move in a linear but randomly around the screen and silently count how many times the Fs and Ts separately hit the frame on the screen but to ignore similarly moving distractors (i.e., orange Hs and purple Ls; see Richards, Hannon, Vohra, & Golan, 2014). Several seconds into the task, a green T unexpectedly turned into a blue F. This was an unexpected, yet task-relevant, change. Participants, who report seeing the
search tasks). Top-down mechanisms can strongly modulate focal attention such that
bottom-up saliency capture becomes very limited (Kiss, Grubert, Petersen, & Eimer, 2012) and
unexpected stimuli may be prevented from gaining access to higher, consciously available,
levels (Dehaene & Changeux, 2005). However, little is known about how early low-level
processors that can prevent unexpected visual stimuli from gaining conscious access. To
control for strategic processing and investigate the sensitivity of early visual processors to
exogenously allocate attention towards low-level visual information, a unique set of novel
stimuli was used (i.e., Randmorphs; a 1 interval forced choice visual search paradigm; see
Figure 1a-b; see also Papera, Cooper, & Richards, 2014; Verma & McOwan, 2009). The
Randmorph Task is a saliency-based pop-out visual search task that makes use of unique
artificially generated target patches of increasing saliency (i.e., increasingly more visible) to
control for familiarity effects. The estimation of the saliency for low-level visual features
(i.e., bottom-up featural aspects such as luminance and orientation) was computationally
determined without human intervention following the approach presented in Papera, Cooper,
and Richards (2014; see also Verma & McOwan, 2009, and methods).
ERP components were measured to investigate activity in low-level processors. First,
is the N1, which is a widespread component that peaks earlier in the frontal areas than the
posterior regions (Mangun & Hillyard, 1991).When observed in posterior regions, it presents
as an increased negative deflection when the location of the stimulus is attended (Luck,
Woodman, & Vogel, 2000) and is modulated by angularity and luminance (Johannes, Munte,
Heinze, & Mangun, 2003); furthermore, its mean amplitude difference between detected and
undetected targets is used as a measure of attentional gain (i.e., amplification) for low level
features (e.g., luminance, orientation, etc.; Luck et al., 2000; see also; Byers & Serences,
2014). Moreover, very early components such as the N80 and the C1 (Jemel, Mimeault,
of luminance and contrast, and are indicators of visual resolution and contrast sensitivity
(Butler, Martinez, Foxe, Kim, Zemon, Silipo et al. 2007).
Next, in the N2 latency, is the N2pc (N2-posterior-contralateral) component, which is
a posterior negative deflection occurring contralateral to the attended visual field, and has
been interpreted as a measure of attentional filtering that suppresses the processing of
competing or irrelevant information (see Luck & Hillyard, 1994ab), and as an indication of
an irregularity detection process that may occur during the presentation of pop-out stimuli
(Berti & Schröger, 2006). This is also associated with awareness; although processes leading
to awareness may be dissociable from attentional processes (Tononi & Koch, 2008), the latter
influences the likelihood of information gaining access to consciousness (He & Raichle,
2009; for top-down modulation of early visual cortices see also: Roland et al., 2006).
Finally, is the P3 component that is thought to reflect task difficulty and
decision-making processing during visual search tasks (Luck & Hillyard, 1990), although its role is
still under debate, since some researchers link the P3 to confidence of the decision making
(Eimer & Mazza, 2005) whereas others relate it to awareness level (Salti, Bar-Haim, &
Lamy, 2012), or even to the current conscious state reflecting visual working memory
(VWM) encoding for further processing (in the form of its contra-ipsilateral waveform:
SPCN, sustained posterior contralateral negativity; see Dehaene & Changeux, 2011;
Robitaille, Marois, Todd, Grimault, Cheyne & Jolicoeur, 2010 ).
By manipulating low-level visual information (i.e., saliency), modulation of ERP
components as well as changes in the power in the time-frequency domain allowed us to
investigate limits in the allocation of attentional resources and see how they affect the
propensity to neglect unexpected visual stimuli. An IB task was used (see Figure 1c) to obtain
external measure for the level of inattention. We predicted that a differential brain response
between the two groups may be identified whilst their brain activity was recorded during the
Randmorph Task, and used to estimate the level of inattention.
Subjects were required to determine the presence or absence of a target-patch, while brain
activity was recorded and used to obtain estimates of attentional gain and overall early brain
response (N1 latency), as well as processing capacity (N2 latency) for varying saliency
values. This allowed us to test the hypothesis that brain areas deployed for the early
processing of visual information (i.e., V1…V4, parietal regions) may be differently
sensitive/efficient to process low-level visual features (i.e., saliency) and this in turn may be
associated with a high or low tendency to inattention. Although the interpretation for the
psychophysical phenomenon of IB is still controversial, one possible explanation for IB is
that it may occur as the result of a processing failure with attentional resources being depleted
by the primary task leaving too few available for processing any unexpected stimulus. This
failure may be due to the power of intrinsic oscillatory activity that prevents visual
information from low-level processor to be granted access to awareness (mainly in theta,
alpha and beta band: see Dehaene & Changeux, 2011; Jensen, Bonnefond, & VanRullen,
2012, Klimesch, 1999). Another possibility is that the unexpected stimulus/change may be
processed but then inhibited and prevented from accessing awareness due to it being
irrelevant to the primary task (Richards, Hannon,Vohra, & Golan, 2014).
IB participants have been shown to allocate resources inefficiently (e.g., attend
distractors for longer than Non-IB) when engaged in a multi-object tracking IB task
(Richards, Hannon, & Vitkovitch, 2010). We therefore predicted that limits in early visual
processing in IB subjects might lead to a reduced or inefficient allocation of resources (i.e.,
latency and diminished N2pc when performing a visual search task, particularly when the
saliency of the targets is low. For example, Schubö, Wykowska and Müller (2007) found a
modulation of the N2pc as a function of the texture segregation complexity (i.e., more visible
targets lead to more negative amplitudes). Furthermore, since IB can be associated with low
working memory capacity (WM, Hannon & Richards, 2010; Richards, Hannon, &
Derakshan, 2010; Richards, Hannon, & Vitkovitch, 2010), WM and visual working memory
(VWM) capacity estimates were obtained using respectively the Automated Operation Span
task (AOSPAN, a general measure of WM; see Unsworth, Heitz, Schrock, & Engle, 2005),
and the SPCN (sustained posterior contralateral negativity), a waveform which has been
observed during conscious maintenance of stimuli in VWM during visual tasks (Dehaene &
Changeux, 2011; Robitaille et al. 2010). Finally, since Papera et al. (2014) found that IB
participants present longer RT during visual search pop-out tasks, we expect IB participants
to present a lower modulation in the P3 latency reflecting a lower level of
awareness/confidence (Eimer & Mazza, 2005; Salti et al., 2012) during target presentation,
particularly for low-saliency targets.
Methods
Participants
Thirty-five undergraduate students (7 males) aged 18 to 43 (mean=26.85; SD=7.62)
took part in the study. All participants were from Birkbeck College, were naive about the
purpose of the research, had normal or corrected-to-normal vision and participated for course
credit. The study was approved by the Committee for Human Research at the Birkbeck
Experimental Paradigm and Stimuli
For the saliency estimation we used the 9-orientation filter saliency model presented
in Papera, Cooper, and Richards (2014), as this produced a better saliency estimation
allowing a finer discrimination of the brain response(compared to a 4-orientation filter
model; Papera, Cooper, & Richards, 2014; Verma & McOwan, 2009). The saliency of
artificial synthesised pictures was obtained using a genetic algorithm (GA) that uses the
saliency model as its fitness function to produce an artificial process of Darwinian selection
in order to maximise/minimise the visibility of the pop-out targets.
Participants performed the Automated Operation Span task (Unsworth, Heitz,
Schrock, & Engle, 2005), the inattentional blindness task and an EEG adaptation of
Randmorph Task (one with a narrower saliency range; see Figure 1a). In the AOSPAN,
participants are presented with a series of maths problems (between 3 and 7 per trial). After
calculating each maths problem a letter is presented that has to be retained until the end of the
trial. Each letter has to be identified in the order in which it appeared by clicking a mouse
over a number matrix displayed on the screen. The maths problems have to be completed
within a given time limit (calculated individually for each participant). A total of 75 maths
problems are presented (in set sizes ranging from 3 to 7) resulting in a score between 0 and
75.
In a standard IB task participants are required to track a series of white Ls and Ts (but
ignore similarly moving black Ls and Ts) as they move randomly on the screen when, after a
few seconds, a moving red cross appears for several seconds (based on Most et al., 2001; see
also Simons, 2003). However, the status of this unexpected stimulus is ambiguous since it is
not clear whether the most appropriate strategy in this task would be to, for example, ignore
Golan, 2014; Hannon & Richards, 2010; Richards, Hannon, & Derakshan, 2010; Richards,
Hannon, & Vitkovitch, 2010). In order to manipulate the status of the unexpected stimulus to
make it relevant during the dynamic task we used a new task in which one of the target
stimuli undergoes an unexpected change directly relevant to the goal (one target, i.e., a green
T, turns suddenly into another type of target, i.e., a blue F). The participants are required to
monitor these two target types independently, and therefore a change in a target is relevant to
the multi-target tracking primary task (e.g., Richards, Hannon,Vohra, & Golan, 2014). This
allowed us to obtain a strong indication of high levels of inattention for those participants
who failed to see the unexpected (yet relevant) change/stimulus; whereas, those who were
able to see the change whilst performing the primary task would show a low level of
inattention. A practice video was used before the presentation of the experimental video (33 s
duration); the practice video involved 4 pairs of blue Fs, purple Ls, red Hs and green Ts
bouncing off a black edge. The experimental video (same duration) that followed comprised
the same set of letters until the change took place (18 s from the start of the video), after
which 3 blue Fs and 1 green T were displayed.
Next, participants performed the EEG version of the Randmorph Task; its suitability
for EEG recordings was first assessed to see whether it could be used with a narrower
saliency range than the one used in Papera, Cooper and Richards (2014; i.e., from a 13.00–
18.70 range to 15.00-19.00), and still produce a good prediction of human performance. The
narrower range of saliency values for the images was found predictive of RT performance
(assessed by regressing RT on saliency: p .001 for both model and predictor).
The new EEG Randmorph Task comprised 2400 trials; each cycle consisted of Target
Present/Absent (TP/TA; 1200) × Left/Right Visual Field (600) × High/Low saliency (300). A
(for details of procedure see: Verma & McOwan, 2009; Papera, Cooper, & Richards, 2014).
Two evenly distributed sets of images were selected (i.e., 150 each), from the population bin:
one ranging between 16.40 and 16.82 (low saliency) and a second one between 18.00 and
19.12 (high saliency). For the analysis of the objective performance (i.e., RTs and accuracy),
the full sets of values were used, whereas a dicotomic categorization was used for the EEG
analysis (i.e., low/high respectively for the first and second set). Images with saliency values
below were not included because the pilot study showed that the targets may be too
difficult to detect for the IB participants. To create two distinct saliency sets, images with
saliency values between 16.82 and 18.00 were excluded. TA images were obtained by
removing the target patch from the TP images and replaced it with a 4×4 patch made with the
distractor Randmorph used in background. Eprime 2.0 was used to present the stimuli
(Schneider, Eschman, & Zuccolotto, 2002). Image presentation was reduced to 100 ms,
followed by the presentation of a mask for 1 s during which participants could provide a
response. After a response was made, the image disappeared and a 500 ms blank screen was
presented before the onset of the next trial. Each image was 22.7 22.9 cm (800 800
pixels subtending 15.84 15.97o angle) with a viewing distance of 80 cm and was presented
on a 22-inch LCD HD monitor (Samsung syncmaster 2233). Participants were instructed to
fixate on the central fixation cross at all times at the beginning of the Randmoprh Task. EEG
activity was inspected online during the task and participants were given verbal feedback at
the end of each block whenever loss of fixation occurred during the familiarisation and
experimental block.
The study was a two-part experiment. First, participants performed the AOSPAN and
then the inattentional blindness task. Next, due to the length of the Randmorph Task (i.e., 2
hours duration split into two sessions by a ten minutes break), the Randmorph task was
EEG recordings
Electrophysiological recordings were obtained from silver electrodes mounted in an
elastic cap (Easy-Cap) with 23 locations according to the 10-20 system (FP1, FP2, F3, Fz, F4,
F7, F8, FC1, FCz, FC2, FC5, FC6, C3, Cz,C4, CP5, CP6, P3, P4, P7, P8, O1, O2). All
electrodes were referenced online to an averaged linked-earlobe. EEG recordings were
filtered with a band-pass at 0.01 to 130Hz and sampled at 500Hz using a SynAmps amplifier
(Neuroscan).
Horizontal electrooculagram (HEOG) measures were collected from 2 locations
placed 1 cm to the right and left of the outer canthi of both eyes and impedances of all the
electrodes were kept below 5KΩ. For the ERP analysis, the continuous EEG during the
presentation of target-present arrays was epoched into 600 ms windows starting 200 ms
before the onset of the array of stimuli and the following mask. (A baseline of a 200ms prior
the onset of the image array was used). Epochs with no eye blinks ( μV), eye
movements ( μV/2°) or amplifier saturation above 100 μV were not analysed. Since
previous findings has shown that the N2pc may result remarkably sensitive to the direction of
the gaze and be the result of eye movement artefact amplification (Lee, Cowan,Vogel, Rolan,
Valle-Incla, & Hackley, 2010), a criterion of 30 μV for eye movements ensured that the target
patch in the target-present pictures would be processed in the relevant contralateral and
ipsilateral hemispheres. These criteria also ensured that mean amplitudes for the contralateral
waveforms during the latency of interested would be below 3 microvolts (Lee et al., 2010).
For the ERSP (event-related spectral perturbations), time-frequency decomposition
was performed to investigate the level of alpha inhibition during the period prior the
presentation of the stimuli arrays and during their visual processing (post-stimulus). To
epoched into 1250 ms windows starting 600 ms before the onset of the visual array and
referenced to a 200 ms baseline 400 ms prior the onset of the stimuli. Due to a wider window
the threshold for eye movements was set to 50 μV.
The power spectrum was obtained using Fast-Fourier transforms with a sliding
latency window of 143 samples (286 ms) wide over the 624 frames (−600 ms prior to
presentation of the visual array to 648 ms after onset). The sliding latency window was
applied 100 times at an average step of 6.24 (approx. 9.52 ms). 2-D ERSP plots resulted in a
39×100 decomposition(i.e., frequency × time), with central times of the 100 sub-windows
ranging between −457 ms and 505 ms, whereas the frequency range of the evenly spaced
frequency bins was from 2 Hz to 40 Hz. To normalise power changes in the time-frequency
domain, log mean baseline power was subtracted. Taking the logarithm scale minimises the
dominance of low frequencies, making the common power spectra more even for all
frequencies analysed (see for instance, Delorme & Makeig, 2004).
Data Analysis and statistics
All statistical tests were performed using the Statistical Package for the Social
Sciences (SPSS) 20.0. Participants with fewer than 17 maths errors on the AOSPAN test
were included in the analysis. For the IB-status classification, participants who, when
questioned immediately after the IB task, explicitly reported seeing the actual transition on
the screen (i.e., a green T turning into a blue F) were classified as Non-IB. Participants who
gave ambiguous reports (e.g., “Something changed but I cannot tell what”) or counted less
than a minimum of 50% of the target hits (Ts and Fs combined) were excluded from further
analysis, whereas all the other participants were classified as IB.
Overall, these criteria led to the exclusion of 8 participants (i.e., 4 participants
errors at the AOSPAN test; 3 participants were not naïve about the phenomenon of
Inattentional Blindness).
For the ERP recordings, analysis was performed using the EEGLAB software
package (http://sccn.ucsd.edu/eeglab/), and custom-made MaTLab™ code. Trials where RTs
were less than 150 ms were excluded from further analysis (also for the behavioural analysis
and time-frequency decomposition). ERPs for the four different conditions under
investigation (low and high TP images both for detected and undetected targets) were
obtained based on the following number of trials: 142 59 (low saliency target detected),
87 (high saliency target detected), 54 (low saliency target undetected), 119 25
(high saliency target undetected). For the ERSPs, the number of accepted trials was on
average 92 and 108 for low and high saliency respectively (trial where targets
were detected/undetected were collated).
Visual inspection of the inter-subject and inter-saliency variability (random effects)
was found consistent within the two groups for RT and accuracy (see Figure 2a-b), and
therefore values across subjects were averaged. Hierarchical fixed–effects regressional
models were carried out separately upon accuracy and reaction time (RT) to assess the effect
of saliency values (300 values) and of the participants’ status (IB/Non-IB).To investigate the
main effect of the groups when the saliency was at its mean value, saliency values were
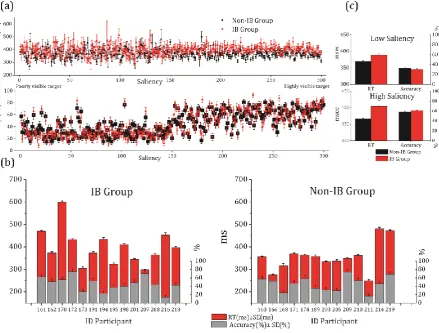
Figure 2 (a) The single trial inter-variability show that values for RT (top panel) and
accuracy (bottom panel) are consistently overlapping within each group (i.e., they are liquid since error bars per each data point share part of their range of variation without major abrupt changes). Moreover intra-variability across trials/saliency levels is not large. (b) Bar charts showing averaged values for reaction time and accuracy during the presentation of low (1 to 150)/high (151 to 300) saliency targets. (c) Consistency is also observed across subjects for accuracy and reaction time. Although the pattern of results is consistent within each group both across trials and subjects, differences can be observed between the two groups. Although minor differences in accuracy are present, most of the IB participants present averaged RT around 375 ms or higher, whereas most of the Non-IBs below this value,
consistently with cut-off values obtained from the ROC analysis (Figure 8b-c). Note: all error bars in part a-b-c depict standard error.
Mixed ANOVAs were performed to evaluate the experimental manipulations. Electrode pairs
O1/2, P3/4 and P7/8 were clustered and used to investigate activity in the posterior regions.
For the ERSPs analyses, the averaged mean amplitude values were obtained from the above
defined cluster for the pre-stimulus latency (-400 ms to 0), and during the post-stimulus
To obtain contralateral waveforms we subtracted the activity in the hemisphere contralateral
from that ipsilateral to the locations of the targets. For the ERSPs, peak amplitude/power in
the regions of interest (ROIs; see results) were obtained by extracting participants’ peak
amplitude/power showing the highest response across frequency-time bins (for a justification
see: Güntekin, Emek-Savaş, Kurt, Yener, & Başar, 2013). Finally, hierarchical fixed–effects
regressions were carried out to assess the predictory power of brain oscillations to elicit
ERPs.
Gain (amplification) during the N1 latency and processing capacity during the N2
latency were calculated by subtracting the mean amplitude difference between the waveforms
elicited when targets were detected and undetected (for examples see Dehaene & Changeux,
2011). For convenience the mean amplitude differences were multiplied by -1, thus positive
values would indicate a higher amplification/capacity that allows to allocate resources
towards the visual field where the target is presented (i.e., efficient allocation of
resources/enhancement of the target); the opposite applies for negative values (i.e., inefficient
amplification/diminished enhancement). However, absolute values for the attentional gain
estimates during the latency of the N1 were used as a measure of amplification independent
from the efficiency. For the overall brain response during the N1 latency, mean amplitudes
were obtained irrespective of target detection and saliency level.
For the brain-behaviour analysis (ROC curves), RT and accuracy (collected during the
presentation of low/high saliency targets), estimates of the attentional gain and overall brain
response (N1), and processing capacity (N2) were analysed. Furthemore, to control for the
effect of age, AOSPAN scores and ERPs/ERSPs measures were submitted to regressional
analyses using age, IB status and their interaction as regressors (see Supplementary
Results
Objective performance
There were no differences between the IBs and non-IBs in either their AOSPAN
scores (t(25) =-.55, p =.58; two-tailed) or number of counts at the primary task during the IB
task (t(25) =-.16, p =.87; two-tailed). A ROC curve analysis was also performed on the
number of counts for the IB task, showing no effects on the likelihood to notice the
unexpected transition (Area Under the Curve, AUC = .51,
).
For the Randmorph Task, accuracy and RTs were assessed separately using linear
regressions as a function of saliency and IB status with Non-IB participants as the reference
category. Table 1 shows the effects of each estimated regressor, their interactions, and
proportion of variance accounted for.
Effects were found for accuracy, RTs, and IB status (see Figure 2c); these confirm
findings from Papera, Cooper, and Richards (2014), who used the Randmorph Task (albeit
with a larger saliency range) to discriminate between individuals showing a high sensitivity
to quickly detect small changes in saliency (i.e., Non-IB individuals), compared to those (i.e.,
IB individuals) who require a higher level of saliency change to achieve a comparable RT
[image:18.595.42.576.495.553.2]performance.
Although significant, saliency appears to have a small effect on RTs (i.e., F(1,598) =
4.75, p < .001; R2 =0.07; see Table 1), whereas IB status affects RTs more strongly (i.e.,
longer RTs; F(1,598) = 86.311, p < .001; R2 = .126). Conversely, accuracy is well predicted
by saliency (F(1,598) = 733.684, p < .001; R2 = .551) with no effect of IB status (p=.95).
Overall IB participants are slower to become aware of the presence of a target when
compared to the Non-IBs, whereas their accuracy to detect targets does not differ largely.
Estimates of behavioural sensitivity ( ) and response bias ( ) were submitted to
mixed ANOVAs. No group differences in sensitivity and response bias were found (see
Supplementary Results).
Early amplification for attended targets
ERPs were analysed using a regional approach (see Methods) in which mean
amplitudes were submitted to mixed ANOVAs with saliency (high, low), target detection
(detected, undetected), lateralisation (contralateral, ipsilateral brain activity relative to visual
field) as within-subject factors, and IB-status (IB, Non-IB) as a between-subjects factor.
Results showed evidence of modulation during the latencies of the N80 and C1, suggesting
an early modulation in the processing of contrast and spatial frequencies at different level of
saliency and depending whether targets were detected or not, albeit differences amongst the
two groups were not significant (these findings are presented and discussed in the
Supplementary Results).
For the N1, a main effect of IB-status and a 4-way interaction (target detection ×
saliency × lateralisation × IB-status) were found (F(1,25)>4.44, p<.05; and
respectively for the main and interaction effects). Follow-up mixed ANOVAs
performed separately for high and low saliency revealed an interaction between target
Figure 3 (a) Grand averages for detected and undetected target: Inset figures show mean amplitude difference between detected and undetected targets (i.e. amplification/gain). Amplitudes are multiplied by -1 so that positive values show efficient allocation of resources. Compared to Non-IB, IB participants inefficiently attend low saliency TP images (top panel), although their amplification is comparable to the one of Non-IB subjects. Conversely when saliency is high (bottom panel) no differences are found in amplification or efficiency. (b) Top panel: Lateralisation of resources during the N2 latency (N2pc) during the presentation of low/high target-present images for when targets were detected or undetected. Mid-Bottom panels: processing capacity waveforms (difference detected/undetected) for low and high saliency in IB and Non-IB participants. Inset graphs show mean amplitude processing capacity during the latency of interest relative to the groups.
The attentional gain for the two groups was obtained to investigate the early
amplification in detected and undetected trials. IB participants presented more negative mean
amplitudes when targets are undetected than when detected: ̅ µV, ̅ .36 µV
(t(25) =2.55, p<.02; two-tailed; see top panel in Figure 3a – inset graph). We interpreted the
are allocated inefficiently since they do not lead to target detection per se. For instance, Van
Voorhis and Hillyard (1977) found that amplitude changes in the N1 occur when attention
was directed to the field in which the stimulus was presented (enhancement, i.e., more
negative), whereas its amplitude was more positive when attention was directed in the field
opposite to the one where the stimulus was presented. This suggests disengagement from the
task when low salient targets are presented, and may be attributable to low sensitivity for
low-level visual features. This is also consistent with poor enhancement in the following
N2pc (see further).
However, both groups present comparable amplification when the absolute difference
between detected and undetected target is assessed (| ̅ | µV, | ̅ | .36 µV;
, ; t(25) =-.03, p=.97; two-tailed). In sum, to consciously report a low-saliency
target, selection during the N1 latency requires higher amplification and efficient allocation
of resources towards the visual field where the target is being presented.
For high saliency targets, only a main effect of group was found (F(1,25)=5.91,
p<.03; ) with no differences in attentional gain ( ̅ , ̅ .06; ,
; t(25) =-.03, p=.97; two-tailed), suggesting that when saliency is high both
detected and undetected targets elicit an equivalent amplification in both groups and no
further resources have to be allocated at this early level of processing in order to select the
target stimulus. Taken together these results are in line with the idea that when low saliency
targets are presented, early visual areas are necessary to amplify a poorly visible target.
Finally, when the overall brain response at this latency was assessed (overall response
in Figure 3airrespective of target detection and saliency, i.e., main effect of the groups), early
( ̅ , ̅ 2.33; , ; t(25) =2.46, p<.03; two-tailed; note:
mean amplitudes were multiplied by -1, i.e. positive values show a stronger brain response;
see Methods).
Role of intrinsic oscillatory activity during early visual processing
A time-frequency decomposition to estimate event-related spectral perturbations
(ERSP) was performed with the aim to investigate cortical changes in oscillatory power and
inter-trial coherence (ITC) measures to assess phase coherence across trials (Figure 4 and 6).
We explored the alpha band range in the pre-stimulus period since its modulation has been
shown to predict performance and awareness of stimuli (Mathewson, Gratton, Fabiani, Beck,
& Ro, 2009; Yamagishi, Callan, Anderson, & Kawato, 2008). Moreover, alpha, beta, and
theta bands during the event-evoked period were also assessed since attentional allocation of
resources is thought to play a multi-band (alpha, beta and theta) effect during visual
processing (Güntekin, Emek-Savaş, Kurt, Yener, & Başar, 2013; Bastiaansen & Hagoort,
2003; Palva & Palva, 2007; Jensen, Bonnefond, & VanRullen, 2012). ROIs were identified
on the basis of previous findings that showed increased alpha power during the period prior
the presentation of a stimulus (Yamagishi et al., 2008), but also in the N1 latency and in later
processing (>300 ms) in a form of a dissociated alpha band modulation (i.e., early/late alpha
enhancement/suppression; Rana & Vaina, 2014; Capilla, Schoffelen, Paterson, Thut, Gross,
2014; see also Palva & Palva, 2007); moreover, modulation in the theta and beta band have
also been found to be respectively indicative of good performance (i.e., encoding the location
of the target stimulus; Bastiaansen & Hagoort, 2003; Klimesch, 1999) and increased visual
attention (Güntekin et al. 2013). Hence, the following ROIs were investigated: pre-stimulus
alpha ( 8-13 Hz in the 400 ms latency prior the onset of the array), and post-stimulus for
theta ( 3-7 Hz in the latency 110-240 ms), alpha and beta ( 8-13 Hz and 14-20 Hz
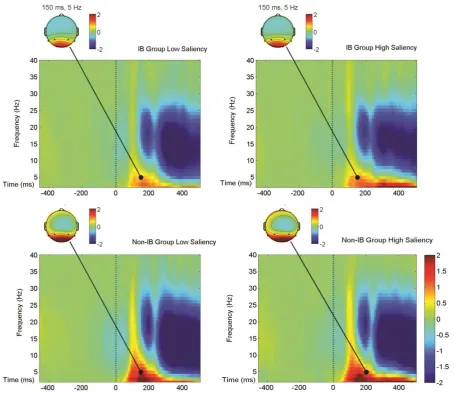
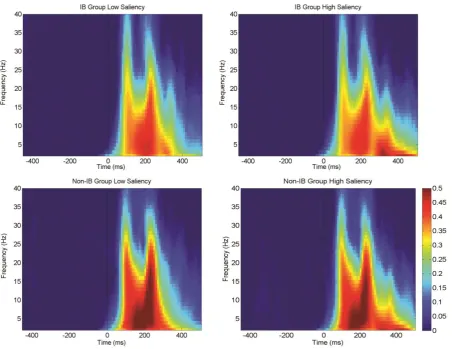
Figure 4 Event-related spectral perturbations (ERSPs) for the group-mean ERSP plots derived from the brain activity observed in the electrode pairs O1/2, P3/4 and P7/8. Spectral power increases are depicted in red whereas decreases in blue. The onset times of the
stimulus array (0 ms) is indicated by a vertical broken line. Data are shown for low (left) and high (right) saliency targets, and for Non-IB (bottom panel) and IB individuals (top panel). The scalp maps are depicted at the ROI t= 150 ms, f= 4 Hz. Permutation statistics were computed from a distribution of 200 surrogate data trials; non-significant values in the output plots ( ) were zeroed and plotted in green.
Power estimates (in dB) for the bands of interest and the level of saliency (low/high)
were submitted to logistic regressions to test whether they were predictive of the level of
estimates of frequency bands can be found in Yamagishi, Callan, Anderson, & Kawato, 2008,
for pre-stimulus period; see also Jensen et al. 2012, for latency after the on-set of the array).
No differences were found during the period that preceded the onset of the stimulus
array, nor in the early and late alpha and beta band after the stimulus onset (all ps>. 11);
however, although not significant, an early transient enhancement (latency 110-190 ms, i.e.,
more power) and a heavier sustained suppression (latency 250-485 ms , i.e., less power)
during the post-stimulus latencies was observed for both alpha and beta bands in the Non-IB
individuals compared to the IB. Following the findings of Capilla et al. (2014), Rana et
al.(2014) and Güntekin et al. (2013) this may be the result of early inhibition of irrelevant
visual information (i.e., target identification) concomitantly with a heavier allocation of
resources at a later stage (>250 ms).
Effects were found for the theta band, whose power significantly predicted the level
of inattention, although no effects of saliency were found ( ( ) .04;
Nagelkerke ; ( )
;
=-.04, p=.93 ), suggesting that for every one unit increase in positive theta power (in dB) the
odds of presenting low level of inattention may be up to 2.24 times higher than with
decreasingly more negative values (i.e., less intrinsic theta oscillatory activity; see Figure 5a).
The model including the interaction term was not significant (p=.10), although the
predictor for theta power remained significant. Since previous findings have shown that
event-related recordings may be the direct results of underlying oscillatory activity (alpha:
Van Dijk, H., van der Werf, Mazaheri, Medendorp, & Jensen, 2010; theta and delta range:
Kayser, & Tenke, 2015), we further investigated this relationship with a linear regressional
analysis to evaluate the predictory power of theta brain oscillations to generate mean
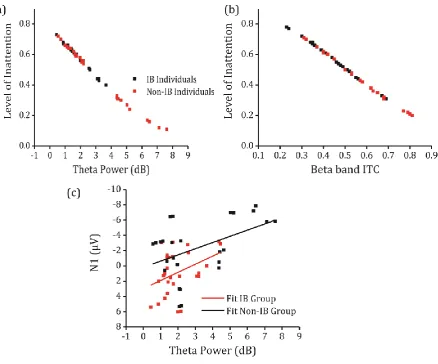
Figure 5 The time-frequency ROI values for the theta band and ITC beta band values were used to predict the tendency to inattention. (a) Predicted probabilities of logistic regression models regressing the level of inattention (tendency to neglect the transition change at the IB task) on the theta power, (b) and on the beta band ITC. (c) Regression assessing the ability of brain oscillations in the theta band to produce cognitively event-related events (N1).
the interaction term IB status × Theta power. Results show that the model including
the regressors IB status and theta power was significant (F(2,51)=13.90, p<.001; ;
; =.30, p<.02; see Figure 5c); more negative mean
amplitudes during the N1 latency were predicted by increasingly theta power. However, no
effect of saliency nor interaction between IB status and theta power were found ( :
F(1,50≤df≤49)<.15, p>.69). This strong association between ERPs and ERSPs brings support
producing event-related activity; see Van Dijk, van der Werf, Mazaheri, Mendendorp, &
Jensen, 2010; Harper, J., Malone, S. M., & Bernat, 2014); furthermore, the IB status predictor
also shows that this modulation may be differentiated in selected niches of individuals such
as IBs and Non-IBs: compared to the same theta power, Non-IB participants produce stronger
event-related potentials that appear to reflect a more abundant availability of resources for
visual processing.
Similarly ROIs for the same bands were carried out to assess the inter-trial coherence
(ITC; ranging from 0.5, non phase-locked, to 1, highly phase-locked) in the latencies 110-190
ms (early alpha and beta), 200-300 ms (late alpha and beta) and 110-240 ms (theta). Results
show that activity in the bands of interest is significantly phase-locked to the presentation of
the target arrays (see Figure 6) and appears to be elicited during the same ERPs latencies of
interest (N1, N2, and P3). Logistic regressional analyses were carried out. A significant
predictor for the beta ITC during the 200-300 ms was found ( ( )
; =-.04, p=.93; Figure 5b), although the resulting
model (main effect of saliency and IB group) was only marginally significant ( ( )
.06; Nagelkerke ). The model including the interaction term was also
not significant (p>.13). Surprisingly, the phase resetting of the beta power in the N2 latency
appears highly phase-locked to the appearance of the target array and may increase the odds
of presenting low levels of inattention by 90 times per one unit increase in ITC. Decreases in
beta oscillatory power have been associated with sensory cortical activation (Güntekin et al.
2013). Analogously to the alpha power, which shows an early increase and later decrease,
beta power may be involved in the early selection (N1) and later processing of visual
information (approx. in the N2 latency; Capilla et al. 2014; Rana et al. 2014; Güntekin et al.
Figure 6 Inter-trial coherence (ITC) for the group-mean ITC plots derived from the brain activity observed in the electrode pairs O1/2, P3/4 and P7/8. The ITC values range between 0 (blue) to >0.5 (red). The onset times of the stimulus array (0 ms) is indicated by a vertical broken line. Data are shown for low (left) and high (right) saliency targets, and for Non-IB (bottom panel) and IB individuals (top panel). Permutation statistics were computed from a distribution of 200 surrogate data trials; non-significant values in the output plots ( ) were zeroed and plotted in blue.
Overall these results show that the amount of resources deployed during early visual
processing (N1) is associated with a tendency to inattention. An intrinsic differential pattern
of activity amongst the two groups can be observed and is consistent with the large effect
observed during the N1 latency irrespective of the experimental manipulations (saliency and
detection of target, see Figure 3a and previous section), the N2 (see next section) and
decreased theta power, suggesting that they are slower to become aware of the target
presence).
Deployment of spatial attention to target objects
Figure 3b (top panel) shows the difference in amplitudes between contralateral and
ipsilateral waveforms (i.e., N2pc) during the presentation of low and high saliency targets.
Mean amplitudes were more negative in the hemisphere contralateral to the presentation of
the target and for high compared to low salient images (Fs(1,25)>8.68, ps<.01; lateralisation:
=.68; saliency: ). In addition, three-way interactions were found: Target Detection
Lateralisation IB (F(1,25)=4.50, p<.05, =.15) and Target Detection Lateralisation
Saliency (F(1,25)=4.10, p=.05, =.14); Target Detection Lateralisation and Saliency
Lateralisation were subsumed but also significant without the third factor: Fs(1,25)>21.26,
ps<.001, =.46 and =.72 respectively). When the target was not detected amplitudes were
significantly more positive suggesting a poor allocation of attentional resources; this is
consistent with the idea that the brain response during the N2pc reflects an in-depth
attentional analysis of the visual information (Kiss, Grubert, Petersen, & Eimer, 2012).
Since the N2pc has often been reported as a measure of attentional
sensitivity/selectivity (for overviews see Woodman, Kang, Rossi, & Schall, 2007; Eimer,
1996), we estimated the processingcapacity: a measure of target enhancement (see
Methods). This resulted in IB participants having poor processing capacity at the Randmorph
Task for low compared to high saliency targets; conversely, Non-IB participants present a
higher processing capacity than IBs, in that enhancement of the N2pc is larger for both low
and high saliency targets (Figure 3b – mid and bottom panel). This may enable Non-IB
individuals to use part of these extra resources to capture a possible unexpected
Estimates of processing capacity were analysed in an ANOVA, with saliency as
within-subject factor and IB-status as between factor. A main effect of saliency (marginal
effect: F(1,25)=4.10, p=.05, =.14) and IB-status (F(1,25)=4.50, p<.05, =.15) with no
interaction was found (F(1,25)=.16, p=.68), suggesting that the differences in processing
capacity are intrinsically due to a differential brain response to saliency in IB and Non-IB
individuals rather than saliency per se. Post-hoc t-tests showed that capacity does not differ
across the two groups when the saliency of the images is high (t(25) =1.37, p =.18;
two-tailed), whereas a difference is present between the two groups when saliency is low (t(25)
=2.22, p <.05; two-tailed), suggesting that participant’s capacity varies as a function of the
sensitivity to low-level visual features. A Further analysis excluded the possibility of a
motor-planning contamination of the N2pc (for a justification Wykowska & Schubö, 2012; this
analysis is presented in the Supplementary Results).
Maintenance of stimuli in visual working memory
A mixed ANOVA was performed on the P3 mean amplitudes using the same factors as
outlined above. Significant effects were found for high compared to low saliency targets and
for detected compared to undetected targets. An interaction between saliency and target
detection was also found (Fs(1,25) 32.76, p .001, =.74, =.65 and =.56 respectively
for saliency, target detection and their interaction; see Figure 7a).
Post-hoc t-tests confirmed that mean amplitudes are significantly higher for both high and
low saliency detected targets (t(26)<3.64, p<.01, two-tailed, Cohen's ds: .7, low saliency;
Figure 7 (a) ERPs averaged across the electrode pairs P3-4, P7-8 and O1-2 showing an enhanced P3 when high/low targets were detected (relatively to undetected targets). (b) Overall effects of lateralisation during the P3 latency (irrespective of response and level of saliency): compared to the Non-IB group, IB participants present evidence of lateralisation during the presentation of the low/high saliency targets. Difference between contralateral and ipsilateral waveforms (SPCN) are also depicted.
detected and saliency is high. Studies have controversially linked higher mean amplitudes
during the P3 latency to a higher level of confidence (Eimer & Mazza, 2005) or awareness of
the stimuli presented (Salti, Bar-Haim, & Lamy, 2012), making its interpretation ambiguous
(see Discussion).
Although P3 mean amplitudes were not different between the two groups
(F(1,25) .86, p=.36, =.03) When lateralised brain activity associated with VWM was
isolated from the P3 latency common source (i.e., SPCN; Robitaille, Marois, Todd, Grimault,
Cheyne & Jolicoeur, 2010), group differences in the access to visual working memory were
revealed (see Figure 7b and Supplementary Results). SPCN has been observed in visual
search tasks that require conscious maintenance of visual information in VWM for target
Brain-behaviour indicators may be used to predict propensity to inattention?
IB research suffers from a lack of repetition since following an exposure to an
unexpected stimulus/change event the subject may have the expectation of another similar
event, which renders the following trial a divided attention task rather than an IB task per se.
In an attempt to address this inherent problem with IB research, we examined whether ERPs
and objective performance on the Randmorph Task are predictive of IB-status. For the ERP
components, a ROC analysis was performed using mean amplitudes during the posterior N1
(amplification and overall brain response), the N2 (processing capacity), and objective
performance (RT and accuracy) to identify the optimum cut-off values for the above neural
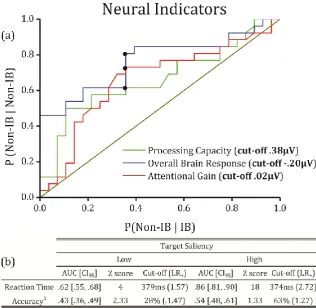
and behavioural indicators. Results show that the area under the ROC curve (AUC) for
processing capacity, overall brain response (N1) and attentional gain (amplification) are
respectively .66 ( ), .76 (
) and .65 ( ). Optimal cut-off values for sensitivity
and specificity were identified for the three estimates (circled in Figure 8a), suggesting that
increasingly more positive values augment the tendency to see unexpected stimuli/changes by
1.74, 2.28 and 2.08 times (Positive Likelihood-Ratio, ) respectively for processing
capacity, overall brain response and amplification. Furthermore, behavioural performance
showed a high discriminatory power for RTs for both low and high saliency targets (p<.001),
whereas an effect for accuracy was found only for low saliency (p<.05) but not for high
saliency targets (p=.17; see Figure 8b-c). In summary, IB and Non-IB individual differences
in the visual processing when performing the Randmorph Task may be indicative of a
tendency to inattention as a result of poor brain response and inefficient amplification (N1),
but also low processing capacity (N2pc), making IB subjects less likely for the attentional
Figure 8 (a) ROC curves for the three identified neural indicators show that IB and Non-IB participants have a differential brain response that may lead to a difference propensity to identify/neglect
where UAC <.50 and therefore the interpretation is reverse, i.e., tendency to be Non-IB. Please see footnote at the bottom table). (c) Estimated ROC curves for accuracy and reaction times during the presentation of low and high saliency targets.
Discussion
Attentional limits influence the access of visual stimuli to awareness
Our results offer new insights into the brain mechanisms that may lead to the neglect
of unexpected visual changes/stimuli in IB individuals. The present study shows that saliency
estimation of low-level visual information may potentially be used in an EEG task as an
alternative to the standard dynamic IB task to test indirectly for the propensity to inattentional
blindness. This may be useful when participants are familiar with the phenomenon of IB
(thus having expectations on the occurrence of unexpected stimuli), and also overcomes the
inherent problem of the lack of repetition in IB research. We predicted the incidence of
inattentional blindness by computationally manipulating low-level-feature based saliency that
allowed us to estimate the differential allocation of attentional resources during visual search
for the N1, N2 and P3 latencies. Overall, For N1/2, more negative amplitudes were more
likely to be associated with target detection provided participants were efficiently allocating
resources. For instance, during the presentation of the low saliency images, IB participants
tend to allocate resources inefficiently since more negative amplitudes are observed when
low saliency targets are not detected. This is also confirmed by the following poorly
enhanced N2pc (i.e., Figure3bmid and bottom panels), suggesting that during the N1 targets
may not be selected, thus the enhancement of the target is largely diminished.
Results for the Randmorph Task have shown that IB and Non-IB individuals had
comparable behavioural performance yet the Non-IBs appeared to have a resource surplus as
the N1 which is more likely to be the result of target selection, since the following N2pc
amplitude is also largely enhanced. This appears to be in line with the hypothesis of the
Global Network Workspace (GNW) proposed by Dehaene and Changeux (2005; 2011).
Unexpected stimuli may be poorly selected in IB individuals during an early stage and this
activity does not reach a dynamic threshold (a form of stochastic phase transition) that
“ignites” allocation of resources during the N2 to achieve a synchronous spread of activation
across several brain areas reflecting on-going conscious content (Dehaene & Changeux,
2011). Furthermore, intrinsic brain oscillations in the on-going activity (including gamma and
beta bands, but also alpha and theta band: see Palva & Palva, 2007; Jensen, Bonnefond, &
VanRullen, 2012) can prevent ignition by increasing this threshold, resulting in a purely
feed-forward propagation that dies out with no ignition (for example a higher level of alpha power
in the low level visual processors such as the N2 latency).
Our study showed differences in alpha power were not significant (p=.11 and .33
respectively for early and late alpha power ERSPs), although a trend can be observed with
higher alpha power in IB participants, and maybe had an influence on some ERP components
(e.g., N2 latency) and reduced detection rates, consistently with the Dehaene and Changeux’s
(2011) framework. Nonetheless, theta power was found to influence the likelihood to detect
unexpected changes; low power in the theta band at a low level appears to be associated to a
lower deployment of resources (and alertness) and might be the reason why ignition for an
unexpected stimulus in IB participants may be prevented. When enhancement (N2) of an
unexpected sensory visual stimulus does not occur all the available resources may be
allocated towards the expected target (i.e., no surplus of resources). Conversely, in Non-IB
subjects, extra resources may be captured by a concomitant unexpected stimulus, allowing
both stimuli to cross the threshold for ignition and gain access to awareness. Assuming that
have the consequence of allowing the visual system to select and enhance targets as well as a
possible unexpected but relevant change/stimulus.
There are two results that support this conclusion. First, the response of the
participants is not a systematic motor response bias. Contrary to the findings of Wykowska
and Schubö (2012) who showed a facilitation of the N2pc was due to motor-planning during
a visual search task, we found that mean amplitudes for detected and undetected targets
during this latency are comparable when no targets were presented (i.e., there is no
facilitation). This suggests that a motor response effect, if any, would not be affected by the
type of response (i.e., yes/no). Secondly, during the N1 the mean amplitude relation between
detected and undetected targets appears to be consistent even when it is reversed (i.e., more
negative mean amplitudes for when a target is undetected), since it shows that despite
resources may be allocated towards the visual field where the target is not presented (and
consequentially decreasing the likelihood of detecting a target), its absolute difference is still
a measure of amplification, although allocated inefficiently. For instance, during the N1, IB
subjects appear to allocate their resources inefficiently when saliency is low, suggesting
disengagement/mind-wandering that may be due to poor resolution in the citoarchitecture of
those early visual areas devoted to the analysis of orientational, spatial and luminance
features (i.e., the visual system fails to find a pop-out). These differences may be reflected by
modulation of the N80 and C1 components (see section ‘Early Visual Evoked Potential’ in
Supplementary Results; see also Butler, Martinez, Foxe, Kim, Zemon, Silipo et al. 2007;
Jemel, Mimeault, Saint-Amour, Hosein, and Mottron, 2010). However, future research
should disambiguate whether the modulation of these components is the direct result of an
early sensitivity (higher in Non-IB participants), and if these effects are subject to attentional
Differently, Richards, Hannon,Vohra, and Golan (2014), proposed that an irrelevant
unexpected stimulus/change may be processed and then inhibited since it is not relevant to
the goal of the task. However, in the current study the unexpected change was directly
relevant to the task (i.e., a distractors turns into a target, thereby becoming part of the primary
task), and therefore IB participants may have neglected this change as a result of a poorer
processing capacity that prevented the stimulus from being processed and accessible to
conscious report (rather than its status per se).
Dehaene and Changeux’s (2011) explanation appears to be also consistent with the
possible connection between IB and ADHD. For instance, Sauseng, Klimesch, Stadler,
Schabus, Doppelmayr, Hanslmayr et al., (2005) discuss that prefrontal alpha synchronisation
may reflect top-down inhibition of the frontal areas in order to avoid these areas becoming
involved in distracting new activities whilst a task is performed. This may also reflect in
lesser feedback modulation towards the posterior areas to prevent the processing of
unexpected incoming stimuli. In this sense, albeit Non-IB subjects maintain a good
performance at the task at issue and have a larger capacity, they may be more easily
“distracted” by incoming unexpected stimuli at no expense in performance (e.g., counts at the
IB task did not differ amongst groups); Bresnahan, Anderson and Barry (1999) found that
EEG of individuals with ADHD are characterised by increased theta activity that may be
linked to impulsivity (see also the Supplementary Discussion for potential genetic links to the
tendency to inattention). Our time-frequency analysis showed that for every unit increase in
theta power Non-IB individuals present a heavier deployment of resources during the N1
(i.e., more negative amplitudes). Early theta and alpha band together with later alpha activity
may be crucial to modulate the level of inattention (Jensen et al., 2012; Klimesch, 1999; see
Bastiaansen and Hagoort, (2003) proposed that theta activity is related to changes in
the cortico-hippocampal loops for both sensory and memory tasks, in that they both require
use of VWM. They claim that theta activity observed in scalp-recorded EEG may provide a
reflection of this activity at the cortical end of the loop. Hence, theta power increases after the
presentation of targets should reflect an increase in activity in hippocampal–parietal circuits
during the encoding of the target location. However, another explanation that accounts for
this increase in theta power is the one proposed in Von Stein and Sarnthein (2000),
suggesting that theta activity may be the result of an interaction between distal brain areas
(e.g. frontal and posterior) during visual-spatial WM activity and conscious detection (Pins &
Ffytche, 2003). According to this view the N1 may emerge from a phase-reset of the
on-going oscillatory theta (and also alpha) band caused by the incoming visual stimulus (see also
Jensen, Bonnefond, & VanRullen, 2012); this in turn would elicit the deployment of
top-down resources from high-order areas leading to an enhancement of the N1 (Makeig,
Westerfield, Jung, Enghoff, Townsend, Courchesne et al. 2002). This also raises the question
that the sensitivity to low-level visual features as reflect as early visual evoked potentials
(N80 and C1) may be involved in the theta phase-reset. Similarly, the N2 may be subject to
analogous influences: alpha power during this latency may drive a multi-band change of
activity linked to early top-down modulation for preparing early visual processors to receive
visual inputs (Yamagishi, Callan, Anderson, & Kawato, 2008).
Palva and Palva (2007) discuss the subject of brain oscillations and report a series of
studies on the role of theta band, where it was found synchronised with alpha and beta during
stimulus processing and in response to task workload (see [11, 60] as cited in Palva & Palva,
2007). Moreover, neural correlates of consciousness are known to involve the formation of
assemblies ([28, 58, 71, 75] as cited in Palva et al., 2007) via recurrent processing from
an interaction between sensory (low level) and fronto-parietal (higher level) regions that
produces access of visual information to consciousness. Cell assemblies during the N1
latency may receive incoming top-down recurrent feedback resulting in a stronger
enhancement of this component ([25, 29] as cited in Palva et al., 2007). For instance,
behavioural performance in our study shows that reaction times are shorter for Non-IB
participants. If one is willing to assume that reactions are the reflection of the speed at which
a participant becomes aware of the target stimulus, then our results might be consistent with
this view.
Similar accounts have also been proposed by Capilla et al. (2014) and Rana et
al.(2014) where two modulations are produced by two different sources: a parietal-occipital
source reflecting location-based attention and a ventro-lateral extrastriate region processing
the visual features of the incoming sensory stimulus. One possible problem with this
interpretation is that IB participants may be more likely to present attentional lapses and/or be
less motivated to perform the task as a result of their lesser attentional span; IB participants
find it harder to see targets in the Randmorph task than Non-IBs, as indexed by their slower
RTs, and sub-sequentially may withdraw from performing the task. Although in our study
there was no evidence that the two groups differed in motivation (i.e., accuracy at the primary
task in the IB task was comparable, and although significant, differences in performance at
the Randmorph task were not large), this may confound the results. Finding it hard to detect
targets may favour mind wandering during their presentation. Mind wandering can elicit a
high–level oscillatory activity that prevents sensory stimuli to enter the broad network
responsible for awareness (see also: Dehaene & Changeux, 2011). Since performing a task
with a high financial reward for performance will engage the attentional system stronger and
with longer duration than performing the same task with no overt reward for performance
rewarding the participants on the basis of the trials correctly performed to ensure a high
motivation at all times. This appears to improve the brain processing at a subliminal level
(see for instance Pessiglione, Schmidt, Draganski, Kalisch, Lau, Dolan, & Frith, 2007), and
also may help to test whether oscillatory activity is genuinely intrinsic to the brain processing
and not the result of lack of motivation. Motivation has been shown to be related to an
increased power in the theta band that results from the early discrimination (0-600 ms
post-stimulus) of emotionally salient stimuli (positive or negative; Aftanas, Reva, Varlamov,
Pavlov & Makhnev, 2004; see also: Aftanas, Varlamov, Pavlov, Makhnev, & Reva, 2001).
Processing appears to be time-locked with synchronized theta activity (Aftanas et al., 2001).
Randmorphs may be experienced not only visually salient stimuli but also emotionally salient
when a participant detects them. This may drive a stronger response in Non-IB participants as
a result of their higher sensitivity to detect small changes in saliency of low-level visual
features. Taken together these results show that theta activity may reflect a general state of
brain alertness or heightened vigilance in the visual areas (hence better performance) that
may decrease tendencies to inattention in situation of sustained attention.
This may also be consistent with the observation that P3 amplitudes (analogously to
the N1), a component that has been controversially interpreted as reflecting conscious
awareness (Salti, Bar-Haim, & Lamy, 2012) and confidence/perceptual task demands (Eimer
& Mazza, 2005; Schubö, Wykowska, & Müller, 2007), may be modulated by theta
oscillations (see for instance, Bresnahan et al., 1999), suggesting a role in saliency detection
that may be associated with high confidence/awareness of visual stimuli. We found no
significant differences in the modulation of the P3 between IB and Non-IB participants
(although a different trend in the two groups was observed for the P3; see Figure 7b);
however, the P3 appeared strongly influenced by target detection and saliency. Salti et al.
modulated, supporting the idea the P3 is associated with conscious perception rather than a
reflection of the confidence of the participant’s decision.
When P3 contra- and ipsilateral waveforms were investigated (i.e., SPCN), our results
showed a difference in the overall level of awareness between IB and Non-IB as interpreted
in Dehaene and Changeux (2011; Rockstroh, Müller, Cohen, & Elbert, 1992). The
modulation of the SPCN found in IB participants may be associated with more effort to
maintain a conscious VWM representation of the targets (recruitment of a smaller
sub-population of neurons/global inhibition) and not with their memory capacity, since no
differences were found in the AOSPAN test, a measure that (amongst others: Jost, Bryck,
Vogel, & Mayr, 2010) has been found to correlate with ERP components thought to reflect
VWM capacity (e.g., Contralateral Delay Activity observed during change detection tasks;
see for instance McCollough, Machizawa & Vogel, 2007). However, because of
inconsistencies amongst previous findings the hypothesis proposed in Rockstroh, Müller,
Cohen and Elbert (1992; global inhibition hypothesis; see Supplementary Results; see also
Dehaene & Changeux, 2011) still remains an unproven hypothesis in terms of a direct link
between the scalp recorded activity signalling excitation/inhibition and respectively when
negative or positive deflections are observed; this is still nowadays opposed to the enhanced
perception hypothesis (i.e., a global temporary increase enhance the processing of stimuli; see
for instance Brown, van Steenbergen, Band, de Rover & Nieuwenhuis, 2012).
Implications in human risk assessment and interventions
The present study provides strong evidence that poor selection (N1) and subsequent
diminished enhancement (N2) may be associated with a tendency to neglect an unexpected
stimulus/change. Although this is informative in characterizing the extent of the brain
response in IB and Non-IB individuals, it is a correlational measure and cannot be used to