RESEARCH ARTICLE
Gli3 in fetal thymic epithelial cells promotes thymocyte positive
selection and differentiation by repression of
Shh
Anisha Solanki1, Diana C. Yanez1, Susan Ross1, Ching-In Lau1, Eleftheria Papaioannou1, Jiawei Li1,
JoséIgnacio Saldaña1,2and Tessa Crompton1,*
ABSTRACT
Gli3 is a Hedgehog (Hh)-responsive transcription factor that can function as a transcriptional repressor or activator. We show that Gli3 activity in mouse thymic epithelial cells (TECs) promotes positive selection and differentiation from CD4+CD8+to CD4+CD8− single-positive (SP4) cells in the fetal thymus and that Gli3 repressesShh. Constitutive deletion ofGli3, and conditional deletion ofGli3from TECs, reduced differentiation to SP4, whereas conditional deletion ofGli3from thymocytes did not. Conditional deletion ofShhfrom TECs increased differentiation to SP4, and expression of Shh was upregulated in the Gli3-deficient thymus. Use of a transgenic Hh reporter showed that the Hh pathway was active in thymocytes, and increased in the Gli3-deficient fetal thymus. Neutralisation of endogenous Hh proteins in theGli3−/−thymus restored SP4 differentiation, indicating that Gli3 in TECs promotes SP4 differentiation by repression of Shh. Transcriptome analysis showed that Hh-mediated transcription was increased whereas TCR-mediated transcription was decreased in
Gli3−/−thymocytes compared with wild type.
KEY WORDS: Shh, Gli3, Fetal thymus, Positive selection, CD4, T-cell development, Thymocyte, Thymic epithelial cell (TEC), Mouse
INTRODUCTION
Gli3 is a member of the Hedgehog (Hh)-responsive Gli family of transcription factors, mammalian orthologues of theDrosophilaCi protein (Ramsbottom and Pownall, 2016). The Gli proteins bind DNA in a sequence-specific manner, but have evolved different functions and distinct temporal and tissue-specific expression patterns. Gli3 can be processed to be a repressor of transcription (Gli3R) in the absence of Hh signalling, or an activator (Gli3A) upon Hh signal transduction (Sasaki et al., 1999). During development it can function before the expression of Hh genes, independently of Hh. In many tissues, Gli3R limits Shh signalling, Gli3R and Shh have opposing functions, and Gli3 deficiency and Shh deficiency result in opposite phenotypes (Hager-Theodorides et al., 2005; Shah et al., 2004; Solanki et al., 2017; te Welscher et al., 2002; Wang et al., 2000).
During αβ T-cell development in the thymus, CD4− CD8− double-negative (DN) cells differentiate to CD4+ CD8+
double-positive (DP) cells, which give rise to both CD4 single-double-positive (SP4) and CD8 single-positive (SP8) populations. Gli3 is expressed in adult and fetal thymic epithelial cells (TECs) and fetal but not adult thymocytes, and Gli3 promotes pre-T-cell receptor (TCR)-induced differentiation from DN to DP cell, and negative selection of the TCR repertoire (Barbarulo et al., 2016; Hager-Theodorides et al., 2005, 2009; Saldaña et al., 2016). Here, we investigate Gli3 function duringαβT-cell development in the embryonic thymus at the transition from the DP to SP cell.
Maturation from DP to SP follows successful rearrangement of the Tcra locus, and requires TCR signalling: positive selection results in appropriate MHC restriction of SP cells, followed by negative selection of potentially self-reactive clones (Klein et al., 2014; Starr et al., 2003). Many models have been proposed to describe how DP thymocytes commit to the SP4 and SP8 lineages, and how positive selection ensures that selected SP4 and SP8 populations express TCR appropriately restricted by MHCII and MHCI, respectively (Carpenter and Bosselut, 2010; Starr et al., 2003). The strength and duration of the TCR signal that a developing cell receives broadly determine its fate, with the strongest signals leading to negative selection, usually at the SP stage in the medulla (of TCR recognising self antigens), intermediate signals leading to positive selection, and weaker signals or lack of TCR signalling leading to cell death by neglect (Singer et al., 2008). For DP thymocytes undergoing positive selection, again TCR signal strength and duration influence SP4 and SP8 lineage choice. Those cells receiving stronger longer TCR signals tend towards the SP4 fate, weaker/more transient signals favour differentiation to SP8 SP, and additionally SP4/SP8 fate decisions may be influenced by the relative timing of cytokine signalling and TCR signalling that a developing cell receives (Bosselut, 2004; Klein et al., 2014; Starr et al., 2003). TCR signal strength and duration are dependent on avidity of the TCR for its ligand (and therefore on the TCR sequence), and may also be affected by other intracellular or extracellular influences on TCR signal transduction, in addition to cytokines. Thus, local thymic stromal factors, including Notch and morphogen signalling, may also influence SP lineage choice and selection (Brugnera et al., 2000; Crompton et al., 2007; Laky and Fowlkes, 2008; Park et al., 2010; Takahama, 2006). Several lineage-specific transcription factors are required for the SP4/SP8 lineage decision, including ThPok (Zbtb7b), Gata3, Runx1, Runx3 and Mazr (Carpenter and Bosselut, 2010; Naito et al., 2011). The ways in which the transcriptional regulation of lineage commitment and differentiation relate to extracellular signalling molecules and TCR signal transduction require further study.
In the thymus, Shh is expressed by TECs in the medulla and corticomedullary junction, and is required for normal medullary TEC development and maturation (El Andaloussi et al., 2006; Outram et al., 2000; Sacedón et al., 2003; Saldaña et al., 2016). Received 11 November 2016; Accepted 3 January 2018
1UCL GOS Institute of Child Health, 30 Guilford Street, London WC1N 1EH, UK. 2School of Health, Sport and Bioscience, University of East London, London E15 4LZ, UK.
*Author for correspondence ([email protected]) T.C., 0000-0002-8973-4021
This is an Open Access article distributed under the terms of the Creative Commons Attribution License (http://creativecommons.org/licenses/by/3.0), which permits unrestricted use, distribution and reproduction in any medium provided that the original work is properly attributed.
DEVEL
TECs provide MHCpeptide ligands for developing thymocytes and are required for both positive and negative selection of the TCR repertoire (Klein et al., 2014).
[image:2.612.83.523.56.680.2]Gli3R can suppress Hh pathway activation by at least two mechanisms. First, it can repress the expression ofHhgenes in the Hh-secreting cell, hence reducing the overall Hh protein Fig. 1.See next page for legend.
DEVEL
concentration in a tissue. Second, expression of Gli3 in the signal-receiving cell will be processed to Gli3R in the absence of Hh proteins, which will transcriptionally repress Hh target genes.
In the thymus stroma, Gli3 has both independent and Hh-dependent functions, and Gli3 deficiency leads to Hh-Hh-dependent upregulation of the Hh target geneGli1(Hager-Theodorides et al., 2009). In the fetal thymus, Gli3 deficiency leads to reduced pre-TCR-induced differentiation from DN to DP, whereas Shh deficiency leads to the opposite phenotype (Hager-Theodorides et al., 2005; Rowbotham et al., 2009). Later in T-cell development,Gli3mutation reduces negative selection and influences the transcriptome of fetal thymus stromal cells (Hager-Theodorides et al., 2009). Stromally expressed genes influenced by Gli3 mutation include Hedgehog-interacting protein (Hhip),Rbp1,Cxcl9andNos2. This suggested that Gli3 might influence negative selection through regulation ofNos2 (Hager-Theodorides et al., 2009).
Here we show that Gli3 expressed in TECs promotes positive selection and maturation from DP to SP T-cell by suppression of Shhexpression in TECs, and that Shh signals directly to developing T-cells to modulate TCR-mediated signalling and transcription.
RESULTS
Impaired development of mature SP4 T-cells in theGli3 mutant thymus
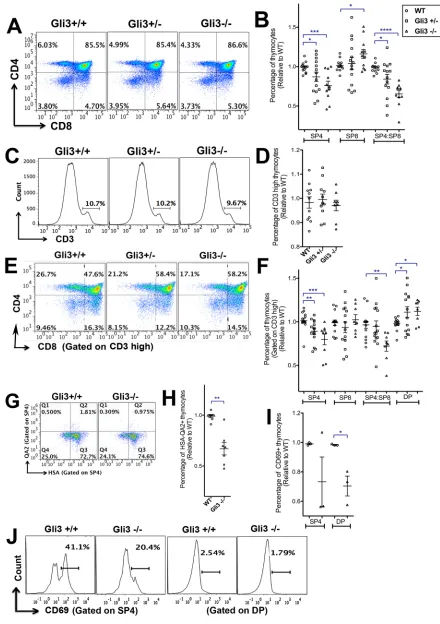
Gli3 deficiency is embryonic lethal, so to investigate whether Gli3 is required for differentiation of thymocytes from the DP to SP stage, we cultured wild-type (WT) and Gli3 mutant E17.5 mouse fetal thymus organ culture (FTOC) for 4 days and assessed changes in developmentally regulated cell-surface markers. This culture period enabled us to measure the rate of differentiation of the mature SP populations, as they are first produced. We observed a significant gene dose-dependent decrease in the proportion of SP4 cells and in the SP4:SP8 ratio in the Gli3mutant FTOC compared with WT (Fig. 1A,B). The SP4 population was TCRβ+and TCRγδ−in both
WT and Gli3 mutant thymus (Fig. S1), consistent with normal divergence of theγδlineage at the DN stage in theGli3−/−thymus (Vantourout and Hayday, 2013). The proportion of CD4− CD8+
cells was significantly increased in Gli3−/− compared with WT (Fig. 1A,B). This suggests that efficient differentiation from DP to SP4 cells required Gli3, and that Gli3 deficiency favoured lineage commitment to SP8 over SP4. However, the embryonic CD8+
CD4−population also contains immature single positive (ISP) cells, so we gated on the CD3hipopulation, and analysed the distribution
of DP and SP thymocytes. We found no significant difference in the proportion of CD3hithymocytes between WT,Gli3+/−andGli3−/−
(Fig. 1C,D). Gating on CD3hicells confirmed the requirement for
Gli3 for normal differentiation from CD3hiDP to CD3hiSP4 cell, as
the proportion of CD3hiDP cells was significantly increased and the
proportion of CD3hiSP4 cells was significantly decreased, whereas
the proportion of the CD3hiSP8 population was not significantly
different between the three genotypes of embryo (Fig. 1E,F). In order to dissect further the stages of maturity affected by Gli3, we stained thymocytes for the surface markers CD69, HSA (CD24) and Qa2. DP thymocytes express high levels of HSA and then acquire CD69 expression as a result of TCR signalling for positive selection (Ge and Chen, 1999). Newly positively selected SP thymocytes also express high levels of HSA and CD69, and as they mature they downregulate HSA and CD69 and gain expression of Qa2 (Ge and Chen, 1999; Weinreich and Hogquist, 2008).
The proportion of mature HSA−Qa2+cells in the SP4 population,
although low in both genotypes, was significantly decreased in Gli3−/− compared with WT (Fig. 1G,H). CD69 expression was significantly decreased on DP thymocytes in theGli3−/−thymus compared with WT (Fig. 1I,J), indicating that fewer DP cells were undergoing positive selection, and consistent with the overall reduction in SP4 maturation. CD69 expression was also on average lower on theGli3−/−SP4 population than WT, and there was greater variation in expression levels in Gli3−/− compared with WT, suggesting dysregulated maturation in the absence of Gli3.
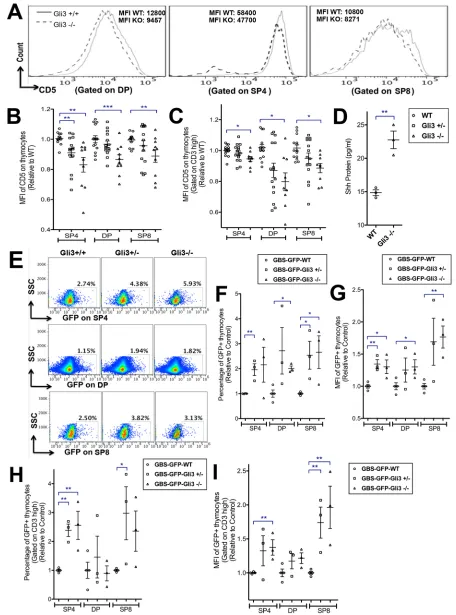
Positive and negative selection and SP4/8 lineage commitment are determined by many factors, including transcriptional regulators of signal transduction and the TCR signal strength itself. A longer and stronger TCR signal promotes differentiation towards SP4, whereas a weaker signal favours SP8 (Bosselut, 2004). Since Gli3 deficiency suppressed lineage commitment towards SP4 cells and biased the SP4:SP8 ratio, we investigated whether the TCR signal strength was affected in theGli3mutant FTOC by measuring cell-surface CD5 expression, which correlates with TCR and pre-TCR signal strength (Azzam et al., 2001, 1998). The mean fluorescence intensity (MFI) of CD5 on the DP, SP4 and SP8 cells was significantly decreased in theGli3−/−thymus compared with WT (Fig. 2A-C). This suggested that reduced TCR signal strength might be one factor responsible for the decreased commitment to SP4 in theGli3mutant.
Increased Shh signalling inGli3mutant thymocytes
TheGli3mutant fetal thymus has increased expression of the Hh target gene Gli1 in stroma (Hager-Theodorides et al., 2009), indicating that, overall, Gli3 acts as a repressor of Hh pathway activation in the stroma. Since Gli3 can repressShhexpression by repression of an intermediate transcriptional activator of Shh in other tissues (te Welscher et al., 2002), and Shh is the key Hh ligand expressed by TECs (Outram et al., 2000; Rowbotham et al., 2007; Saldaña et al., 2016; Shah et al., 2004), we tested whether more Shh protein was present in the Gli3-deficient fetal thymus compared with WT by ELISA. Shh protein was significantly increased in Gli3−/−compared with WT (Fig. 2D).
To test if Shh was signalling directly to developing T-cells, we used Gli binding site (GBS)-GFP transgenic (tg) reporter mice to measure active Hh-dependent transcription in DP, SP4 and SP8 populations in theGli3mutants (Fig. 2E-I). The GBS-GFP-tg express GFP when activator forms of Gli proteins bind to the GBS transgene (Balaskas et al., 2012). We observed significant increases in GFP expression in DP, SP4 and SP8/ISP populations in GBS-GFP-tgGli3 mutants compared with GBS-GFP-tgGli3+/+(Fig. 2E,F). The MFI of Fig. 1. T-cell development inGli3+/+,Gli3+/−andGli3−/−E17.5 plus 4 days
in FTOC and E18.5 thymus.Flow cytometry analysis. Scatter plots show mean±s.e.m. Each point represents thymus from an individual mouse embryo. (A-H) E17.5 FTOC for 4 days.Gli3+/+(n=14),Gli3+/−(n=14) andGli3−/− (n=11). (I,J) E18.5Gli3+/+(n=3) andGli3−/−(n=3) thymus. (A) CD8 against CD4. (B) Percentage of populations (relative to mean of WT) giving significance by Student’st-test compared with WT for SP4 (Gli3+/−,P<0.03;
Gli3−/−,P<0.001), SP8 (Gli3−/−,P<0.03) and SP4:SP8 ratio (Gli3+/−,P<0.02;
Gli3−/−,P<0.0006). (C) CD3 staining onGli3+/+,Gli3+/−andGli3−/− thymocytes, giving the percentage of CD3hicells. (D) Percentage of CD3hi
thymocytes inGli3+/+,Gli3+/−andGli3−/−(relative to mean of WT littermate). (E) CD8 against CD4, gated on CD3hi. (F) Percentage of populations gated on
CD3hi, giving significance by Student’st-test compared with WT for CD3hiSP4
(Gli3+/−,P<0.002;Gli3−/−,P<0.0004), CD3hiSP4:SP8 ratio (Gli3−/−,P<0.002) and CD3hiDP (Gli3+/−,P<0.05;Gli3−/−,P<0.02). (G) HSA against Qa2 expression, gated on SP4 cells fromGli3+/+andGli3−/−. (H) Relative percentage of HSA−Qa2+cells in the SP4 population, giving significance by
Student’st-test compared with WT (P<0.002). (I) Percentage of CD69+cells in
SP4 and DP populations, giving significance by Student’st-test for SP4 (P<0.07) and DP (P<0.05). (J) CD69 expression on SP4 and DP cells in a representative experiment.
DEVEL
GFP on the SP4, DP and SP8 populations was significantly higher in Gli3−/−than inGli3+/+(Fig. 2G). Gating on CD3hithymocytes, the
proportion of GFP+mature CD3hiSP4 cells was significantly higher
in theGli3mutants compared withGli3+/+, and the MFI of CD3hi
SP4 and CD3hiSP8 cells was also significantly increased (Fig. 2H,I).
[image:4.612.77.533.57.672.2]This increase in GFP expression showed that Hh pathway activation is Fig. 2.See next page for legend.
DEVEL
increased in thymocytes inGli3−/−and therefore suggests that the increased Shh protein level is signalling directly to developing T-cells in theGli3mutant thymus.
Attenuation of Hh signalling inGli3−/−thymus reverses the decrease in the SP4 population
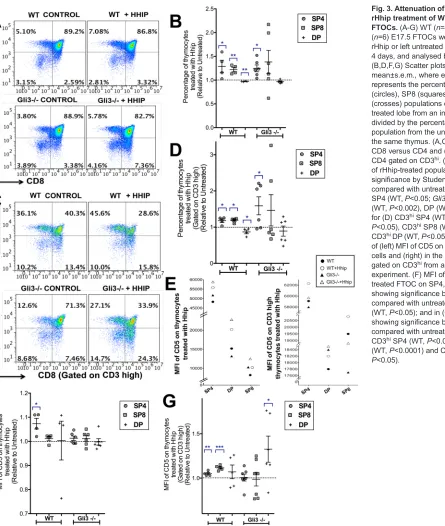
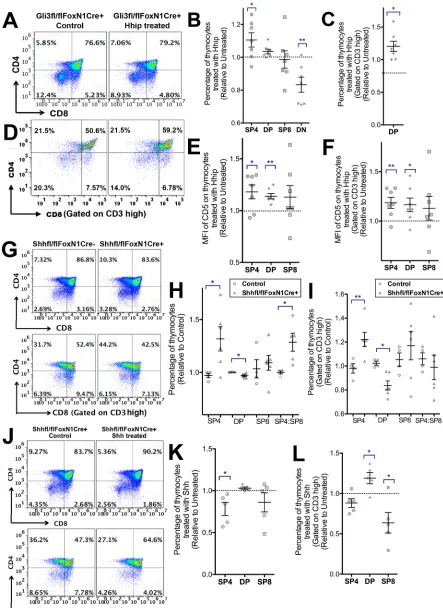
Since the Gli3-deficient thymus has increased Hh signalling, loss of Gli3 in the thymus could cause changes that are directly dependent on the increase in the Hh signal or, alternatively, that are dependent on Gli3 but independent of the increase in Hh pathway activation. To investigate whether the differences in theGli3−/−thymus were directly due to increased Hh signalling, we attenuated Hh signalling by treatment with recombinant (r) Hhip to neutralise endogenous Hh proteins in FTOC. As expected, rHhip-treated WT FTOC had a higher proportion of SP4 and SP8 cells but a decreased percentage of DP cells than untreated controls (Fig. 3A,B) (Lau et al., 2017). rHhip-treatedGli3−/−FTOC had a significantly higher proportion of SP4 cells (Fig. 3A,B). The mature CD3hi SP4 and CD3hiSP8
populations were significantly increased and the CD3hi DP
population decreased in the rHhip-treated WT FTOC relative to their controls, whereas in the rHhip-treatedGli3−/−FTOC, although the mean proportional change in both the CD3hiSP4 and CD3hiSP8
populations was greater than in the WT, only the increase in the CD3hiSP4 was significant, and variability was greater (Fig. 3C,D).
This increased variability in response to Hh neutralisation in the Gli3−/−compared with WT suggested that Gli3 might be required for normal interpretation of changes in the Hh signal.
Neutralisation of Hh proteins also increased cell-surface CD5 expression in WT FTOC (Fig. 3E-G). As expected, the highest cell-surface CD5 expression was observed in the SP4 population in all cultures, and gating on CD3hi cells showed that the CD3hi DP
populations expressed lower levels of cell-surface CD5 than the WT CD3hi SP4 and CD3hi SP8 populations (Fig. 3E). Interestingly,
rHhip treatment significantly increased the MFI of CD5 on the CD3hiDP population in theGli3−/−FTOC, whereas in WT FTOC
MFI of CD3hiSP4 and CD3hi SP8 populations was significantly
increased (Fig. 3E-G).
These experiments suggest that the decrease in SP4 differentiation in theGli3−/−FTOC at this developmental transition is a direct result of the increase in Shh, but that Gli3 might also be required to respond to changes in the Shh signal. Consistent with this, previous studies showed that Shh treatment of WT FTOC decreases the SP4 population, the SP4:SP8 ratio and cell-surface CD5 expression, and that in mature T-cells constitutive activation of Gli2-mediated transcription reduces TCR signal transduction (Furmanski et al., 2015, 2012; Rowbotham et al., 2007). By contrast, constitutive loss of Shh, Gli1 or Gli2 from fetal thymus increases differentiation from the DP to SP stage (Drakopoulou et al., 2010; Rowbotham et al., 2007).
Gli3 expression in TECs plays a key role in T-cell development
We next tested if the changes in thymocyte selection and maturation were the result of the activity of Gli3 expressed in TECs, rather than of cell-intrinsic Gli3 activity in developing thymocytes. We compared fetal thymocyte development in conditional knockouts, in which Gli3 is conditionally deleted from TECs (Gli3fl/fl
FoxN1Cre+), and in which Gli3 is specifically deleted from all
haematopoietic cells including all thymocytes (Gli3fl/flVavCre+).
Interestingly, most of the changes observed in the Gli3-deficient thymus were due to loss of Gli3 expression from TECs.
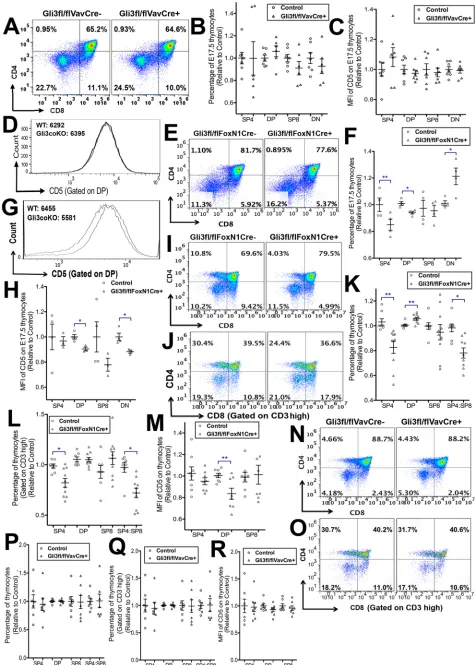
We first analysed thymocyte development at E17.5, the day on which mature SP4 cells first arise. Conditional deletion of thymocyte-intrinsic Gli3 in fresh E17.5Gli3fl/flVavCre+thymus
did not result in significant changes in the proportion of thymocyte populations or in cell-surface CD5 expression compared with littermate control thymus (Fig. 4A-D). By contrast, conditional deletion ofGli3from TECs inGli3fl/flFoxN1Cre+embryos resulted
in a significant decrease in the differentiation of SP4 cells (Fig. 4E,F). On E17.5, in addition to a significant reduction in the emerging SP4 population, we observed a significant decrease in the DP population, and a concomitant increase in the DN population, as previously described in the constitutive Gli3−/− thymus (Hager-Theodorides et al., 2005) (Fig. 4E,F). Cell-surface CD5 expression was significantly lower on the DP and DN cells inCre+than in the
control, indicating lower pre-TCR and/or TCR signal strength (Fig. 4G,H) (Azzam et al., 1998; Rowbotham et al., 2009; Sahni et al., 2015).
We then cultured E17.5 Gli3fl/fl FoxN1Cre+ and Gli3fl/fl
FoxN1Cre− FTOCs for 4 days to investigate the rate of differentiation at the transition from DP to SP4 cells (Fig. 4I-M). Conditional deletion of Gli3from TECs resulted in a significant decrease in the proportion of SP4 cells and in the SP4:SP8 ratio, while the proportion of DP cells significantly increased compared with the Cre− littermate control (Fig. 4I,K). Gating on CD3hi cells, we
observed a significant decrease in the SP4 population and in the SP4: SP8 ratio (Fig. 4J,L). Cell-surface CD5 expression was significantly decreased in the DP population from Gli3fl/fl FoxN1Cre+ FTOC
compared withCre−littermates (Fig. 4M). By contrast, FTOC from Gli3fl/flVavCre+showed no differences in the rate of differentiation,
distribution of thymocyte subsets, or cell-surface CD5 expression compared with control, confirming the importance of Gli3 expression in TECs, rather than in the hematopoietic compartment of the thymus, for the normal regulation of thymocyte differentiation (Fig. 4N-R).
Since constitutive loss of Gli3 led to Hh-dependent changes in thymocyte differentiation and maturation, we tested whether the changes that resulted from conditional deletion ofGli3specifically from TECs were also Hh dependent. We treated the Gli3fl/fl Fig. 2. Expression of CD5 on thymocytes, ELISA for Shh in E17.5 thymus,
and detection of Hh pathway activation in E17.5 WT andGli3mutant thymocytes.(A-C) Flow cytometry analysis of E17.5 FTOC +4 days, with scatter plots showing relative mean±s.e.m., where each point represents thymus from an individual embryo fromGli3+/+(WT;n=14, circles),Gli3+/− (n=14, squares),Gli3−/−(n=11, triangles). (A) CD5 staining on DP, SP4 and SP8 populations, showing MFIs from a representative experiment. (B) MFI of CD5 on SP4, DP and SP8 populations, giving significance by Student’st-test compared with WT for SP4 (Gli3+/−,P<0.007;Gli3−/−,P<0.004), DP (Gli3−/−,
P<0.001) and SP8 (Gli3−/−,P<0.004). (C) MFI of CD5, gated on CD3hion SP4,
DP and SP8, giving significance by Student’st-test for CD3hiSP4 (Gli3−/−,
P<0.03), CD3hiDP (Gli3−/−,P<0.04) and CD3hiSP8 (Gli3−/−,P<0.04). (D) Shh protein measured by ELISA inGli3+/+(n=3) andGli3−/−(n=3) E17.5 thymus (P<0.003). (E-I) Flow cytometry analysis of GFP expression in SP4, DP and SP8 populations from GBS-GFP-tg E17.5 FTOC +4 days fromGli3+/+(n=3),
Gli3+/−(n=4) andGli3−/−(n=3) littermates. Scatter plots show relative mean± s.e.m., where each point represents thymus from a different embryo. (E) SSC versus GFP, gated on SP4 (top row), DP (middle row) and SP8 (bottom row) cells fromGli3+/+(left),Gli3+/−(middle) andGli3−/−(right) littermates, with percentage in region shown. (F) Percentage GFP+, giving significance by
Student’st-test compared with WT for SP4 (Gli3+/−,P<0.004), DP (Gli3−/−,
P<0.003) and SP8 (Gli3+/−,P<0.02;Gli3−/−,P<0.02). (G) MFI of GFP, giving significance by Student’st-test compared with WT for SP4 (Gli3+/−,P<0.003;
Gli3−/−,P<0.02), DP (Gli3−/−,P<0.04) and SP8 (Gli3−/−,P<0.004). (H) Percentage of GFP+cells, gated on CD3hi, giving significance by Student’s
t-test compared with WT for CD3hiSP4 (Gli3+/−,P<0.006;Gli3−/−,P<0.01) and CD3hiSP8 (Gli3+/−,P<0.05). (I) MFI of GFP, gated on CD3hi, giving
significance by Student’st-test compared with WT for SP4 (Gli3−/−,P<0.01) and SP8 (Gli3+/−,P<0.01;Gli3−/−,P<0.01).
DEVEL
FoxN1Cre+FTOC with rHhip and observed a significant increase in
the SP4 population and a significant decrease in the DN population compared with untreated FTOC (Fig. 5A,B). Gating on CD3hicells
also showed that the rHhip-treatedGli3fl/flFoxN1Cre+FTOC had
an increased proportion of CD3hiDP cells compared with untreated
controls (Fig. 5C,D). The MFI of CD5 on SP4 and DP cells in the rHhip-treated Gli3fl/fl FoxN1Cre+ FTOC was significantly
increased compared with the untreated control (Fig. 5E,F). This was in contrast to the effect of rHhip treatment on constitutiveGli3−/− FTOC, in which, although rHhip treatment increased the proportion of SP4 cells, it only increased the MFI of anti-CD5 staining in the CD3hi DP population (Fig. 3G). As thymocytes in the Gli3fl/fl
FoxN1Cre+FTOC express Gli3, whereas those in theGli3−/−FTOC
do not, this difference suggests that Gli3 activity in developing fetal thymocytes is also required for interpretation of the change in the Shh signal, when the high Shh signal caused by Gli3 deficiency is neutralised by rHhip treatment.
Conditional deletion ofShhfrom TECs (Shhfl/flFoxN1Cre+) led
to the opposite phenotype to conditional deletion ofGli3from TECs (Fig. 5G-L). There was a significant increase in the proportion of SP4 cells and in the SP4:SP8 ratio, but a significant decrease in the DP population compared withCre−control FTOC (Fig. 5G,H). The proportion of mature CD3hiSP4 cells was also significantly higher,
whereas the proportion of CD3hiDP cells was significantly lower, in
Shhfl/flFoxN1Cre+FTOC compared withCre−controls (Fig. 5G,I).
[image:6.612.61.506.53.579.2]Treatment of Shhfl/flFoxN1Cre+ FTOC with rShh reversed this Fig. 3. Attenuation of Hh signalling by rHhip treatment of WT andGli3−/−
FTOCs.(A-G) WT (n=4) andGli3−/− (n=6) E17.5 FTOCs were treated with rHhip or left untreated (control) for 4 days, and analysed by flow cytometry. (B,D,F,G) Scatter plots show relative mean±s.e.m., where each point represents the percentage of SP4 (circles), SP8 (squares) and DP (crosses) populations of one rHhip-treated lobe from an individual thymus, divided by the percentage of that population from the untreated lobe from the same thymus. (A,C) Dot plots of (A) CD8 versus CD4 and (C) CD8 versus CD4 gated on CD3hi. (B,D) Percentage
of rHhip-treated populations, giving significance by Student’st-test compared with untreated control for (B) SP4 (WT,P<0.05;Gli3−/−,P<0.03), SP8 (WT,P<0.002), DP (WT,P<0.006); and for (D) CD3hiSP4 (WT,P<0.04;Gli3−/−,
P<0.05), CD3hiSP8 (WT,P<0.05),
CD3hiDP (WT,P<0.05). (E) Scatter plots
of (left) MFI of CD5 on SP4, DP and SP8 cells and (right) in the same populations gated on CD3hifrom a representative
experiment. (F) MFI of CD5 in Hhip-treated FTOC on SP4, SP8 and DP showing significance by Student’st-test compared with untreated control for SP4 (WT,P<0.05); and in (G) MFI of CD5 showing significance by Student’st-test compared with untreated control on CD3hiSP4 (WT,P<0.002), CD3hiSP8
(WT,P<0.0001) and CD3hiDP (Gli3−/−,
P<0.05).
DEVEL
Fig. 4.See next page for legend.
DEVEL
effect and significantly reduced differentiation to SP4 and CD3hi
SP8 but increased the proportion of CD3hiDP cells (Fig. 5J-L).
Transcriptional mechanisms at the DP to SP transition in the Gli3-deficient thymus
In order to understand the transcriptional mechanisms by which Gli3 regulates the DP to SP4 transition and thymic selection, we performed microarrays on FACS-sorted CD69− DP, CD69+ DP
and SP4 thymocytes from E18.5 WT and Gli3 mutant thymus (Fig. 6A-C, Fig. S2; GEO accession GSE87499). We identified differentially expressed genes (DEGs) by Ebayes betweenGli3−/− and WT samples for each sorted population, and used principal component analysis (PCA) to investigate the datasets in an unbiased way (Fig. S2, Tables S1 and S2). For each sorted population dataset, we intersected the 2000 most significant DEGs with the 4000 genes that contributed most to the principal component (PC) axis in which Gli3−/−samples segregated from WT, in order to identify genes of interest.
PCA on the CD69−DP microarray data segregated the samples by genotype on PC2, which accounted for 19% of variability (Fig. 6A, Fig. S2A). Interestingly, genes that contributed to PC2, which were higher in theGli3−/− samples than in WT, included many Hh signalling and target genes, consistent with increased Hh signalling in Gli3−/−. These included Hoxd13, Hoxa13, Hoxd8, Smoc2,H19,S100a9and Ihh(Chan et al., 2014; Lu et al., 2015; Mandhan et al., 2006; Outram et al., 2009; Pazin and Albrecht, 2009).Runx3andNotch1, which both promote SP8 differentiation over SP4, also contributed to PC2, with higher expression inGli3−/−
than in WT (Bosselut, 2004; Fowlkes and Robey, 2002). Genes that contributed to PC2, which were more highly expressed in WT samples, included genes important in selection and SP4 maturation, including Map3k1, which is required for positive selection (Germain, 2002; Xue et al., 2008) (Fig. 6A).
The intersection analysis of the CD69−DP data highlighted 1083 genes, including the Hh target genes Fgf1 and Kif24, the Wnt pathway activator Bcl9l (Martin, 1998; Sarkar et al., 2010), and Cd53, which is induced upon a lower affinity TCR-MHC interaction (Puls et al., 2002). These were more highly expressed inGli3−/− than in WT (Fig. 6A, Table S2). In addition, many genes involved in TCR signalling and apoptosis during repertoire selection were identified, including Fas, Tcerg1, Ltbr, Pten, Camk4 and Ctcf (Castro et al., 1996; Heath et al., 2008; Krebs et al., 1997; Montes et al., 2015; Zhu et al., 2010), all of which showed lower expression inGli3−/−than in WT.
PCA on the microarray data from the CD69+ DP population,
which are cells that have received the TCR signal for positive selection (Ge and Chen, 1999), segregated theGli3−/−samples from the WT on PC3, which accounted for 20% of variability (Fig. 6B, Fig. S2B). Again, Hh signalling and target genes, such asFoxa1, Kif3a, Hdac2 and Tgfb2, contributed to this PC, with higher expression inGli3−/−than in WT (Furmanski et al., 2013; Katoh and Katoh, 2009) (Fig. 6B). By contrast, genes that contributed to PC3 and were more highly expressed in WT than inGli3−/−again included several genes involved in selection and SP4 commitment, including: Egr2, which is downstream of TCR signalling and involved in positive selection (Lauritsen et al., 2008); andGata3, an SP4 commitment gene (Hernández-Hoyos et al., 2003).
The intersection analysis of the CD69+DP data identified 1150
genes (Fig. 6B), including some known Hh targets, which were more highly expressed inGli3−/−than WT, such asHoxa7,Bmp2, Tulp3,ItgavandH19(Chan et al., 2014). Many genes crucial for thymic selection showed lower expression inGli3−/−than in WT, including:Itk, a tyrosine kinase downstream of TCR that is required for positive selection and the SP4:SP8 lineage decision (Lucas et al., 2003);Egr1, which is downstream of TCR signalling and involved in positive selection (Lauritsen et al., 2008);Socs1, the deficiency of which promotes SP8 differentiation (Ilangumaran et al., 2010); Anxa5, which promotes apoptosis during negative selection (Rosenbaum et al., 2011); and Cd6, a co-stimulatory molecule that interacts with its ligand on TECs to promote differentiation to SP (Singer et al., 2002).
Finally, we carried out PCA and DEG analysis of the SP4 microarray data. PCA showed that theGli3−/−SP4 data segregated from the WT on PC2, which accounted for 22% of variability (Fig. 6C, Fig. S2). The intersection analysis of the SP4 data highlighted 703 genes. Egr2 and Nab2, which are required for selection,Anxa6, which regulates selection-related apoptosis, and Lef1 and Tox, which promote SP4 lineage commitment and maturation, were expressed at lower levels inGli3−/−than in WT (Collins et al., 2006; Rosenbaum et al., 2011). Nr4a1,Nr4a3and Cd5, which are transcriptional targets of TCR signal transduction with a level of expression that correlates with TCR signal strength, were also lower inGli3−/−than in WT (Moran et al., 2011; Sekiya et al., 2013). Several Hh target genes, such asItgav,Stmn1,Itga6 and Nedd9, were more highly expressed inGli3−/− than in WT (Aquino et al., 2009; Lu et al., 2015) (Fig. 6C).
Since Hh target genes were upregulated in theGli3−/−CD69+DP
population (which is undergoing positive selection), and the FTOC experiments suggested that the reduced DP to SP4 transition in the Gli3−/− thymus was due to increased Hh signalling, we tested Fig. 4. Gli3 expression in TECs and not thymocyte-intrinsic Gli3
expression is required for SP4 development.(A-D) Flow cytometry of fresh E17.5Gli3fl/flVavCre−control (n=7) andGli3fl/flVavCre+(n=6) thymus. Scatter
plots show relative mean±s.e.m., where each point represents thymus from a different embryo for control littermate andGli3fl/flVavCre+. (A) CD4 and CD8
expression. (B) Relative percentage of thymocyte subsets. (C) Relative MFI of anti-CD5 staining on thymocyte subsets. (D) Representative histogram showing anti-CD5 staining on the DP population in control (solid line) andGli3fl/fl
VavCre+(dotted line), showing MFIs. No significant differences were found
between control andCre+thymi. (E-H) Flow cytometry of fresh E17.5 thymus
fromGli3fl/flFoxN1Cre−(control,n=4) andGli3fl/flFoxN1Cre+(n=4) littermates.
Scatter plots show relative mean±s.e.m., where each point represents thymus from a different embryo for control andGli3fl/flFoxN1Cre+. (E) CD8 against
CD4. (F) Relative mean percentage of SP4, DP, SP8 and DN populations, giving significance by Student’st-test compared with control littermate for SP4 (P<0.01), DP (P<0.05) and DN (P<0.04). (G) Representative histogram shows CD5 staining on DP thymocytes from control (Cre−, solid line) andCre+(dotted
line). MFI of CD5 fluorescence is given. (H) Relative mean MFI of CD5 on SP4, DP, SP8 and DN populations. Differences are significant betweenCre+and
control for DP (P<0.03) and DN (P<0.05). (I-M) Flow cytometry analysis of E17.5 FTOC +4 days fromGli3fl/flFoxN1Cre−(n=8) andGli3fl/flFoxN1Cre+
(n=10) littermates. Scatter plots show relative mean±s.e.m., where each point represents thymus from a different embryo for control FTOC andGli3fl/fl
FoxN1Cre+FTOC. (I) CD8 against CD4. (J) CD8 against CD4, gated on CD3hi.
(K) Relative percentage of SP4, DP and SP8 populations and SP4:SP8 ratio, with significance by Student’st-test compared withCre−littermate for SP4 (P<0.02), DP (P<0.007) and SP4:SP8 ratio (P<0.05). (L) Relative percentage of thymocyte populations and CD4:CD8 ratio, gated on CD3hi, with
significance compared withCre−littermate, for CD3hiSP4 (P<0.05) and CD3hi
SP4:SP8 ratio (P<0.04). (M) Relative MFI of CD5 on thymocyte populations, with significance compared withCre−for DP (P<0.007). (N,O) Flow cytometry of E17.5 FTOC +4 days from controlGli3fl/flVavCre−(n=7) andGli3fl/flVavCre+
(n=6) littermates. No significant differences were found betweenCre−and
Cre+. (N) CD4 against CD8. (O) CD4 against CD8, gated on CD3hi. (P) Relative
percentage of SP4, DP and SP8 populations and SP4:SP8 ratio. (Q) Gated on CD3hi, relative percentage of SP4, DP and SP8 populations and SP4:SP8
ratio. (R) MFI of CD5, gated on thymocyte populations.
DEVEL
whether the transcription of genes required for differentiation to SP could be modulated by rShh treatment. We choseEgr2andToxfor this experiment because both were expressed at very similar low
levels in WT andGli3−/−in the CD69−DP dataset, but upregulated in the CD69+ DP and SP4 populations. Furthermore, both
[image:9.612.82.525.57.665.2]transcripts were significantly lower in theGli3−/−CD69+DP and Fig. 5.See next page for legend.
DEVEL
Gli3−/−SP4 datasets than in their WT counterparts, and these are the populations that contain cells that are undergoing selection (Fig. 7A,B). After 2 days of rShh treatment of WT E17.5 FTOC, the levels ofEgr2andToxwere reduced compared with the untreated control (Fig. 7C,D).
In the microarray data, we observed the same pattern of expression for the known transcriptional target genes of TCR signal transduction, Nr4a1 and Cd5 (Fig. 7E). Both were low in CD69− DP cells, upregulated in the CD69+ DP population, and again in the SP4
population, but were significantly lower in theGli3−/−CD69+DP
and SP4 datasets than in WT. Thus, the differences in expression in these genes only became apparent after TCR signalling for positive selection, in support of the idea thatGli3mutation influences SP4 T-cell development by increasing Shh, which signals to DP thymocytes to dampen TCR signal transduction during positive selection.
Taken together, the transcriptome data suggest that cells undergoing selection in theGli3−/− thymus have a lower average strength of TCR signal. To test this, we used canonical correspondence analysis (CCA) to compare the patterns of gene expression in our SP4 datasets with transcriptome data from publically available datasets that were prepared from thymocytes that were receiving different strengths of TCR signals during selection (GSE38909; Lo et al., 2012). We selected the 1500 most significant DEG genes from the GSE38909 dataset and used these to generate a scale of strong to weak TCR signalling and plotted our SP4 datasets against this scale. This analysis showed that the SP4Gli3−/− samples have the transcriptional signature of thymocytes receiving a lower TCR signal than those of WT, whereas the transcriptome of the SP4 population from the Gli3+/− thymus showed an intermediate transcriptional signature (Fig. 7F). The CCA therefore confirms that Gli3 is important for selection and differentiation from DP to SP4,
and is consistent with higher Shh expression dampening the TCR signal during repertoire selection in theGli3−/−thymus.
DISCUSSION
Here, we showed that expression of the transcription factor Gli3 in TECs is necessary for normal differentiation from DP to mature SP4 thymocyte in the fetal thymus. Constitutive deletion ofGli3reduced differentiation and maturation of SP4 T-cells, and this reduction in differentiation to SP4 was also seen whenGli3was conditionally deleted from TECs only, but not whenGli3was conditionally deleted from thymocytes. Gli3 repressed expression of Shh, and analysis of an Hh reporter line showed that the Hh signalling pathway was active in developing thymocytes, and that activation of the pathway in thymocytes was increased when Gli3 was deleted. DP and SP thymocyte populations from Gli3−/− had reduced levels of cell-surface CD5, indicative of lower TCR signalling, and consistent with the fact that rShh treatment of WT FTOC and constitutive activation of Hh-mediated transcription both reduced cell-surface CD5 expression (Furmanski et al., 2012; Rowbotham et al., 2007). Conditional deletion ofShhfrom TECs increased differentiation from DP to SP, whereas differentiation from DP to SP4 in theGli3mutant fetal thymus was restored by neutralisation of endogenous Hh proteins. Taken together, our findings indicate that Gli3 activity in TECs promotes SP4 T-cell development by repression of Shh, which signals directly to developing T-cells to reduce TCR signal strength. In support of this, the transcriptome data showed reduced expression of genes important for TCR signalling and positive selection, and of transcriptional targets of TCR signal transduction in the Gli3−/− populations compared with their WT counterparts, whereas the WT samples had decreased expression of Hh target and signalling genes. Overall, theGli3−/− SP4 cells had the transcriptional signature of thymocytes that have received a weaker TCR signal than their WT counterparts. The influence ofGli3mutation on the SP4 population is consistent with this mechanism, as positive selection to the SP4 lineage requires stronger and longer TCR signals (Bosselut, 2004; Klein et al., 2014; Starr et al., 2003).
Gli3 is expressed in fetal but not adult thymocytes (Hager-Theodorides et al., 2005), and although conditional deletion ofGli3 from thymocytes did not significantly influence the proportions of DP and SP populations, our experiments showed that Gli3 activity in thymocytes is required for the normal interpretation of changes in the Hh signal. In the constitutiveGli3−/−thymus, where increased Shh signalling to developing thymocytes reduced differentiation from DP to SP, although neutralisation of the Hh signal with rHhip treatment was able to restore the proportion of the SP4 population, it only significantly increased cell-surface expression of CD5 in the CD3hi DP population. In contrast to the constitutive Gli3−/−
thymus, rHhip treatment inGli3fl/flFoxN1Cre+FTOC increased cell-surface CD5 expression on SP4 and CD3hi DP populations,
suggesting that the ability of developing fetal thymocytes to respond to the decrease in the Shh signal upon rHhip treatment requires thymocyte intrinsic Gli3 activity.
In summary, we showed that expression of the transcription factor Gli3 by TECs is required for normal SP4 T-cell development in the fetal thymus. As Gli3 deficiency increases Shh expression in the thymus, and Hh plays a role in T-cell acute lymphoblastic leukaemia (T-ALL), which arises in the thymus, it will be important to investigate the impact of Gli3 activity in the thymic stromal environment on T-ALL (Dagklis et al., 2016, 2015; González-Gugel et al., 2013; Hou et al., 2014). It will also be important to investigate the influence of Gli3 on shaping the TCR repertoire and in autoimmunity.
Fig. 5. Neutralisation of Hh inGli3fl/flFoxN1Cre+FTOC and conditional deletion ofShhfrom TECs increase SP4 differentiation.(A-L) Flow cytometry analysis with scatter plots showing relative mean±s.e.m., where each point represents thymus from a different embryo. (A-E) E17.5Gli3fl/fl
FoxN1Cre+FTOC treated with rHhip for 4 days (n=7) compared with the
untreated lobe (control) from the same thymus (n=7). (A) CD8 against CD4. (B) Percentage of thymocyte populations, showing significance by Student’s
t-test for rHhip treated versus control untreated for SP4 (P<0.02) and DN (P<0.006). (C) The percentage of DP thymocytes, gated on CD3hi. The
difference in percentage of CD3hiDP cells between rHhip treated and control
was statistically significant by Student’st-test (P<0.02). (D) CD8 versus CD4, gated on CD3hi. (E) MFI of CD5 on rHhip-treated FTOC showing significance
by Student’st-test versus control untreated FTOC for SP4 (P<0.02) and DP (P<0.007). (F) Gated on CD3hi, MFI of CD5 on rHhip treated showing
significance by Student’st-test versus control untreated FTOC for CD3hiSP4
(P<0.01) and CD3hiDP (P<0.02). (G-I) Flow cytometry of E17.5 FTOC +4 days
fromShhfl/flFoxN1Cre−(n=4, control) andShhfl/flFoxN1Cre+(n=6) littermates.
Scatter plots show relative mean±s.e.m., where each point represents thymus from a different embryo. (H) Percentage of thymocyte populations and SP4: SP8 ratio, in control andShhfl/flFoxN1Cre+, giving significance by Student’s
t-test compared withCre−for SP4 (P<0.02), DP (P<0.04) and SP4:SP8 ratio (P<0.05). (I) Percentage of thymocyte populations and SP4:SP8 ratio gated on CD3hi, in control andShhfl/flFoxN1Cre+, giving significance by Student’st-test
compared withCre−for CD3hiSP4 (P<0.003) and CD3hiDP (P<0.002). (J-L)
E17.5Shhfl/flFoxN1Cre+FTOC treated with 1μg/ml rShh for 4 days compared
with control untreatedShhfl/flFoxN1Cre+FTOC thymus lobe from the same
thymus (n=5). (J) CD8 against CD4 staining (top); CD8 against CD4 staining, gated on CD3hi(bottom). (K) Percentage of thymocyte population, divided by
the percentage from the control untreated cultured lobe from the same thymus, giving significance compared with untreated for SP4 (P<0.04). (L) Percentage of thymocyte population, gated on CD3hi, divided by the percentage from the
control untreated cultured lobe from the same thymus, giving significance compared with untreated control for CD3hiDP (P<0.02) and CD3hiSP8
(P<0.03).
DEVEL
MATERIALS AND METHODS
Mice
Mice were on a C57BL/6 background. C57BL/6 mice were purchased from
Charles River;Gli3fl/fl,Gli3+/−andShhfl/flfrom The Jackson Laboratories;
GBS-GFP-tg was provided by J. Briscoe (Balaskas et al., 2012); Vav-iCre-tg was provided by D. Kioussis (de Boer et al., 2003); and FoxN1Cre-Vav-iCre-tg by G. Hollander (Zuklys et al., 2009). As FoxN1-Cre-tg and Vav-Cre-tg can be expressed in the male germline, all conditional knockouts were generated by
crossingCre+ females withCre− males (Joseph et al., 2013; Shi et al.,
2016). Mice were bred and maintained at UCL under UK Home Office regulations.
Flow cytometry, antibodies and cell purification
Thymus cell suspensions were prepared and stained as described (Hager-Theodorides et al., 2005) using combinations of the following directly conjugated antibodies at concentration of 1:100: (from BD Pharmingen)
anti-γδPE (catalogue no. 553178); from eBioscience: anti-TCRβFITC (catalogue
no. 11-5961-85), antiCD3PE (catalogue no. 12-0031-82), anti-CD24PE (catalogue no. 12-0241-82) and anti-CD69FITC (catalogue no. 11-0691-85); (from Biolegend) anti-CD3FITC (catalogue no. 100204), anti-CD5FITC (catalogue no. 100605), Qa2FITC (catalogue no. 121709),
anti-CD4APC (catalogue no. 116014), anti-CD5PE (catalogue no. 100607),
anti-CD8PerCP/Cy5.5 (catalogue no. 100734), anti-CD4PerCP/Cy5.5 (catalogue no. 100539) and anti-CD8APC (catalogue no. 100712). Data were acquired on a C6 Accuri flow cytometer (BD Biosciences) and analysed using FlowJo software. Live cells were gated by FSC and SSC profiles. Data represent at least three experiments.
Fetal thymus organ cultures
[image:11.612.54.460.58.555.2]FTOCs were carried out as described (Saldaña et al., 2016). In some experiments, rHhip or rShh (R&D Systems) was added at 1 µg/ml. To allow comparison between litters for statistical analysis, relative numbers or
Fig. 6. Microarray datasets show transcriptional differences in Hh signalling genes and thymic selection genes between E18.5 WT andGli3mutant sorted CD69−DP, CD69+DP and SP4 populations.
(A) (Left) PCA axis 2 (PC2) for WT and
Gli3−/−CD69−DP, showing some genes that contributed to the negative (Gli3−/−) and positive (WT) PC2 axis. (Right) Heatmap of DEGs identified by intersection analysis between WT and
Gli3−/−CD69−DP. (B) (Left) PC3 for WT andGli3−/−CD69+DP, showing some
genes that contributed to the negative (Gli3−/−) and positive (WT) axis. (Right) Heatmap of DEGs identified by intersection analysis between WT and
Gli3−/−CD69+DP. (C) (Left) PC2 for WT
andGli3−/−SP4, showing some genes that contributed to the negative (WT) and positive (Gli3−/−) axis. (Right) Heatmap of DEGs highlighted in intersection analysis between WT and
Gli3−/−SP4.
DEVEL
percentages for each genotype or treatment were calculated by dividing by the mean of controls from the same litter (untreated control or WT littermates).
Microarray and data analysis
E18.5 WT,Gli3+/−andGli3−/−thymocytes (n=2) were stained for CD4, CD8
and CD69. SP4, CD69−DP and CD69+DP populations were FACS sorted.
RNA was extracted using the Arcturus PicoPure RNA Isolation kit (Applied Biosystems) and quantity and quality determined by Bioanalyzer 2100 (Agilent).
Microarrays were performed by UCL Genomics on the Affymetrix GeneChip Mouse Gene 2.0ST Array using standard Ambion (Invitrogen) chemistry. Array data were normalised using the oligo package from R. Data are publically available at GEO (GSE87499).
DEGs were determined using the moderated Ebayest-statisticP<0.05 from
the limma package in Bioconductor. Principal component analysis (PCA) was
performed using normalised microarray transcript expression values, using the CRAN package ade4. PCA is a multivariate statistical method, which can be used to segregate genome-wide transcription datasets according to variability in transcript expression values, taking into account all genes (Ringnér, 2008). PCA can thus cluster microarray datasets to detect dominant patterns of gene expression, as represented by the principal components (PCs).
[image:12.612.56.478.52.554.2]Canonical correspondence analysis (CCA) is a multivariate analysis that allows the comparison of experimental transcriptome data with publically available datasets from other laboratories (Ono et al., 2014). CCA was performed using the CRAN package vegan. The GSE38909 dataset was used as the environmental variable and our dataset was regressed onto it. It contains thymocytes stimulated with a positively selecting peptide gp250 and the non-selecting control peptide Hb (Lo et al., 2012). We created a strong TCR signalling axis using the DEGs between the control peptide and the positively selecting peptide and regressed our samples onto this axis (Sahni et al., 2015).
Fig. 7. Microarray and QRT-PCR analyses of transcriptional differences in thymic selection genes in sorted populations from WT andGli3mutant thymus and in rShh-treated WT FTOC.(A,B) Normalised microarray transcript expression in
Gli3−/−and WT datasets of (A)Egr2and (B)Tox.(C,D) QRT-PCR analysis showing a representative experiment (of three) for expression of (C)Egr2and (D)Toxin thymocytes prepared from E17.5 WT control and rShh-treated FTOCs for 2 days. Differences between control and rShh treated were significant:Egr2(P<0.02),Tox
(P<0.07). Transcripts were normalised relative toHprt.(E) Normalised microarray transcript expression in
Gli3−/−and WT datasets ofNr4a1(top) andCd5(bottom). (F) CCA showing the separation of the WT,Gli3+/−(HET) and
Gli3−/−(KO) SP4 microarray datasets on a scale of strong to weak TCR stimulation.
DEVEL
QRT-PCR
RNA extraction and cDNA synthesis were performed as described
(Hager-Theodorides et al., 2005). QRT-PCR, using QuantiTect primers forEgr2
andTox(Qiagen) and iQSYBR Green Supermix (Bio-Rad), was run on an
iCycler (Bio-Rad). Transcripts were normalised relative toHprt.
ELISA
Shh ELISA was performed using the Shh N-Terminus Quantikine ELISA Kit
(R&D Systems). Entire E17.5 thymi were crushed and centrifuged at 3gfor 5
min, and ELISA was performed on the supernatants.
PCR for genotyping
DNA extraction and PCR were carried out using methods and primers described previously (Hager-Theodorides et al., 2005; Saldaña et al., 2016).
Statistical analysis
Statistical analysis was performed using unpaired two-tailed Student’s
t-tests and P≤0.05 was considered significant. In figures: *P≤0.05,
**P≤0.01 and ***P≤0.001.
Acknowledgements
We thank UCL Genomics for microarrays and A. Eddaoudi and S. Canning for cell sorting.
Competing interests
The authors declare no competing or financial interests.
Author contributions
Conceptualization: A.S., T.C.; Investigation: A.S., D.C.Y., S.R., C.-I.L., E.P., J.L., J.I.S., T.C.; Writing - original draft: A.S., T.C.; Writing - review & editing: A.S., D.C.Y., C.-I.L., T.C.; Supervision: T.C.; Project administration: T.C.; Funding acquisition: T.C.
Funding
This work was supported by funding from the Medical Research Council (MR/ P000843/1), Biotechnology and Biological Sciences Research Council (BB/ I026324/1), Wellcome Trust (WT094255MF), Great Ormond Street Hospital Charity (V1270), and the National Secretariat for Higher Education, Science, Technology and Innovation of Ecuador (SENESCYT), and supported by the National Institute for Health Research Biomedical Research Centre at Great Ormond Street Hospital for Children NHS Foundation Trust and University College London (ormbrc-2012-1). Deposited in PMC for immediate release.
Data availability
Microarray data are available at Gene Expression Omnibus under accession number GSE87499.
Supplementary information
Supplementary information available online at
http://dev.biologists.org/lookup/doi/10.1242/dev.146910.supplemental
References
Aquino, J. B., Lallemend, F., Marmigère, F., Adameyko, I. I., Golemis, E. A. and Ernfors, P.(2009). The retinoic acid inducible Cas-family signaling protein Nedd9 regulates neural crest cell migration by modulating adhesion and actin dynamics.
Neuroscience162, 1106-1119.
Azzam, H. S., Grinberg, A., Lui, K., Shen, H., Shores, E. W. and Love, P. E. (1998). CD5 expression is developmentally regulated by T cell receptor (TCR) signals and TCR avidity.J. Exp. Med.188, 2301-2311.
Azzam, H. S., DeJarnette, J. B., Huang, K., Emmons, R., Park, C.-S., Sommers, C. L., El-Khoury, D., Shores, E. W. and Love, P. E.(2001). Fine tuning of TCR signaling by CD5.J. Immunol.166, 5464-5472.
Balaskas, N., Ribeiro, A., Panovska, J., Dessaud, E., Sasai, N., Page, K. M., Briscoe, J. and Ribes, V.(2012). Gene regulatory logic for reading the Sonic Hedgehog signaling gradient in the vertebrate neural tube.Cell148, 273-284. Barbarulo, A., Lau, C.-I., Mengrelis, K., Ross, S., Solanki, A., Saldaña, J. I. and
Crompton, T.(2016). Hedgehog signalling in the embryonic mouse thymus.
J. Dev. Biol.4, 22.
Bosselut, R.(2004). CD4/CD8-lineage differentiation in the thymus: from nuclear effectors to membrane signals.Nat. Rev. Immunol.4, 529-540.
Brugnera, E., Bhandoola, A., Cibotti, R., Yu, Q., Guinter, T. I., Yamashita, Y., Sharrow, S. O. and Singer, A. (2000). Coreceptor reversal in the thymus:
signaled CD4+8+ thymocytes initially terminate CD8 transcription even when differentiating into CD8+ T cells.Immunity13, 59-71.
Carpenter, A. C. and Bosselut, R.(2010). Decision checkpoints in the thymus.Nat. Immunol.11, 666-673.
Castro, J. E., Listman, J. A., Jacobson, B. A., Wang, Y., Lopez, P. A., Ju, S., Finn, P. W. and Perkins, D. L.(1996). Fas modulation of apoptosis during negative selection of thymocytes.Immunity5, 617-627.
Chan, L. H., Wang, W., Yeung, W., Deng, Y., Yuan, P. and Mak, K. K.(2014). Hedgehog signaling induces osteosarcoma development through Yap1 and H19 overexpression.Oncogene33, 4857-4866.
Collins, S., Wolfraim, L. A., Drake, C. G., Horton, M. R. and Powell, J. D.(2006). Cutting Edge: TCR-induced NAB2 enhances T cell function by coactivating IL-2 transcription.J. Immunol.177, 8301-8305.
Crompton, T., Outram, S. V. and Hager-Theodorides, A. L. (2007). Sonic hedgehog signalling in T-cell development and activation.Nat. Rev. Immunol.7, 726-735.
Dagklis, A., Pauwels, D., Lahortiga, I., Geerdens, E., Bittoun, E., Cauwelier, B., Tousseyn, T., Uyttebroeck, A., Maertens, J., Verhoef, G. et al. (2015). Hedgehog pathway mutations in T-cell acute lymphoblastic leukemia.
Haematologica100, e102-e105.
Dagklis, A., Demeyer, S., De Bie, J., Radaelli, E., Pauwels, D., Degryse, S., Gielen, O., Vicente, C., Vandepoel, R., Geerdens, E. et al.(2016). Hedgehog pathway activation in T-cell acute lymphoblastic leukemia predicts response to SMO and GLI1 inhibitors.Blood128, 2642-2654.
de Boer, J., Williams, A., Skavdis, G., Harker, N., Coles, M., Tolaini, M., Norton, T., Williams, K., Roderick, K., Potocnik, A. J. et al.(2003). Transgenic mice with hematopoietic and lymphoid specific expression of Cre.Eur. J. Immunol.33, 314-325.
Drakopoulou, E., Outram, S. V., Rowbotham, N. J., Ross, S. E., Furmanski, A. L., Saldana, J. I., Hager-Theodorides, A. L. and Crompton, T.(2010). Non-redundant role for the transcription factor Gli1 at multiple stages of thymocyte development.Cell Cycle9, 4144-4152.
El Andaloussi, A., Graves, S., Meng, F., Mandal, M., Mashayekhi, M. and Aifantis, I. (2006). Hedgehog signaling controls thymocyte progenitor homeostasis and differentiation in the thymus.Nat. Immunol.7, 418-426. Fowlkes, B. J. and Robey, E. A.(2002). A reassessment of the effect of activated
Notch1 on CD4 and CD8 T cell development.J. Immunol.169, 1817-1821. Furmanski, A. L., Saldana, J. I., Rowbotham, N. J., Ross, S. E. and Crompton, T.
(2012). Role of Hedgehog signalling at the transition from double-positive to single-positive thymocyte.Eur. J. Immunol.42, 489-499.
Furmanski, A. L., Saldana, J. I., Ono, M., Sahni, H., Paschalidis, N., D’Acquisto, F. and Crompton, T.(2013). Tissue-derived hedgehog proteins modulate Th differentiation and disease.J. Immunol.190, 2641-2649.
Furmanski, A. L., Barbarulo, A., Solanki, A., Lau, C.-I., Sahni, H., Saldana, J. I., D’Acquisto, F. and Crompton, T.(2015). The transcriptional activator Gli2 modulates T-cell receptor signalling through attenuation of AP-1 and NFkappaB activity.J. Cell Sci.128, 2085-2095.
Ge, Q. and Chen, W. F.(1999). Phenotypic identification of the subgroups of murine T-cell receptor alphabeta+ CD4+ CD8−thymocytes and its implication in the late stage of thymocyte development.Immunology97, 665-671.
Germain, R. N.(2002). T-cell development and the CD4-CD8 lineage decision.Nat. Rev. Immunol.2, 309-322.
González-Gugel, E., Villa-Morales, M., Santos, J., Bueno, M. J., Malumbres, M., Rodrıguez-Pinilla, S. M., Piris, M. A. and Ferná ́ndez-Piqueras, J.(2013). Down-regulation of specific miRNAs enhances the expression of the gene Smoothened and contributes to T-cell lymphoblastic lymphoma development.
Carcinogenesis34, 902-908.
Hager-Theodorides, A. L., Dessens, J. T., Outram, S. V. and Crompton, T. (2005). The transcription factor Gli3 regulates differentiation of fetal CD4−CD8− double-negative thymocytes.Blood106, 1296-1304.
Hager-Theodorides, A. L., Furmanski, A. L., Ross, S. E., Outram, S. V., Rowbotham, N. J. and Crompton, T. (2009). The Gli3 transcription factor expressed in the thymus stroma controls thymocyte negative selection via Hedgehog-dependent and -independent mechanisms. J. Immunol. 183, 3023-3032.
Heath, H., Ribeiro de Almeida, C., Sleutels, F., Dingjan, G., van de Nobelen, S., Jonkers, I., Ling, K.-W., Gribnau, J., Renkawitz, R., Grosveld, F. et al.(2008). CTCF regulates cell cycle progression of alphabeta T cells in the thymus.EMBO J.27, 2839-2850.
Hernández-Hoyos, G., Anderson, M. K., Wang, C., Rothenberg, E. V. and Alberola-Ila, J.(2003). GATA-3 expression is controlled by TCR signals and regulates CD4/CD8 differentiation.Immunity19, 83-94.
Hou, X., Chen, X., Zhang, P., Fan, Y., Ma, A., Pang, T., Song, Z., Jin, Y., Hao, W., Liu, F. et al.(2014). Inhibition of hedgehog signaling by GANT58 induces apoptosis and shows synergistic antitumor activity with AKT inhibitor in acute T cell leukemia cells.Biochimie101, 50-59.
Ilangumaran, S., Gagnon, J., Leblanc, C., Poussier, P. and Ramanathan, S. (2010). Increased generation of CD8 single positive cells in SOCS1-deficient thymus does not proportionately increase their export.Immunol. Lett.132, 12-17.
DEVEL
Joseph, C., Quach, J. M., Walkley, C. R., Lane, S. W., Lo Celso, C. and Purton, L. E. (2013). Deciphering hematopoietic stem cells in their niches: a critical appraisal of genetic models, lineage tracing, and imaging strategies.Cell Stem Cell13, 520-533.
Katoh, Y. and Katoh, M. (2009). Hedgehog target genes: mechanisms of carcinogenesis induced by aberrant hedgehog signaling activation.Curr. Mol. Med.9, 873-886.
Klein, L., Kyewski, B., Allen, P. M. and Hogquist, K. A.(2014). Positive and negative selection of the T cell repertoire: what thymocytes see (and don’t see).
Nat. Rev. Immunol.14, 377-391.
Krebs, J., Wilson, A. and Kisielow, P. (1997). Calmodulin-dependent protein kinase IV during T-cell development.Biochem. Biophys. Res. Commun.241, 383-389.
Laky, K. and Fowlkes, B. J.(2008). Notch signaling in CD4 and CD8 T cell development.Curr. Opin. Immunol.20, 197-202.
Lau, C.-I., Barbarulo, A., Solanki, A., Saldaña, J. I. and Crompton, T.(2017). The kinesin motor protein Kif7 is required for T-cell development and normal MHC expression on thymic epithelial cells (TEC) in the thymus. Oncotarget 8, 24163-24176.
Lauritsen, J.-P. H., Kurella, S., Lee, S.-Y., Lefebvre, J. M., Rhodes, M., Alberola-Ila, J. and Wiest, D. L.(2008). Egr2 is required for Bcl-2 induction during positive selection.J. Immunol.181, 7778-7785.
Lo, W.-L., Donermeyer, D. L. and Allen, P. M.(2012). A voltage-gated sodium channel is essential for the positive selection of CD4(+) T cells.Nat. Immunol.13, 880-887.
Lu, Y., Li, J., Cheng, J. and Lubahn, D. B.(2015). Genes targeted by the Hedgehog-signaling pathway can be regulated by Estrogen related receptor beta.
BMC Mol. Biol.16, 19.
Lucas, J. A., Miller, A. T., Atherly, L. O. and Berg, L. J.(2003). The role of Tec family kinases in T cell development and function.Immunol. Rev.191, 119-138. Mandhan, P., Quan, Q. B., Beasley, S. and Sullivan, M.(2006). Sonic hedgehog, BMP4, and Hox genes in the development of anorectal malformations in Ethylenethiourea-exposed fetal rats.J. Pediatr. Surg.41, 2041-2045.
Martin, G. R.(1998). The roles of FGFs in the early development of vertebrate limbs.
Genes Dev.12, 1571-1586.
Montes, M., Coiras, M., Becerra, S., Moreno-Castro, C., Mateos, E., Majuelos, J., Oliver, F. J., Hernandez-Munain, C., Alcami, J. and Sune, C.(2015). Functional consequences for apoptosis by Transcription Elongation Regulator 1 (TCERG1)-mediated Bcl-x and Fas/CD95 alternative splicing.PLoS ONE10, e0139812. Moran, A. E., Holzapfel, K. L., Xing, Y., Cunningham, N. R., Maltzman, J. S.,
Punt, J. and Hogquist, K. A.(2011). T cell receptor signal strength in Treg and iNKT cell development demonstrated by a novel fluorescent reporter mouse.
J. Exp. Med.208, 1279-1289.
Naito, T., Tanaka, H., Naoe, Y. and Taniuchi, I.(2011). Transcriptional control of T-cell development.Int. Immunol.23, 661-668.
Ono, M., Tanaka, R. J. and Kano, M. (2014). Visualisation of the T cell differentiation programme by canonical correspondence analysis of transcriptomes.BMC Genomics15, 1028.
Outram, S. V., Varas, A., Pepicelli, C. V. and Crompton, T.(2000). Hedgehog signaling regulates differentiation from double-negative to double-positive thymocyte.Immunity13, 187-197.
Outram, S. V., Hager-Theodorides, A. L., Shah, D. K., Rowbotham, N. J., Drakopoulou, E., Ross, S. E., Lanske, B., Dessens, J. T. and Crompton, T. (2009). Indian hedgehog (Ihh) both promotes and restricts thymocyte differentiation.Blood113, 2217-2228.
Park, J.-H., Adoro, S., Guinter, T., Erman, B., Alag, A. S., Catalfamo, M., Kimura, M. Y., Cui, Y., Lucas, P. J., Gress, R. E. et al.(2010). Signaling by intrathymic cytokines, not T cell antigen receptors, specifies CD8 lineage choice and promotes the differentiation of cytotoxic-lineage T cells. Nat. Immunol. 11, 257-264.
Pazin, D. E. and Albrecht, K. H.(2009). Developmental expression of Smoc1 and Smoc2 suggests potential roles in fetal gonad and reproductive tract differentiation.Dev. Dyn.238, 2877-2890.
Puls, K. L., Hogquist, K. A., Reilly, N. and Wright, M. D.(2002). CD53, a thymocyte selection marker whose induction requires a lower affinity TCR-MHC interaction than CD69, but is up-regulated with slower kinetics.Int. Immunol.14, 249-258.
Ramsbottom, S. A. and Pownall, M. E.(2016). Regulation of Hedgehog signalling inside and outside the cell.J. Dev. Biol.4, 23.
Ringnér, M.(2008). What is principal component analysis?Nat. Biotechnol.26, 303-304.
Rosenbaum, S., Kreft, S., Etich, J., Frie, C., Stermann, J., Grskovic, I., Frey, B., Mielenz, D., Pöschl, E., Gaipl, U. et al.(2011). Identification of novel binding partners (annexins) for the cell death signal phosphatidylserine and definition of their recognition motif.J. Biol. Chem.286, 5708-5716.
Rowbotham, N. J., Hager-Theodorides, A. L., Cebecauer, M., Shah, D. K., Drakopoulou, E., Dyson, J., Outram, S. V. and Crompton, T.(2007). Activation of the Hedgehog signaling pathway in T-lineage cells inhibits TCR repertoire selection in the thymus and peripheral T-cell activation.Blood109, 3757-3766. Rowbotham, N. J., Hager-Theodorides, A. L., Furmanski, A. L., Ross, S. E.,
Outram, S. V., Dessens, J. T. and Crompton, T.(2009). Sonic hedgehog negatively regulates pre-TCR-induced differentiation by a Gli2-dependent mechanism.Blood113, 5144-5156.
Sacedón, R., Varas, A., Hernández-López, C., Gutiérrez-deFrı́as, C., Crompton, T., Zapata, A. G. and Vicente, A.(2003). Expression of hedgehog proteins in the human thymus.J. Histochem. Cytochem.51, 1557-1566.
Sahni, H., Ross, S., Barbarulo, A., Solanki, A., Lau, C.-I., Furmanski, A., Saldaña, J. I., Ono, M., Hubank, M., Barenco, M. et al.(2015). A genome wide transcriptional model of the complex response to pre-TCR signalling during thymocyte differentiation.Oncotarget6, 28646-28660.
Saldaña, J. I., Solanki, A., Lau, C.-I., Sahni, H., Ross, S., Furmanski, A. L., Ono, M., Holländer, G. and Crompton, T.(2016). Sonic Hedgehog regulates thymic epithelial cell differentiation.J. Autoimmun.68, 86-97.
Sarkar, F. H., Li, Y., Wang, Z. and Kong, D.(2010). The role of nutraceuticals in the regulation of Wnt and Hedgehog signaling in cancer.Cancer Metastasis Rev.29, 383-394.
Sasaki, H., Nishizaki, Y., Hui, C., Nakafuku, M. and Kondoh, H. (1999). Regulation of Gli2 and Gli3 activities by an amino-terminal repression domain: implication of Gli2 and Gli3 as primary mediators of Shh signaling.Development 126, 3915-3924.
Sekiya, T., Kashiwagi, I., Yoshida, R., Fukaya, T., Morita, R., Kimura, A., Ichinose, H., Metzger, D., Chambon, P. and Yoshimura, A. (2013). Nr4a receptors are essential for thymic regulatory T cell development and immune homeostasis.Nat. Immunol.14, 230-237.
Shah, D. K., Hager-Theodorides, A. L., Outram, S. V., Ross, S. E., Varas, A. and Crompton, T. (2004). Reduced thymocyte development in sonic hedgehog knockout embryos.J. Immunol.172, 2296-2306.
Shi, J., Getun, I., Torres, B. and Petrie, H. T.(2016). Foxn1[Cre] expression in the male germline.PLoS ONE11, e0166967.
Singer, N. G., Fox, D. A., Haqqi, T. M., Beretta, L., Endres, J. S., Prohaska, S., Parnes, J. R., Bromberg, J. and Sramkoski, R. M.(2002). CD6: expression during development, apoptosis and selection of human and mouse thymocytes.
Int. Immunol.14, 585-597.
Singer, A., Adoro, S. and Park, J.-H.(2008). Lineage fate and intense debate: myths, models and mechanisms of CD4- versus CD8-lineage choice.Nat. Rev. Immunol.8, 788-801.
Solanki, A., Lau, C.-I., Saldaña, J. I., Ross, S. and Crompton, T.(2017). The transcription factor Gli3 promotes B cell development in fetal liver through repression of Shh.J. Exp. Med.214, 2041-2058.
Starr, T. K., Jameson, S. C. and Hogquist, K. A.(2003). Positive and negative selection of T cells.Annu. Rev. Immunol.21, 139-176.
Takahama, Y.(2006). Journey through the thymus: stromal guides for T-cell development and selection.Nat. Rev. Immunol.6, 127-135.
te Welscher, P., Fernandez-Teran, M., Ros, M. A. and Zeller, R.(2002). Mutual genetic antagonism involving GLI3 and dHAND prepatterns the vertebrate limb bud mesenchyme prior to SHH signaling.Genes Dev.16, 421-426.
Vantourout, P. and Hayday, A.(2013). Six-of-the-best: unique contributions of gammadelta T cells to immunology.Nat. Rev. Immunol.13, 88-100.
Wang, B., Fallon, J. F. and Beachy, P. A.(2000). Hedgehog-regulated processing of Gli3 produces an anterior/posterior repressor gradient in the developing vertebrate limb.Cell100, 423-434.
Weinreich, M. A. and Hogquist, K. A.(2008). Thymic emigration: when and how T cells leave home.J. Immunol.181, 2265-2270.
Xue, L., Chiang, L., Kang, C. and Winoto, A.(2008). The role of the PI3K-AKT kinase pathway in T-cell development beyond the beta checkpoint.
Eur. J. Immunol.38, 3200-3207.
Zhu, M., Brown, N. K. and Fu, Y.-X.(2010). Direct and indirect roles of the LTbetaR pathway in central tolerance induction.Trends Immunol.31, 325-331. Zuklys, S., Gill, J., Keller, M. P., Hauri-Hohl, M., Zhanybekova, S., Balciunaite,
G., Na, K.-J., Jeker, L. T., Hafen, K., Tsukamoto, N. et al.(2009). Stabilized beta-catenin in thymic epithelial cells blocks thymus development and function.
J. Immunol.182, 2997-3007.
DEVEL
Figure S1: Expression of TCR
β
and TCR
γδ
in WT and Gli3-deficient E17.5+4
Days FTOCs.
(A) Histograms showing the expression of TCR
β
, gated on SP4 cells from Gli3+/+
and Gli3-/-. (B) Scatter plot showing the percentage of TCR
β
+ and TCR
γδ
+ cells in
the SP4 population from Gli3+/+ and Gli3-/- (n=3).
Figure S2: Principal Component Analyses of E18.5 WT and Gli3-mutant
facs-sorted CD69-DP, CD69+DP and SP4 populations.
PCA of the CD69-DP (A), the CD69+DP (C) and SP4 (E) datasets. Eigenvalues and
percentage variability associated with each principal component for CD69-DP (B),
the CD69+DP (D) and SP4 (F).
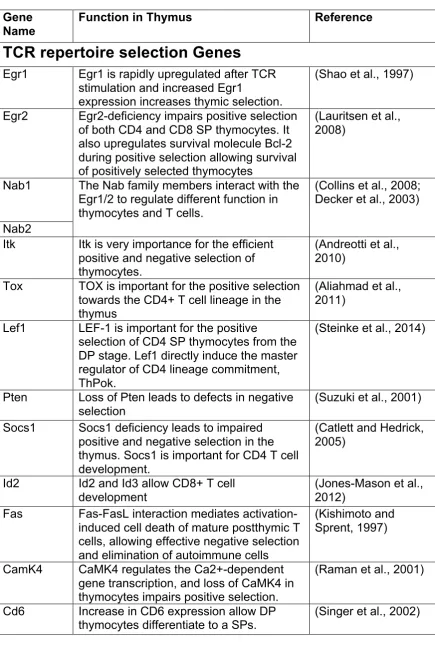
Table S1: Summary of intersected DEG and PCA genes annotated in the
heatmap (Figure 6) of known relevant function.
Gene
Name
Function in Thymus
Reference
TCR repertoire selection Genes
Egr1
Egr1 is rapidly upregulated after TCR
stimulation and increased Egr1
expression increases thymic selection.
(Shao et al., 1997)
Egr2
Egr2-deficiency impairs positive selection
of both CD4 and CD8 SP thymocytes. It
also upregulates survival molecule Bcl-2
during positive selection allowing survival
of positively selected thymocytes
(Lauritsen et al.,
2008)
Nab1
The Nab family members interact with the
Egr1/2 to regulate different function in
thymocytes and T cells.
(Collins et al., 2008;
Decker et al., 2003)
Nab2
Itk
Itk is very importance for the efficient
positive and negative selection of
thymocytes.
(Andreotti et al.,
2010)
Tox
TOX is important for the positive selection
towards the CD4+ T cell lineage in the
thymus
(Aliahmad et al.,
2011)
Lef1
LEF-1 is import