http://dx.doi.org/10.4236/ami.2015.52004
The Method of Flotation Froth Image
Segmentation Based on Threshold Level Set
Ji Zhao, Huibin Wang, Lina Zhang, Conghui Wang
Department of Software Engineering, University of Science and Technology Liaoning, Anshan, China Email: [email protected]
Received 13 March 2015; accepted 24 April 2015; published 27 April 2015
Copyright © 2015 by authors and Scientific Research Publishing Inc.
This work is licensed under the Creative Commons Attribution International License (CC BY). http://creativecommons.org/licenses/by/4.0/
Abstract
A novel flotation froth image segmentation based on threshold level set method is put forward in view of the problem of over-segmentation and under-segmentation which occurs when the exist- ing method segmented the flotation froth images. Firstly, the proposed method adopts histogram equalization to improve the contrast of the image, and then chooses the upper threshold and lower threshold from grey value of histogram of the image equalization, and complete image segmenta-tion using the level set method. In this paper, the model which integrates edge with region level set model is utilized, and the speed energy term is introduced to segment the target. Experimental results show that the proposed method has better segmentation results and higher segmentation efficiency on the images with under-segmentation and incorrect segmentation, and it is meaning- ful for ore dressing industrial.
Keywords
Flotation Froth Image Segmentation, Active Contour Model, Histogram Equalization, Speed Function, Threshold Level Set
1. Introduction
region to extract the features. Mohammad [4] proposed a method based on modified mark watershed to measure the size of flotation froth which can measure the size of froth more accurate and automatic.
There are so many methods for segmenting image. However, recently the level set method [5]-[7] in the field of image segmentation is becoming one of the most popular and successful methods. There are two broad cate-gories in the existing active contour model, such as the boundary-based active contour model [8] and the re-gion-based active contour model [9]. In 1997, Caselles and Sapior [10] etal. put forward geodesic active con-tour (GAC) model with no free parameters which has utilized the gradient information of image to makes the evolving curve to stop on the target boundary. In 2002, Chan and Vese [11] proposed the region-based model called Chan-Vese (C-V) model which overcome the boundary-based model in the sensitivity of original location. And the model used the target and the difference of relevant pixel values to extract the targets. In order to im- prove the accuracy of object edge positioning, Sagiv [12] put forward the integrated active contour model (IAC) in 2005 which merges the boundary-based model with the region-based model. Jianmin Qiao [13] combined energy constraints with the traditional GAC mode to stabilize in numerical calculation. In addition, in order to improve the efficiency of segmentation, Khalif [14] presented a new speed function to achieve the target seg-mentation from the background of the image.
Recently, flotation froth image segmentation method at home and abroad mainly concentrates edge explora-tion method and watershed segmentaexplora-tion method, due to edge exploraexplora-tion method claims to the high light inten-sity, so the accuracy of the algorithm will be greatly influenced. Although watershed segmentation method avoids this issue, it is so easy to cause the problem of under-segmentation and incorrect segmentation that the accuracy of segmentation decreases.
In order to solve the shortcomings arising from conventional flotation bubble image segmentation method, a novel flotation froth image segmentation based on threshold level set method is put forward in view of the prob-lem of under-segmentation and incorrect segmentation which occurs when the existing method segmented the flotation froth images. Firstly, the proposed method adopts histogram equalization to improve the contrast of the image, and then chooses the upper threshold and lower threshold from grey value of histogram of the image equalization, and complete image segmentation using the level set method. In this paper, the model which inte- grates edge with region level set model is utilized, and the speed energy term is introduced to segment the target. Experimental results show the feasibility and effectiveness of threshold level set model.
2. The Novel Proposed Model
2.1. IAC Model
2.1.1. GAC Model
Caselles [15] proposed the active contour model which is not dependent on the free parameters. The energy functional is as follows:
( )
( ) inside
d d d
C
C
E C =
∫
g s c+∫∫
g x y (1)Though the variational level set method, the above formula will be revised as functional on the embedding function:
( )
( )
d d(
1( )
)
d dE u g H u x y c g H u x y
Ω Ω
=
∫∫
∇ +∫∫
− (2)where variational level set the gradient descent of flow is as follows:
u u
div g cg
t δ µε u
∂ = ∇ +
∂ ∇ (3) The c is a constant speed function, g is the edge function,
H
ε( )
z
is a Heaviside function, δε is a derivative of regularized Heaviside function. That is:( )
(
1)
, 1
g z K R
z K
= ∈
( )
1 2 1 arctan2 π
z Hε z
ε
= +
(5)
( )
2 2 1 π z z εε
δ
ε
=+ (6) The GAC model is only suitable for the single value image, in order to realize the vector image segmentation, Caselles and Sapiro [16] proposed a new vector image GAC model, the gradient descent flow of variational level set method is:
color color
u u
div g cg
t δ µε u
∂ = ∇ +
∂ ∇ (7) In the formula gcolor is a function of image edge vector. That is,
(
)
color 1 2
g =g
λ λ
− (8) where λ λ1, 2 are the two characteristic values.2.1.2. C-V Model
When the image not only has no obvious boundary but also the lack of obvious texture feature, it is difficult to achieve a successful segmentation. In the image, the difference between object and background may also re- present the average gray value was different. The image is divided into two parts of internal and external Ω1,
2
Ω , the internal and external average gray level image exactly reflect the gray level between the object and the background of the average value, then the closed curve can be seen as the object contour. Based on the idea, C-V model is proposed. The energy functions as follows:
(
)
(
)
(
)
1 2
2 2
1, 2, Cd 1 1 d d 2 2 d d
E c c C
µ
sλ
I c x yλ
I c x yΩ Ω
=
∫
+∫∫
− +∫∫
− (9)It has three variables: scalar c1, c2, and the curve C. The first one C is the whole arc length. The second and third respectively are the square error between internal and external area’s grey value with scalar c1, c2.
In the literature the C-V model will be extended to functional for vector images.
(
)
(
( ) ( ))
(
( ) ( ))
1 2
2 2
1 2 1 1 2 2
1 1
1 1
, , d d d d d
m m
i i i i
C
i i
E c c C s I c x y I c x y
m m
µ
λ
λ
= =
Ω Ω
=
∫
+∫∫
∑
− +∫∫
∑
− (10)where 1
(
1( ) ( )1, 12, , 1( ))
, 2(
( ) ( )21, 22 , , 2( ))
m m
c = c c c c = c c c express the two m dimensional vector.
The above formula utilizes the variational level set method to be revised as functional on the embedding func-tion:
(
)
( )
( )(
( ))
( )
( )
(
( ))
( )
2
1 2 1 1
1 2
2 2
1
, , d d d d
d d m i i i m i i i
E c c u u u x y I c H u x y
I c I H u x y
µ δ
λ
λ
= Ω Ω = Ω = ∇ + − + − − ∑
∫∫
∫∫
∑
∫∫
(11)So in the function u of fixed conditions, relative to c1 and c2 minimization can be obtained:
( )
( )
d d
, 1, 2, 1, , d d j j i i j
I x y
c j i m
x y Ω
Ω
= = =
∫∫
∫∫
(12)That is the internal and external average vector images in current zero level set.
( )
(
( ))
2 ( )(
( ))
21 1 2 2
1 1
m m
i i i i
i i
u u
div I c I c
t δ µε u = λ = λ
∂ = ∇ − − + −
∂ ∇
∑
∑
(13)2.1.3. IAC Model
Although the region-based C-V model overcomes the drawback of GAC model, it is not in favor of the contours evolving into the object boundaries quickly and accurately. However the boundary-based GAC model lacks the ability of global segmentation. So the Integrated Active Contour (IAC) Model put forward, the energy functional is as follows:
(
)
( )(
( ) ( ))
( )(
( ) ( ))
1 2
2 2
1 2 color 1 1 2 2
1 1
1 1
, , d d d d d
m m
i i i i i i
C
i i
E c c C g s I c x y I c x y
m m
µ
λ
λ
= =
Ω Ω
=
∫
+∫∫
∑
− +∫∫
∑
− (14)where variational level set the gradient descent of flow is as follows:
(
)
( )
( )(
( ))
( )
( )
(
( ))
( )
2
1 2 color 1 1
1
2
2 2
1
, , d d d d
1 d d
m i i i m i i i
E c c u u g u x y I c H u x y
I c H u x y
µ δ λ
λ = Ω Ω = Ω = ∇ + − + − −
∑
∫∫
∫∫
∑
∫∫
(15)In the function u of fixed conditions, the minimization results of c1 and c2 is the same as formula (12). And under fixed c1 and c2 conditions, the relative to u minimize type can be obtained:
( )
(
( ))
2 ( )(
( ))
2color 1 1 2 2
1 1
m m
i i i i
i i
u u
div g I c I c
t δ µε u = λ = λ
∂ = ∇ − − + −
∂ ∇
∑
∑
(16)2.2. The Threshold Speed Item
The GAC model cannot accurate segment the object with deep low-lying regions, therefore this paper intro-duces a constant speed which set to c in IAC model to guide curve evolution, the energy functional is defined the by:
(
)
( )(
( ) ( ))
( )(
( ) ( ))
1 2
2 2
1 2 color color 1 1 2 2
1 1
1 1
, , d d d d d d d
m m
i i i i i i
C C
i i
E c c C g s c g x y I c x y I c x y
m m
µ
λ
λ
= =
Ω Ω
=
∫
+∫∫
+∫∫
∑
− +∫∫
∑
− (17)where variational level set the gradient descent of flow is as follows:
( )
(
( ))
2 ( )(
( ))
2color color 1 1 2 2
1 1
m m
i i i i
i i
u u
div g cg I c I c
t δ µε u = λ = λ
∂ = ∇ + − − + −
∂ ∇
∑
∑
(18)However, the parameter by improperly choosing will lead to edge leakage or slower convergence speed, thus a speed function is introduced V as follows:
(
)
color
1
V
=
g
−
βκ
(19)where β is the constant parameter which controls the smoothness of active contour, and κ denotes curvature. Edge function can only reflect the local gray level change of image rather than the actual image edge. There is a segmentation method called threshold segmentation method which seeks a suitable grey value and then the two classifications are obtained by comparing it with each of image gray level value. Finally, the image of ob-ject and background are formed to complete the image segmentation. The novel threshold speed function is in-troduced V as follows:
( ) (
1)
( )
2 2
U L U L
P I = − −I− +
(21) where U, L are represent upper threshold and lower threshold, respectively. In the formula (21), the intensity I is equal to the value
(
U
+
L
)
2
.The formula (21) makes the active contours enclose the boundary of region whose intensities are in the inter-val
[
L U
,
]
. The termP I
( )
based on image intensity I causes the model to contract regions and expand over with gray values within the specified interval[
L U
,
]
. The threshold level set model controls the active contours to capture the regions of interest by adjusting parameters L and U.2.3. Combining Threshold Speed Item and IAC Model
In this section, threshold speed item is combined shape priors and IAC model. The total energy is defined by
(
)
( )(
( ) ( ))
( )(
( ) ( ))
1 2
2 2
1 2 color color 1 1 2 2
1 1
1 1
, , d d d d d d d
m m
i i i i i i
C C
i i
E c c C g s V g x y I c x y I c x y
m m
µ
λ
λ
= =
Ω Ω
=
∫
+∫∫
+∫∫
∑
− +∫∫
∑
− (22)where variational level set the gradient descent of flow is as follows:
(
)
( )(
( ))
2 ( )(
( ))
2color color 1 1 2 2
1 1
1
2 2
m m
i i i i
i i
u u U L U L
div g I g I c I c
t δ µε u α α κ = λ = λ
∂ = ∇ + − − − + + − − − + −
∂ ∇
∑
∑
(23)3. Algorithm Implementation
3.1. Histogram Equalization
Gray histogram of the image reflects the friendship between image grayscale and the probability of occurrence of this kind of grayscale. In order to enhance image contrast, this article adopts the method of histogram equali-zation [17].
Firstly, an array containing G element is set up, statistics of the original image grey values, and then draw the gray-level histogram. Finally, the mapping of gray-scale is realized by histogram transformation, which is writ- ten as:
( )
k0,1,
,
1
h k
=
n
k
=
G
−
(24)where nk is the number of the pixels of the same grey value k. And the formula (24) is written as the probabil-ity of normalized expression
( )
0
1,
0,1,
,
1
s k k k
P S
=
n n
≤
S
≤
k
=
G
−
(25)where sk denotes the kth level of grey value of image, and n denotes the total number of pixels in the image. In addition, image enhancement function is shown as:
a)
E
H( )
s
is single value increasing function, and 0≤ ≤ −S G 1 makes the grayscale still from small to large order after equalization.b)
0
≤
E
H( )
s
≤ −
G
1
always keeps the dynamic range of grayscale unchanged.Cumulative Distribution Function (CDF) must meet the above two requirements at the same time, and the uni-form distribution of t transforms by the distribution of s. While the cumulative distribution functions of s is the cumulative histogram of original image in fact, and then:
( )
( )
0 0
k k
i
k H k s i
i i
n
t E S P S
n
= =
= =
∑
=∑
(26) where tk is a single value increasing function of k, the dynamic range of grayscale is unchanged, and0≤ ≤tk 1.
3.2. Obtaining Upper and Lower Threshold
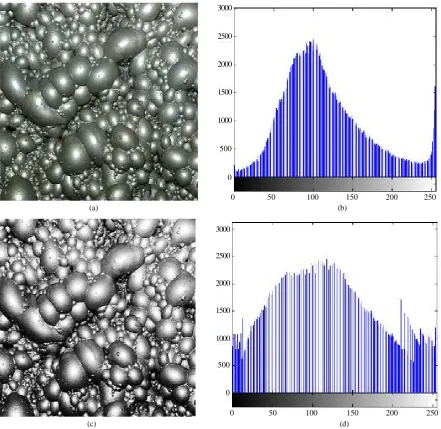
provided for the accurate segmentation process. The original image and the gray level histogram of before and after the equalization of shown as areFigure 1.
This section will be introduced how to obtain the threshold in detail. Such as Figure 1(d), there are two peak valleys which are a and b
(
a
<
b
)
. The gray value which is less than a and greater than b is of smaller propor-tion in the histogram. In the analysis, grayscale less than a is caused by uneven light irradiation in image collec-tion process and then leads to the edges of froth darker shade. While the latter is due to lamplight illuminate the top of the froth. Another crest of figure shows that the number of gray levels between( )
c d
,
is the most and threshold should be expanded to select in order to avoid excessive under segmentation in the process of seg-mentation, a≤ <L c, d<U≤b. The two values are substituted into formula (21), we obtain P I( )
as fol-lows:( )
2 2
b a b a
P I = − − −I +
(27) And then the new speed function V can be gained by substituting P I
( )
into Formula (20).0 0
50 100 150 200 250 500
1000 1500 2500
2000 3000
(a) (b)
0 0
50 100 150 200 250 500
1000 1500 2500
2000 3000
(c) (d)
[image:6.595.94.536.266.695.2]4. Experimental Results and Analysis
In this section, we will use the novel segmentation algorithm proposed in this paper to do experiment, at the same time we also use the watershed segmentation algorithm, the C-V segmentation algorithm and the segmentation algorithm based on IAC method to do experiments.
4.1. Experimental Results
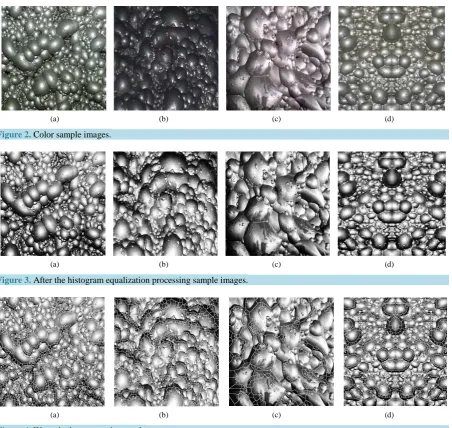
Now we choose the following four images as the experimental images. The sample images used for experiment are shown inFigure 2 and after histogram equalization images are shown in Figure 3.
4.1.1. Watershed Segmentation Method
Watershed segmentation method whose characteristics are intuitive and rapid is chosen to segment flotation forth image, the results are shown in Figure 4.
Because gradient image of many images have a lot of local minimum, so can see the results as shown Figure 4 that there are a myriad of small area boundaries. At the same time watershed algorithm is sensitive to noise. The final segmentation result is not ideal due to the problem of over and under segmentations.
(a) (b) (c) (d)
Figure 2.Color sample images.
(a) (b) (c) (d)
Figure 3. After the histogram equalization processing sample images.
[image:7.595.90.543.283.711.2]
(a) (b) (c) (d)
4.1.2. Level Set Method
[image:8.595.94.497.63.540.2]There are results of three level set segmentation methods in the section. a) C-V model
Figure 5 shows the segmentation results of the C-V which based on region, where the parameters are set to:
100
τ = (Step Length), ε =1.0 (Parameter of Heaviside function and Dirac function) and the iterations Nb_iter = 1300.
As is evident from Figure 5, the results of C-V model are better than watershed method, but the C-V model is initialized again every once in a while which takes more time for segmentation. In addition, the gray level of image is too uneven to correct segmentation. The final segmentation result is not also ideal.
b) IAC model
Figure 6 shows the segmentation results of the IAC, where the parameters are set to: τ =100, ε =1.0 and
the iterations Nb_iter = 800.
The results compared with the above two methods are also improved. Although all the bright spot in the whole picture can be segment and the speed is faster than C-V, the darker regions still cannot be segment. The problem of under segmentation is not solved and the results are unsatisfactory.
c) The novel proposed model
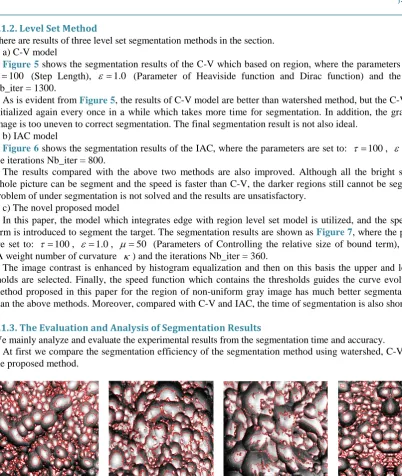
In this paper, the model which integrates edge with region level set model is utilized, and the speed energy term is introduced to segment the target. The segmentation results are shown as Figure 7, where the parameters are set to: τ =100, ε =1.0, µ =50 (Parameters of Controlling the relative size of bound term), α =0.95 (A weight number of curvature κ) and the iterations Nb_iter = 360.
The image contrast is enhanced by histogram equalization and then on this basis the upper and lower thre-sholds are selected. Finally, the speed function which contains the threthre-sholds guides the curve evolution. The method proposed in this paper for the region of non-uniform gray image has much better segmentation effect than the above methods. Moreover, compared with C-V and IAC, the time of segmentation is also shortening.
4.1.3. The Evaluation and Analysis of Segmentation Results
We mainly analyze and evaluate the experimental results from the segmentation time and accuracy.
At first we compare the segmentation efficiency of the segmentation method using watershed, C-V, IAC and the proposed method.
(a) (b) (c) (d)
Figure 5. The model of C-V segmentation result.
(a) (b) (c) (d)
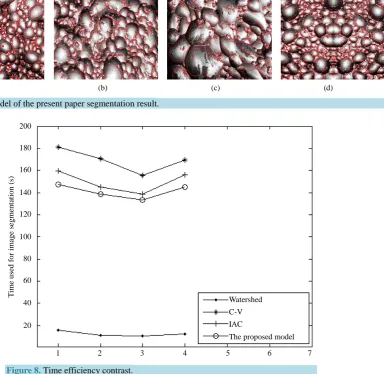
The statistical graph of the time efficiency of four kinds of segmentation method is shown in Figure 8
through experiments and analysis.
As you can see in Figure 8, the segmentation time of the proposed method is much faster than that of C-V and IAC methods, but which is slower than watershed method and the result is that the characteristics of wa-tershed method are intuitive and rapid.
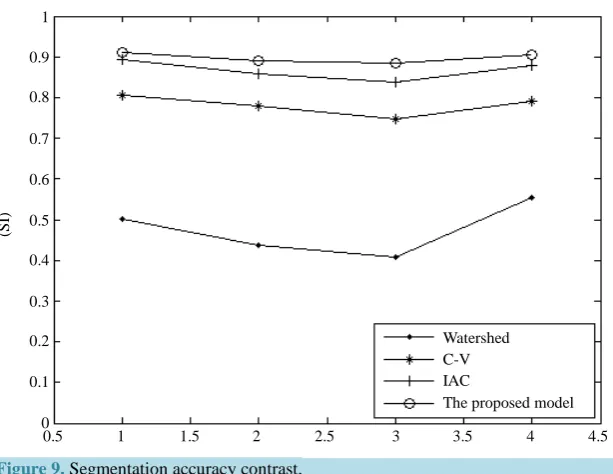
Next the Similarity Index (SI) is utilized to compare the results described on above on the segmentation accu-racy.
In Figure 9, the statistical situation of the SI is shown, respectively.
As you can see in Figure 9, the segmentation accuracy of the proposed method is superior to that of wa-tershed method, C-V method and IAC method.
5. Conclusion
This paper utilizes the Histogram Equalization to enhance image contract to see the size and shape of froth easi-ly, and chooses the upper threshold and lower threshold from grey value of histogram of the image equalization, and complete image segmentation using the level set method. The threshold speed function is introduced in the model which integrates edge with region level set model is adopted to solve the problem of over segmentation and under segmentation. Via the comparison of several groups of experiments, it is proved that the segmentation precision and efficiency of the novel level set segmentation method are improved.
[image:9.595.151.536.344.718.2]
(a) (b) (c) (d)
Figure 7. The model of the present paper segmentation result.
4 3
2 1
20
T
im
e
u
se
d
f
o
r i
m
ag
e s
eg
m
en
ta
ti
o
n
(
s)
Watershed C-V
IAC
The proposed model
5 6 7 40
60 80 100 120 140 160 180 200
0.5 1 1.5 2 2.5 3 3.5 4 4.5 0
0.1 0.2 0.3 0.4 0.5 0.6 0.7 0.8 0.9 1
(S
I)
Watershed C-V IAC
[image:10.595.161.468.81.318.2]The proposed model
Figure 9. Segmentation accuracy contrast.
Acknowledgements
This research is funded by the Education Department of Liaoning Province Foundation grant Number LJQ2014033 and University of Science and Technology Liaoning Foundation grant Number 2013RC08.
References
[1] Vincent, L. and Soille, P. (1991) Watersheds in Digital Spaces: An Efficient Algorithm Based on Immersion Simula-tions. IEEE Transactions on Pattern Analysis and Machine Intelligence, 13, 583-598.
http://dx.doi.org/10.1109/34.87344
[2] Zhao, G.Q., Gu, Y.Y., etal. (2007) A Classification of Flotation Froth Based on Geometry. Mechatronics and Automa-tion, Harbin, 2716-2720.
[3] Liu, J.P., Gui, W.H., Chen, Q., etal. (2013) An Unsupervised Method for Flotation Froth Image Segmentation Evalua-tion Base on Image Gray-Level DistribuEvalua-tion. IEEE Control Conference (CCC), Xi’an, 4018-4022.
[4] Massinaei, M. (2014) Development of a New Algorithm for Segmentation of Flotation Froth Images. Minerals and Metallurgical Processing, 31, 66-72.
[5] Wirthgen, T., Lempe, G. and Zipser, S. (2012) Ulrich Grünhaupt Level-Set Based Infrared Image Segmentation for Automatic Veterinary Health Monitoring. Computer Vision and Graphics, 685-693.
http://dx.doi.org/10.1007/978-3-642-33564-8_82
[6] Wirthgen, T., Zipser, S., Franze, U., etal. (2011) Automatic Segmentation of Veterinary Infrared Images with the Ac-tive Shape Approach. Lecture Notes in Computer Science. Proceedings of 17th Scandinavian Conference on Image Analysis, 435-446. http://dx.doi.org/10.1007/978-3-642-21227-7_41
[7] Lim, P.H., Bagci, U., Aras, O., etal. (2012) A Novel Spinal Vertebrae Segmentation Framework Combining Geome-tric Flow and Shape Prior with Level Set Method. IEEE International Symposium on Biomedical Imaging, Barcelona, 1703-1706. http://dx.doi.org/10.1109/ISBI.2012.6235907
[8] Li, C.M., Xu, C.Y., Gui, C.F., etal. (2005) Level Set Evolution without Re-Initialization: A New Variational Formula-tion. IEEE Conference on Computer Vision and Pattern Recognition, San Diego, 430-436.
[9] Paragios, N. and Deriche, R. (2002) Geodesic Active Regions and Level Set Methods for Supervised Texture Segmen-tation. International Journal of Computer Vision, 46, 223-247. http://dx.doi.org/10.1023/A:1014080923068
[10] Caselles, V., Kimmel, R. and Sapiro, G. (1997) Geodesic Active Contours. International Journal of Computer Vision, 22, 61-79. http://dx.doi.org/10.1023/A:1007979827043
[11] Vese, L. and Chan, T. (2002) A Multiphase Level Set Framework for Image Segmentation Using the Mumford and Shah Model. International Journal of Computer Vision, 50, 271-293. http://dx.doi.org/10.1023/A:1020874308076
Transac-tions on Image Processing, 15, 1633-1646. http://dx.doi.org/10.1109/TIP.2006.871133
[13] Qiao, J.M. (2011) The Improvement of Image Segmentation Based on GAC Model and C-V Model. Harbin Institute of Technology, Harbin.
[14] Khalifa, F., El-Baz, A., Ouseph, R., etal. (2010) Shape-Appearance Guided Level-Set Deformable Model for Image Segmentation. IEEE International Conference on Pattern Recognition, Istanbul, 4581-4584.
[15] Chung, D.H. and Sapiro, G. (2000) On the Level Lines and Geometry of Vector-Valued Image. IEEE, Signal Processing Letters, 7, 241-243.
[16] Sapiro, G. (2001) Geometric Partial Differential Equations and Image Analysis. Cambridge University Press, Cam-bridge. http://dx.doi.org/10.1017/CBO9780511626319