J A N U A R Y 1 9 9 2
WRL
Technical Note TN-23
Boiling Binary Mixtures
at Subatmospheric
Pressures
Wade R. McGillis
John S. Fitch
The Western Research Laboratory (WRL) is a computer systems research group that was founded by Digital Equipment Corporation in 1982. Our focus is computer science research relevant to the design and application of high performance scientific computers. We test our ideas by designing, building, and using real systems. The systems we build are research prototypes; they are not intended to become products.
There is a second research laboratory located in Palo Alto, the Systems Research Cen-ter (SRC). Other Digital research groups are located in Paris (PRL) and in Cambridge, Massachusetts (CRL).
Our research is directed towards mainstream high-performance computer systems. Our prototypes are intended to foreshadow the future computing environments used by many Digital customers. The long-term goal of WRL is to aid and accelerate the development of high-performance uni- and multi-processors. The research projects within WRL will address various aspects of high-performance computing.
We believe that significant advances in computer systems do not come from any single technological advance. Technologies, both hardware and software, do not all advance at the same pace. System design is the art of composing systems which use each level of technology in an appropriate balance. A major advance in overall system performance will require reexamination of all aspects of the system.
We do work in the design, fabrication and packaging of hardware; language processing and scaling issues in system software design; and the exploration of new applications areas that are opening up with the advent of higher performance systems. Researchers at WRL cooperate closely and move freely among the various levels of system design. This allows us to explore a wide range of tradeoffs to meet system goals.
We publish the results of our work in a variety of journals, conferences, research reports, and technical notes. This document is a technical note. We use this form for rapid distribution of technical material. Usually this represents research in progress. Research reports are normally accounts of completed research and may include material from earlier technical notes.
Research reports and technical notes may be ordered from us. You may mail your order to:
Technical Report Distribution
DEC Western Research Laboratory, WRL-2 250 University Avenue
Palo Alto, California 94301 USA
Reports and notes may also be ordered by electronic mail. Use one of the following addresses:
Digital E-net: DECWRL::WRL-TECHREPORTS
Internet: [email protected]
UUCP: decwrl!wrl-techreports
Boiling Binary Mixtures
at Subatmospheric Pressures
*
Wade R. McGillis
John S. Fitch
William R. Hamburgen
**
Van P. Carey
January 1992
*
Ph.D. candidate at the University of California, Berkeley and a WRL intern.
**
Professor of Mechanical Engineering and Applied Science at the University of
Abstract
This study considers boiling binary mixtures of water with methanol or 2-propanol at subatmospheric pressures. Liquid-phase equilibrium vapor pressures, binary phase equilibrium thermodynamic properties, heat trans-fer characteristics, and the critical heat flux (CHF) condition are determined for saturated pool boiling from a localized heat source while varying the con-centrations of methanol and 2-propanol in water. The heat source is an upward-facing copper surface submerged in a laterally-confined, finite pool. Low pressure boiling of aqueous mixtures provides a means of removing high heat fluxes while maintaining low surface temperatures. Small ad-ditions of alcohol to water increase the CHF condition above that of pure water. Higher concentrations of alcohol begin decreasing the CHF condition to that of the pure alcohol. While single-component correlations using mole weighted binary liquid thermodynamic properties have been shown to predict ideal binary mixture boiling behavior, they are unsuccessful in predicting the characteristics of aqueous mixtures. In this study, ther-modynamic properties of the non-ideal aqueous mixtures were either measured, predicted, or taken from the literature. The significance of these results to the use of binary coolants for electronics cooling applications will also be discussed.
This is a preprint of a work-in-progress paper that will be presented at
ITHERM 1992
Austin, Texas, February 5-7, 1992.
Table of Contents
Nomenclature vii
1. Introduction 1
2. Experimental Apparatus 4
3. Binary Phase Liquid-Vapor Equilibria 6
4. Discussion of Results 10
5. Conclusions 20
List of Figures
Figure 1: Representative condenser vapor temperature-time responses in the 3 thermosiphon from McGillis et al. [1991].
Figure 2: Schematic diagram of test system and test section used in pool boiling 4 experiments.
Figure 3: Liquid saturation pressure versus liquid mole fraction for methanol, 8 2-propanol, water, and 0.2 mole fraction methanol.
Figure 4: Liquid phase equilibria for methanol-water. Comparison of ex- 8 perimental data with the non-ideal mixing model.
Figure 5: Methanol phase equilibria and surface tension versus methanol mole 9 fraction in water.
Figure 6: 2-propanol phase equilibria and surface tension versus 2-propanol 9 mole fraction in water.
Figure 7: Variation in the slope of the liquid saturation curve, dP/dT, with mole 10 fraction.
Figure 8: Photographs of boiling from a 1.27 cm square heated surface at 7 kPa. 11
(top)Pure water. (bottom)x2−propanol= 0.5.
Figure 9: Effect of pressure on the nucleate boiling curves for pure water. 12 Figure 10: Effect of pressure on the nucleate boiling curves for pure methanol. 13 Figure 11: Effect of pressure on the nucleate boiling curves for pure 2-propanol. 13 Figure 12: Comparison of pure fluid boiling curves at the same saturation tem- 14
perature.
Figure 13: Boiling curves for varying concentrations of 2-propanol in water. 16 Approximate fit to data for pure fluids plotted for comparison. Tsat=38.9°C.
Figure 14: Boiling curves for varying concentrations of methanol in water. Ap- 17 proximate fit to data for pure fluids plotted for comparison. Tsat=38.9°C.
Figure 15: Effect of pressure on the critical heat flux condition for pure fluids. 18 Figure 16: Effect of concentration of methanol and 2-propanol in water on the 19
Nomenclature
CHF critical heat flux
fi,v fugacity of component i in the vapor
fi,l fugacity of component i in the liquid
g gravity
hlv heat of vaporization
ONB onset of nucleate boiling P pressure
q′′ wall heat flux
q′′chf maximum wall heat flux or critical heat flux
q′′m,Z maximum Zuber wall heat flux
Rc surface active cavity size
td bubble growth and departure time
tw waiting time
Ts liquid saturation temperature
Tw wall or surface temperature
xi component i liquid mole fraction
yi component i vapor mole fraction
Greek Symbols
γi activity coefficient of component i
φi fugacity coefficient of component i
ρl liquid density
ρv vapor density
BOILINGBINARYMIXTURES ATSUBATMOSPHERICPRESSURES
1. Introduction
The goal of practical boiling research is to predict boiling performance. Boiling performance consists of the superheat required for incipience, boiling surface temperature fluctuations, the fully-developed nucleate boiling heat transfer coefficient, and the maximum or critical heat flux condition. In applications where it is desirable to keep the temperature of a boiling surface low while removing the greatest amount of heat, reducing the saturation pressure may be a useful solution. However, reducing the saturation pressure may have an undesirable effect on other aspects of boiling.
A reduction in the saturation pressure causes a corresponding decrease in the saturation or boiling temperature. Consequently, a superheat level is achieved with a lower surface tempera-ture. This approach is particularly useful when water, having a relatively high saturation tem-perature at atmospheric pressure, is used as the boiling liquid. Water is a desirable liquid since it has such a high heat of vaporization, high thermal conductivity, and is toxic and non-flammable.
Boiling in sealed vessels is a typical application of subatmospheric pressure boiling. Heat pipes, thermosiphons, and some heat pump cycles may rely on subatmospheric pressures to provide low surface temperatures while moving significant quantities of heat. For example, it is often desirable to maintain a low temperature on the heated end of a heat pipe or thermosiphon in spot cooling of electronic components. Heat fluxes from current electronic components are
ap-2
proaching 50 W/cm . These fluxes are not easily handled by solid heat sinks. Phase-change heat sinks, which operate with a nearly isothermal interior, are becoming increasingly attractive. Low temperature operation of these heat sinks may be prescribed by creating a saturated liquid and vapor state in the vessel at subatmospheric pressures. Therefore the boiling occurs in the heated end of the vessel at a lower temperature. Knowledge of the boiling characteristics of the small heated surface is necessary to insure that steady and safe operating conditions are main-tained.
BOILINGBINARYMIXTURES ATSUBATMOSPHERICPRESSURES
Unfortunately, a result of boiling water at subatmospheric pressures is low-frequency bubble departure, creating surface temperature gradients and surface temperature oscillations. This phenomenon is seen in Figure 1 from the study of McGillis et al. (1991). Figure 1 shows the
2
condenser vapor temperature versus time measurements for a heat flux of 5 W/cm for water at three different subatmospheric pressures. Rises in the condenser vapor temperature indicate boiling activity.
In some electronics cooling applications, it is necessary to keep the boiling behavior steady, with uniform heat removal. Pure water at subatmospheric pressures does not easily provide these attributes, particularly at low fluxes. Under some conditions, the boiling performance can be improved by adding a second lighter liquid to water. This would be classified as boiling of a binary mixture. Despite the numerous studies of binary mixture boiling processes over the past 50 years, very little is known about the mechanisms responsible for their behavior. State-of-the-art review State-of-the-articles by Shock (1982) and Thome and Shock (1984) provide an extensive overview of prior multicomponent boiling research. There is also a dearth of information in the literature regarding boiling of water with organic liquids at subatmospheric pressures from horizontal sur-faces. Bonilla and Perry (1941) investigated combinations of water, ethanol, n-butanol, and acetone from a horizontal chromium plate at pressures ranging from 20 to 130 kPa.
In this investigation, experiments were performed to determine if an aqueous mixture could be used as the working fluid in a two-phase thermosiphon used to cool electronics. This study considers binary mixtures of water with methanol or 2-propanol at subatmospheric pressure be-cause their properties are well documented, high purity levels are commercially available, and they are relatively safe fluids. Liquid-phase equilibrium vapor pressures, binary phase equi-librium thermodynamic properities, heat transfer characteristics, and the critical heat flux con-dition were determined for saturated pool boiling from a localized heat source. The concentra-tions of methanol and 2-propanol in water were varied. The apparent physical effects and sig-nificant findings are discussed.
BOILINGBINARYMIXTURES ATSUBATMOSPHERICPRESSURES
0
20
40
60
80
time (seconds)
0
50
10
20
30
40
vapor temperature (C)
P=10.4 kPa
P=6.3 kPa
P=2.6 kPa
[image:15.612.160.457.110.401.2]q’’ = 5 W/cm2
Figure 1: Representative condenser vapor temperature-time
BOILINGBINARYMIXTURES ATSUBATMOSPHERICPRESSURES
2. Experimental Apparatus
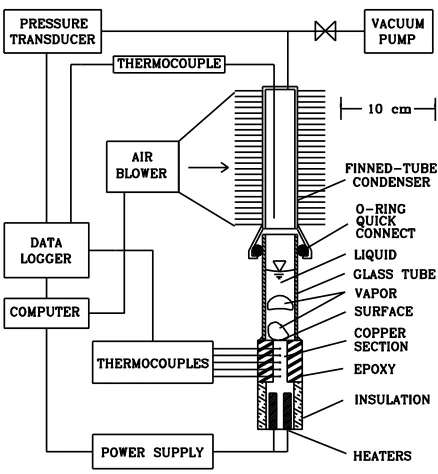
[image:16.612.177.396.200.437.2]Figure 2 shows the experimental test section and system used in this investigation. The cop-per test section was machined to accommodate two cartridge heaters in the bottom end. The top half of the copper piece was milled to provide a long 1.27 x 1.27 cm square section. Within this section, 0.8 mm holes were drilled to the center to hold thermocouple wires. The copper and thermocouples were then cast in a low viscosity epoxy. The main body of the pool boiling con-tainer was made with 2.5 cm I.D. tubing.
Figure 2: Schematic diagram of test system and test section used in pool boiling experiments.
In order to examine boiling at pressures below 10 kPa, various experimental designs were considered. Nucleate boiling is very dependent on cavity size, distribution, and wetting properties. The most difficult extraneous nucleation sites to control were at the interface be-tween the copper test section and the epoxy. This interface had to maintain a vacuum seal after thermal cycling. The Ablebond 342-13 epoxy that was eventually selected, adhered and sealed well to the copper. Once the epoxy cured, the top surface of the copper could be treated. Excess epoxy was milled down flush with the copper surface. The copper/epoxy surface was then finished with #320 emery paper and cleaned with alcohol. The epoxy surface was then bonded to the end of a glass tube to allow observations. The clear tube fit inside an O-ring fitting at the bottom of the condenser so that repeated assembly was simple. The condenser was made of a long section of copper tubing which had radial copper fins wound and soldered onto its O.D. Heat was removed from the fins with an air blower.
The top end of the condenser tube was equipped with several sensors. A thermocouple probe extended down through the inside of the tube and could be positioned vertically to monitor fluid or vapor temperatures. A transducer measured the internal pressure of the thermosiphon. During initial start up of the system, a valve allowed a two-stage vane-type vacuum pump to pull the internal pressure down to very low values. The liquid was boiled during this step to remove
BOILINGBINARYMIXTURES ATSUBATMOSPHERICPRESSURES
gasses from the internal volume. A second de-aerated fluid was added to the system via a septa and syringe to keep non-condensible gases out. Once the system was filled, the thermodynamics were verified. A computer and control algorithm varied the blower speed as needed, and proved able to keep the saturation temperature, T , within 1s °C during continuous boiling. This main-tained the internal pressure constant within 0.27 kPa.
A datalogger recorded the temperatures and system pressure, with a sampling rate of up to 1000 Hz. A linear fit of the measured temperature gradient in the copper section was used to calculate the test section heat flux and the heated surface temperature. Experiments and 2-D numerical analyses indicate that the heat losses from the test section were less than 6%, and that the average heat flux at the boiling surface, q′′, could be determined within 3%. Experimental uncertainties in the pressure and differential temperature measurements were 0.1 kPa and 0.1°C, respectively.
Steady state for the entire experiment was determined by monitoring the temperature changes with time via the datalogger and computer. When a particular surface was extended to the criti-cal heat flux condition, the final, highest heat flux for which the system reached steady state for nucleate boiling was used as the CHF data point.
Data presented in this paper were measured with a stationary liquid pool height of 7.1 cm. The pressures investigated ranged from about 7 to 83 kPa. Heat flux levels off the 1.27 x 1.27 cm
2
BOILINGBINARYMIXTURES ATSUBATMOSPHERICPRESSURES
The Boiling Process in the Thermosiphon
The thermosiphon used in this study could operate in a variety of boiling regimes, from low heat flux, evaporative heat transfer, through nucleate boiling, to critical heat flux or dry out. When there was no heat supplied to the system, and the liquid and vapor were at thermodynamic equilibrium, the pressure in the system corresponded to the saturation pressure at the system temperature. The liquid became superheated with the application of very low heat fluxes. Heat was removed by evaporation at the liquid-vapor free surface and subsequent condensation oc-curred at the condenser walls.
At higher heat flux levels, the liquid became superheated enough to allow bubble growth from cavities on the heated surface. As in any superheated system, the onset of nucleation in a cavity depends on: 1) residual gasses or vapor in the cavity; 2) the size, shape and material of the cavity; 3) the liquid and vapor thermophysical properties; and 4) the amount that the liquid is superheated. If all of the necessary criteria for bubble growth have been met, a bubble may grow and release from the heated surface. It is expected that when the bubble grows and departs from the surface, colder fluid will replace the highly superheated fluid. Since bubble growth depends on a sufficient superheating of the surrounding liquid, an appreciable time may be required to reheat the liquid in the vicinity of the wall to a superheated state and initiate subsequent bubble growth. This time is termed the waiting time, t .w
The length of time from the beginning of bubble growth to bubble departure, t , depends ond how large the bubble must become for release to occur. This interval therefore depends on the rate at which the bubble grows to departure size. The departure bubble size is determined from the net effect of forces acting on the bubble as it grows on the surface. Surface tension holds the bubble down. For an upward-facing horizontal surface, buoyancy pulls the bubble up. If the bubble grows rapidly, the inertia associated with the induced liquid flow around the bubble may also tend to pull the bubble away. Bulk liquid motions may also produce lift forces on the bub-ble causing it to be pulled away.
At higher heat flux levels t decreases, and the number of active nucleation sites and the fre-w quency of bubble departure increases. As the flux increases, the boiling becomes more con-tinuous.
The critical heat flux is not a boiling regime but the maximum heat flux attainable before the system makes a transition to film boiling. For most applications, a transition to film boiling is unacceptable because of the very large wall temperature excursions.
3. Binary Phase Liquid-Vapor Equilibria
The thermophysical properties of the fluid mixture must be determined before boiling perfor-mance can be predicted. For example, incipience, heat transfer coefficients and critical heat flux are heavily dependent on the fluid properties. State-of-the-art methods for predicting binary mixture boiling phenomena require interpretations of the mixture properties and the mixture phase equilibria characteristics. One’s problems are not solved once the equilibrium binary mix-ture properties are determined. Non-equilibrium conditions and the transport of the properties have important effects.
BOILINGBINARYMIXTURES ATSUBATMOSPHERICPRESSURES
The pressure and other thermophysical properties of a binary mixture can be determined from ideal and non-ideal mixture relationships. In both ideal and non-ideal mixtures, the chemical potential of component i in the liquid is equal to the chemical potential of component i in the vapor (see any thermodynamic textbook). The auxiliary function, fugacity, related to the chemi-cal potential, was created to simplify the abstract concepts of the chemichemi-cal potential (see Praus-nitz et al. (1986)). It is shown that the fugacity of component i in the liquid is also equal to the fugacity of component i in the vapor.
fi,v= fi,l (1)
The fugacity of component i in the vapor is related to the total pressure by
fi,v=φiy Pi (2)
and the fugacity of component i in the liquid is related to the saturation pressure of pure com-ponent i by
fi,l=γi ix Ppure,i (3)
where φi is the fugacity coefficient, γi is the activity coefficient, and y and x are the the vapori i and liquid mole fractions of component i, respectively. For low pressure, φi= 1 is a very good approximation. However, γi is not unity for non-ideal mixtures (see Prausnitz et al. (1986)). Substituting (2) and (3) into (1), it follows that
φiy P =i γi ix Ppure,i (4)
and using the fact that y + y = 1 and x + x = 1, the saturation pressure of the mixture can bei j i j expressed as
Pmix= xi iγ Ppure,i+ (1−x )i γjPpure, j (5) Rearranging equation (4), the vapor pressure of the mixture is related to the vapor mole fraction by
γix Pi pure,i
Pmix= (6)
yi
Experiments were performed in order to determine whether the non-ideal binary mixture be-havior agreed well with the current predictive methodology shown above. In these experiments, it was implicitly assumed that only small volumes of liquid were needed to occupy the vapor volume. Thus, the liquid composition was assumed not to change throughout the experiments. The saturation pressures for pure fluids and fluid mixtures were measured at different tempera-tures. Some measured pressures are plotted along with equation (5) in Figure 3. Figure 4 shows the liquid portion of the phase-equilibrium diagram for methanol-water at different temperatures. Measured values are plotted along with equation (5). It is quite apparent from Figures 3 and 4 that the liquid phase equilibria can be predicted by the above models.
BOILINGBINARYMIXTURES ATSUBATMOSPHERICPRESSURES
0
10
20
30
40
50
60
70
temperature (C)
0
120
20
40
60
80
100
pressure (kPa)
methanol 2-propanol x =0.2m
[image:20.612.116.420.75.372.2]water eqn (5)
Figure 3: Liquid saturation pressure versus liquid mole fraction for
methanol, 2-propanol, water, and 0.2 mole fraction methanol.
0
0.2
0.4
0.6
0.8
1
liquid mole fraction methanol
0
100
20
40
60
80
pressure (kPa)
T=60.0 C T=38.9 C T=28.8 C eqn. (5)
Figure 4: Liquid phase equilibria for methanol-water. Comparison of
experimental data with the non-ideal mixing model.
[image:20.612.119.419.407.695.2]BOILINGBINARYMIXTURES ATSUBATMOSPHERICPRESSURES
0
0.2
0.4
0.6
0.8
1
mole fraction methanol
0
70
10
20
30
40
50
60
pressure (kPa)
methanol T=38.9C
surface tension (dynes/cm)
liquid line
[image:21.612.160.454.76.365.2]vapor line
Figure 5: Methanol phase equilibria and surface tension versus methanol mole fraction in water.
0
0.2
0.4
0.6
0.8
1
mole fraction 2-propanol
0
70
10
20
30
40
50
60
pressure (kPa)
2-propanol T=38.9C
surface tension (dynes/cm)
liquid line
vapor line
[image:21.612.161.454.397.686.2]BOILINGBINARYMIXTURES ATSUBATMOSPHERICPRESSURES
4. Discussion of Results
Onset of Boiling or Boiling Incipience
Bubble growth depends on surface characteristics, fluid properties, and available superheat. Bubble growth is expected to take place from an active cavity (cavity with residual gasses or vapor) when the surrounding liquid reaches the required superheat. The following estimate of superheat required for the onset of nucleation,∆TONB, can be derived from static equilibrium.
2σ
∆TONB= (7)
R (dP/dT)c sat
Equation (7) indicates that the wall superheat required for the onset of nucleation is determined by the liquid surface tension,σ(see Figures 5 and 6), the active surface cavity size, and the slope of the vapor pressure curve, dP/dT (see Figure 7). The value dP/dT for pure and binary mixtures can be calculated by taking the derivative of Equation (5). Fluids with a low surface tension, such as alcohols, will wet a given surface better and have a lower contact angle than higher surface tension fluids such as water. With a high surface tension fluid, the value of R may bec much greater than it would be with a lower surface tension fluid. As shown in Figures 5 and 6, the water/alcohol mixture surface tension is reduced from that of pure water. This change is extreme for the water/2-propanol mixture shown in Figure 6.
0
0.2
0.4
0.6
0.8
1
liquid mole fraction alcohol
0.2
1.6
0.4
0.6
0.8
1
1.2
1.4
dP/dT (kPa/C)
T=38.9C P=Psat(38.9C)
methanol
[image:22.612.115.418.342.634.2]2-propanol
Figure 7: Variation in the slope of the liquid saturation curve, dP/dT, with mole fraction.
2
As seen in Figure 8, for an average wall heat flux of 5 W/cm and a pressure of 7 kPa, the boiling behavior for pure water is different from that of the xpropanol= 0.5 mixture. With the addition of alcohol to water, more and smaller bubbles are generated from the surface.
BOILINGBINARYMIXTURES ATSUBATMOSPHERICPRESSURES
Boiling of Pure Fluids
Figure 9 is a comparison of the nucleate boiling data obtained for water at two different sub-atmospheric pressures. A reduction in the pressure for a saturated water system shifted the boil-ing curve to higher wall superheat (Tw−T ) levels. However, the decrease in the saturation tem-s
perature associated with lower pressures more than compensated for this effect, resulting in lower wall temperatures for a given heat flux. The shift in the boiling curves may be attributed to a combination of effects. Lower pressures resulted in lower vapor densities and larger bubbles. The lower pressure increased the minimum superheat required for nucleation, resulting in a delayed onset. Also, greater fluid viscosities result from lower fluid temperatures, reducing the production of small eddies behind the growing and departing bubbles, thus reducing heat transfer. As can be seen in Figure 9, fluctuations in the wall superheat are more prevalent at 4 kPa.
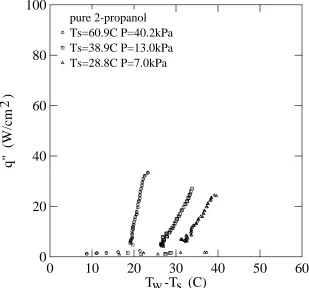
The general increase of wall superheat with decreasing pressure is also seen in the pure 2-propanol and methanol boiling results shown in Figures 10 and 11, respectively. The pure methanol and 2-propanol boiling systems do not have discernible temperature fluctuations caused by intermittent boiling, however, both of these systems have a wall temperature
over-2
shoot or excursion at heat fluxes less than 10 W/cm . Both pure methanol and 2-propanol on copper surfaces are low contact angle fluids that wet the surface well. A well-wetting fluid can significantly reduce R which, in turn, significantly increasesc ∆TONB, causing a large tempera-ture overshoot at incipience.
0
10
20
30
40
50
60
T -T (C)
w s
0
100
20
40
60
80
q" (W/cm )
2
pure water
Ts=38.9C P=6.9kPa Ts=28.8C P=4.0kPa
Figure 9: Effect of pressure on the nucleate boiling curves for pure water.
[image:24.612.111.421.381.673.2]BOILINGBINARYMIXTURES ATSUBATMOSPHERICPRESSURES
0
10
20
30
40
50
60
T -T (C)
w s
0
100
20
40
60
80
q" (W/cm )
2
pure methanol Ts=60.9C P=83kPa Ts=38.9C P=32kPa Ts=28.8C P=19kPa
Figure 10: Effect of pressure on the nucleate boiling curves for pure methanol.
0
10
20
30
40
50
60
T -T (C)
w s
0
100
20
40
60
80
q" (W/cm )
2
[image:25.612.150.457.80.371.2] [image:25.612.148.457.408.696.2]BOILINGBINARYMIXTURES ATSUBATMOSPHERICPRESSURES
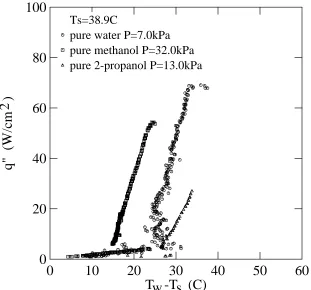
As seen in Figure 12, for a given boiling system saturation temperature of 38.9°C, the pure water handled the highest heat flux but demonstrated unsteady boiling behavior at low heat fluxes. The wall temperature of the methanol system was the lowest and provided steady boiling behavior. The 2-propanol system operates with steady boiling behavior but has a relatively small critical heat flux and the highest wall temperature.
0
10
20
30
40
50
60
T -T (C)
w s
0
100
20
40
60
80
q" (W/cm )
2
Ts=38.9C
pure water P=7.0kPa pure methanol P=32.0kPa pure 2-propanol P=13.0kPa
Figure 12: Comparison of pure fluid boiling curves at the same saturation temperature.
[image:26.612.112.423.159.449.2]BOILINGBINARYMIXTURES ATSUBATMOSPHERICPRESSURES
Boiling of Aqueous Mixtures
Figure 13 compares boiling curves of water and 2-propanol mixtures. The system temperature was maintained at 38.9°C. In each figure, the binary mixture boiling curve is plotted against the pure fluids at the same system temperature. Additions of water to 2-propanol decreased the wall superheat from that of pure 2-propanol. Additions of 2-propanol to water also reduced the fluc-tuations in wall temperature from that of pure water. This was due to the reduction in the bubble departure size. Although the average wall superheat did not significantly vary through the range of concentrations of 2-propanol in water, the magnitude of the critical heat flux did, reading a maximum in the vicinity of x2−propanol= 0.03.
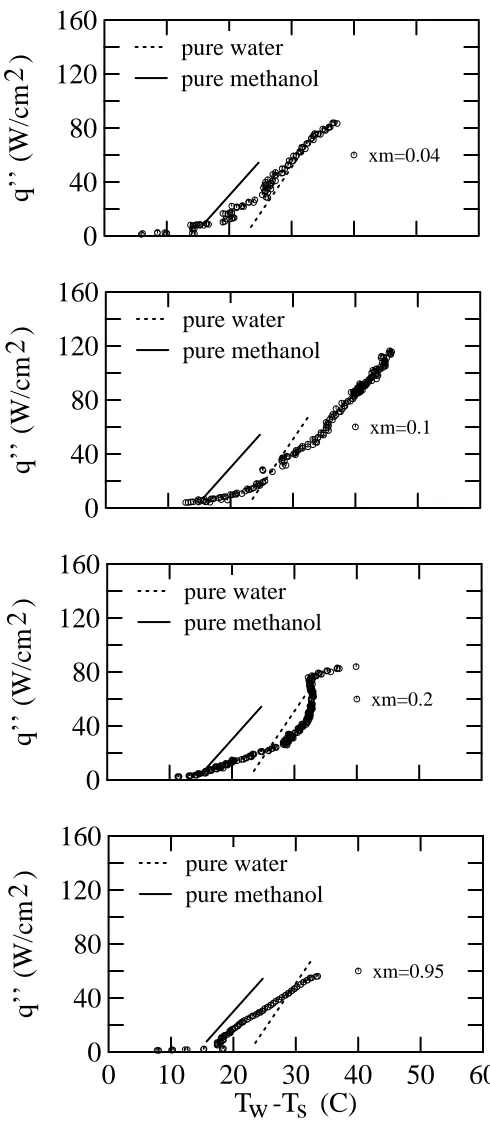
Figure 14 compares boiling curves of water and methanol mixtures. The system temperature was maintained at 38.9°C. In each figure, the binary mixture boiling curve is plotted against the pure fluids at the same system temperature. Additions of water to methanol reduced the wall superheat from that of pure methanol and reduced the fluctuations in wall temperature from that of pure water. The critical heat flux condition reached a a maximum in the vicinity of
x2−methanol= 0.1.
Complex mechanisms govern the binary mixture boiling process. Binary mixture properties have multiple effects on the onset condition (Equation (7)) and therefore on the range of active cavities. The smaller the value of∆TONB, the more sites of size R will be active. An additionalc effect on the boiling process is the mass transfer resistance which takes place during the growth of the binary mixture vapor bubble. As a binary mixture vapor bubble grows from the surface, evaporation depletes the more volatile fluid (in this case alcohol) from the liquid-vapor interface. Because immediate diffusion or convection of the more volatile fluid to the interface is not pos-sible, the rate of evaporation is impeded. Consequently, the departing vapor bubbles are smaller and the amount of heat absorbed due to evaporation is reduced.
BOILINGBINARYMIXTURES ATSUBATMOSPHERICPRESSURES
0
10
20
30
40
50
60
T -T (C)
w s
0
160
40
80
120
q’’ (W/cm )
2
pure water pure 2-propanol xp=0.50
160
40
80
120
q’’ (W/cm )
2
pure water pure 2-propanol xp=0.20
160
40
80
120
q’’ (W/cm )
2
pure water pure 2-propanol xp=0.030
160
40
80
120
q’’ (W/cm )
2
pure water pure 2-propanol xp=0.0150
160
40
80
120
q’’ (W/cm )
2
pure water pure 2-propanol
xp=0.006
Figure 13: Boiling curves for varying concentrations of 2-propanol in water.
[image:28.612.192.439.62.699.2]BOILINGBINARYMIXTURES ATSUBATMOSPHERICPRESSURES
0
10
20
30
40
50
60
T -T (C)
w s
0
160
40
80
120
q’’ (W/cm )
2
pure water pure methanol xm=0.950
160
40
80
120
q’’ (W/cm )
2
pure water pure methanol xm=0.20
160
40
80
120
q’’ (W/cm )
2
pure water pure methanol xm=0.10
160
40
80
120
q’’ (W/cm )
2
pure water pure methanol
[image:29.612.179.424.94.658.2]xm=0.04
BOILINGBINARYMIXTURES ATSUBATMOSPHERICPRESSURES
Critical Heat Flux
To avoid the risk of film boiling and accompanying high surface temperatures, the ability to predict the CHF condition is useful. The effect of pressure on the critical heat flux condition for pure fluids is shown in Figure 15. For the range of pressures considered, increasing the pressure increased the CHF condition. This is consistent with the CHF behavior observed for a variety of other pool boiling circumstances. A commonly used model which predicts the critical heat flux in saturated pool boiling for a surface of infinite extent is given by Zuber (1959). For low pres-sures, the Zuber critical heat flux is
1 1
2 4
q′′m,Z= 0.131ρv h (glv ρ σl ) (8)
Zuber’s analysis assumes the critical heat flux is attained when the large vapor jets leaving the surface become Helmholtz unstable. Notice that q"m, Z varies with √ ρv, so that with a given increase in pressure, there is a corresponding increase in the vapor density, and the critical heat flux is increased. An increase in the density of the vapor allows more energy removal per unit volume of departing vapor.
0
20
40
60
80
100
120
pressure (kPa)
0
160
20
40
60
80
100
120
140
q" (W/cm )
2
chf
2-propanol methanol water
[image:30.612.114.422.327.615.2]Zuber correlation
Figure 15: Effect of pressure on the critical heat flux condition for pure fluids.
BOILINGBINARYMIXTURES ATSUBATMOSPHERICPRESSURES
The critical heat flux condition of the aqueous mixtures considered in this study is not monotonic with concentration. Small additions of alcohol to water increased the CHF condition above that of pure water. Higher concentrations of alcohol began decreasing the CHF condition to that of the pure alcohol. Figure 16 shows CHF data for water/alcohol systems of this study. As seen in Figure 16, the data of this investigation could not be predicted by the basic Zuber model, particularly at low pressures.
0
0.2
0.4
0.6
0.8
1
liquid mole fraction alcohol
20
160
40
60
80
100
120
140
q" (W/cm )
2
chf
measured data and approximate fit Temp=38.9C, P=Psat(38.9C)
2-propanol
[image:31.612.147.455.186.476.2]methanol
BOILINGBINARYMIXTURES ATSUBATMOSPHERICPRESSURES
5. Conclusions
This experimental work investigated the boiling of aqueous mixtures from a small horizontal surface in a finite pool at subatmospheric pressures. The results support the following conclu-sions.
1. In pure water systems, intermittent bubble departures cause large surface temperature oscil-lations at low fluxes. Large bubbles at low pressure cause significant downwash of cool liquid adjacent to the wall and subsequent wall temperature fluctuations. Binary mixtures reduce the size of the bubbles, thereby reducing the surface temperature oscillations.
2. In pure alcohol systems, bubble sizes are reduced, relative to pure water, and temperature fluctuations are smaller.
3. Water/alcohol mixtures at subatmospheric pressures provide a means of maintaining low wall temperatures without the large wall temperature fluctuations characteristic of pure water systems.
4. Binary phase equilibrium properties are predictable and are an important element in under-standing binary mixture boiling.
5. For pure water, methanol, and 2-propanol at subatmospheric pressures, the CHF condition for the small heated surfaces of this study deviates from the Zuber CHF predictions. The CHF condition for pure 2-propanol is small relative to pure methanol and pure water.
6. For water/alcohol mixtures at subatmospheric pressures, the CHF condition for the small heated surfaces is not monotonic with concentration. The CHF condition is increased above those of pure fluids with small concentrations of the alcohol.
The boiling behavior of water/alcohol binary liquid mixtures is not well understood or predict-able. Future research directions could include quantifying surface temperature fluctuations with fluid and pressure, correlating both nucleate boiling behavior and the CHF condition, and quan-titatively determining the actual vaporizing liquid concentrations.
BOILINGBINARYMIXTURES ATSUBATMOSPHERICPRESSURES
References
[1] C. F. Bonilla and C. W. Perry.
Heat Transmission to Boiling Binary Liquid Mixtures.
Chemical Engineering Progresses Symposium Series 37:685-705, 1941.
[2] R. Cole and H. L. Shulman.
Bubble Departure Diameters at Subatmospheric Pressures.
Chemical Engineering Progresses Symposium Series 62, No. 64:6-16, 1967.
[3] C. P. Costello, C. O. Bock, and C. C. Nichols.
A Study of Induced Convective Effects on Pool Boiling Burnout.
Chemical Engineering Progresses Symposium Series 61:271-280, 1965.
[4] W. R. McGillis, V. P. Carey, J. S. Fitch and W. R. Hamburgen.
Pool Boiling on Small Dissipating Elements at Subatmospheric Pressure.
In Proceedings on Phase Change Heat Transfer, pages 27-36. 1991 ASME National Heat Transfer Conference, Minneapolis,Minnesota, July, 1991.
[5] A. Niro and G. P. Beretta.
Boiling Regimes in a Closed Two-Phase Thermosyphon.
International Journal of Heat and Mass Transfer 33(10):2099-2110, 1990.
[6] J. M. Prausnitz, R. N. Lichtenthaler, E. Gomes de Azevedo.
Molecular Thermodynamics of Fluid-Phase Equilibria.
Prentice-Hall, New Jersey, 1986. Second Edition.
[7] I. A. Raben, R. T. Beaubouef, and G. E. Commerford.
A Study of Heat Tranfer in Nucleate Pool Boiling of Water at Low Pressure.
Chemical Engineering Progresses Symposium Series 61(57):249-257, 1965.
[8] R. A. W. Shock.
Multiphase Science and Technology.
Hemisphere Publishing Corp., New York, 1982.
[9] J. R. Thome, R. A. W. Shock.
Advances in Heat Transfer.
Academic Press, Inc., New York, 1984.
[10] S. J. D. Van Stralen.
Heat Transfer to Boiling Binary Liquid Mixtures at Atmospheric and Subatmospheric Pressures.
Chemical Engineering Sciences 5:290-296, 1956.
[11] S. J. D. Van Stralen, R. Cole, W.M. Sluyter, and M. S. Sohal.
Bubble Growth Rates in Nucleate Boiling of Water at Subatmospheric Pressures.
International Journal of Heat and Mass Transfer 18:655-669, 1975.
[12] N. Zuber.
Hydrodynamic Aspects of Boiling Heat Transfer.
BOILINGBINARYMIXTURES ATSUBATMOSPHERICPRESSURES
BOILINGBINARYMIXTURES ATSUBATMOSPHERICPRESSURES
WRL Research Reports
‘‘Titan System Manual.’’ ‘‘MultiTitan: Four Architecture Papers.’’
Michael J. K. Nielsen. Norman P. Jouppi, Jeremy Dion, David Boggs, Mich-WRL Research Report 86/1, September 1986. ael J. K. Nielsen.
WRL Research Report 87/8, April 1988. ‘‘Global Register Allocation at Link Time.’’
David W. Wall. ‘‘Fast Printed Circuit Board Routing.’’ WRL Research Report 86/3, October 1986. Jeremy Dion.
WRL Research Report 88/1, March 1988. ‘‘Optimal Finned Heat Sinks.’’
William R. Hamburgen. ‘‘Compacting Garbage Collection with Ambiguous WRL Research Report 86/4, October 1986. Roots.’’
Joel F. Bartlett.
‘‘The Mahler Experience: Using an Intermediate WRL Research Report 88/2, February 1988. Language as the Machine Description.’’
David W. Wall and Michael L. Powell. ‘‘The Experimental Literature of The Internet: An WRL Research Report 87/1, August 1987. Annotated Bibliography.’’
Jeffrey C. Mogul.
‘‘The Packet Filter: An Efficient Mechanism for WRL Research Report 88/3, August 1988. User-level Network Code.’’
Jeffrey C. Mogul, Richard F. Rashid, Michael ‘‘Measured Capacity of an Ethernet: Myths and
J. Accetta. Reality.’’
WRL Research Report 87/2, November 1987. David R. Boggs, Jeffrey C. Mogul, Christopher A. Kent.
‘‘Fragmentation Considered Harmful.’’ WRL Research Report 88/4, September 1988. Christopher A. Kent, Jeffrey C. Mogul.
WRL Research Report 87/3, December 1987. ‘‘Visa Protocols for Controlling Inter-Organizational Datagram Flow: Extended Description.’’
‘‘Cache Coherence in Distributed Systems.’’ Deborah Estrin, Jeffrey C. Mogul, Gene Tsudik,
Christopher A. Kent. Kamaljit Anand.
WRL Research Report 87/4, December 1987. WRL Research Report 88/5, December 1988. ‘‘Register Windows vs. Register Allocation.’’ ‘‘SCHEME->C A Portable Scheme-to-C Compiler.’’
David W. Wall. Joel F. Bartlett.
WRL Research Report 87/5, December 1987. WRL Research Report 89/1, January 1989.
‘‘Editing Graphical Objects Using Procedural ‘‘Optimal Group Distribution in Carry-Skip
Ad-Representations.’’ ders.’’
Paul J. Asente. Silvio Turrini.
WRL Research Report 87/6, November 1987. WRL Research Report 89/2, February 1989. ‘‘The USENET Cookbook: an Experiment in ‘‘Precise Robotic Paste Dot Dispensing.’’
Electronic Publication.’’ William R. Hamburgen.
Brian K. Reid. WRL Research Report 89/3, February 1989.
BOILINGBINARYMIXTURES ATSUBATMOSPHERICPRESSURES
‘‘Simple and Flexible Datagram Access Controls for ‘‘Link-Time Code Modification.’’
Unix-based Gateways.’’ David W. Wall.
Jeffrey C. Mogul. WRL Research Report 89/17, September 1989. WRL Research Report 89/4, March 1989.
‘‘Noise Issues in the ECL Circuit Family.’’ Jeffrey Y.F. Tang and J. Leon Yang. ‘‘Spritely NFS: Implementation and Performance of
WRL Research Report 90/1, January 1990. Cache-Consistency Protocols.’’
V. Srinivasan and Jeffrey C. Mogul.
‘‘Efficient Generation of Test Patterns Using WRL Research Report 89/5, May 1989.
Boolean Satisfiablilty.’’ Tracy Larrabee.
‘‘Available Instruction-Level Parallelism for
Super-WRL Research Report 90/2, February 1990. scalar and Superpipelined Machines.’’
Norman P. Jouppi and David W. Wall.
‘‘Two Papers on Test Pattern Generation.’’ WRL Research Report 89/7, July 1989.
Tracy Larrabee.
WRL Research Report 90/3, March 1990. ‘‘A Unified Vector/Scalar Floating-Point
Architec-ture.’’
‘‘Virtual Memory vs. The File System.’’ Norman P. Jouppi, Jonathan Bertoni, and David
Michael N. Nelson. W. Wall.
WRL Research Report 90/4, March 1990. WRL Research Report 89/8, July 1989.
‘‘Efficient Use of Workstations for Passive Monitor-‘‘Architectural and Organizational Tradeoffs in the
ing of Local Area Networks.’’ Design of the MultiTitan CPU.’’
Jeffrey C. Mogul. Norman P. Jouppi.
WRL Research Report 90/5, July 1990. WRL Research Report 89/9, July 1989.
‘‘A One-Dimensional Thermal Model for the VAX ‘‘Integration and Packaging Plateaus of Processor
9000 Multi Chip Units.’’ Performance.’’
John S. Fitch. Norman P. Jouppi.
WRL Research Report 90/6, July 1990. WRL Research Report 89/10, July 1989.
‘‘1990 DECWRL/Livermore Magic Release.’’ ‘‘A 20-MIPS Sustained 32-bit CMOS
Microproces-Robert N. Mayo, Michael H. Arnold, Walter S. Scott, sor with High Ratio of Sustained to Peak
Perfor-Don Stark, Gordon T. Hamachi. mance.’’
WRL Research Report 90/7, September 1990. Norman P. Jouppi and Jeffrey Y. F. Tang.
WRL Research Report 89/11, July 1989.
‘‘Pool Boiling Enhancement Techniques for Water at Low Pressure.’’
‘‘The Distribution of Instruction-Level and Machine
Wade R. McGillis, John S. Fitch, William Parallelism and Its Effect on Performance.’’
R. Hamburgen, Van P. Carey. Norman P. Jouppi.
WRL Research Report 90/9, December 1990. WRL Research Report 89/13, July 1989.
‘‘Writing Fast X Servers for Dumb Color Frame Buf-‘‘Long Address Traces from RISC Machines:
fers.’’ Generation and Analysis.’’
Joel McCormack. Anita Borg, R.E.Kessler, Georgia Lazana, and David
WRL Research Report 91/1, February 1991. W. Wall.
WRL Research Report 89/14, September 1989.
BOILINGBINARYMIXTURES ATSUBATMOSPHERICPRESSURES
‘‘A Simulation Based Study of TLB Performance.’’ J. Bradley Chen, Anita Borg, Norman P. Jouppi. WRL Research Report 91/2, November 1991. ‘‘Analysis of Power Supply Networks in VLSI
Cir-cuits.’’ Don Stark.
WRL Research Report 91/3, April 1991.
‘‘TurboChannel T1 Adapter.’’ David Boggs.
WRL Research Report 91/4, April 1991. ‘‘Procedure Merging with Instruction Caches.’’ Scott McFarling.
WRL Research Report 91/5, March 1991. ‘‘Don’t Fidget with Widgets, Draw!.’’ Joel Bartlett.
WRL Research Report 91/6, May 1991.
‘‘Pool Boiling on Small Heat Dissipating Elements in Water at Subatmospheric Pressure.’’
Wade R. McGillis, John S. Fitch, William R. Hamburgen, Van P. Carey.
WRL Research Report 91/7, June 1991.
‘‘Incremental, Generational Mostly-Copying Gar-bage Collection in Uncooperative Environ-ments.’’
G. May Yip.
WRL Research Report 91/8, June 1991.
‘‘Interleaved Fin Thermal Connectors for Multichip Modules.’’
William R. Hamburgen.
WRL Research Report 91/9, August 1991.
‘‘Experience with a Software-defined Machine Ar-chitecture.’’
David W. Wall.
BOILINGBINARYMIXTURES ATSUBATMOSPHERICPRESSURES
WRL Technical Notes
‘‘TCP/IP PrintServer: Print Server Protocol.’’ ‘‘Systems for Late Code Modification.’’ Brian K. Reid and Christopher A. Kent. David W. Wall.
WRL Technical Note TN-4, September 1988. WRL Technical Note TN-19, June 1991.
‘‘TCP/IP PrintServer: Server Architecture and Im- ‘‘Unreachable Procedures in Object-oriented
Pro-plementation.’’ gramming.’’
Christopher A. Kent. Amitabh Srivastava.
WRL Technical Note TN-7, November 1988. WRL Technical Note TN-21, November 1991. ‘‘Smart Code, Stupid Memory: A Fast X Server for a ‘‘Cache Replacement with Dynamic Exclusion’’
Dumb Color Frame Buffer.’’ Scott McFarling.
Joel McCormack. WRL Technical Note TN-22, November 1991.
WRL Technical Note TN-9, September 1989.
‘‘Boiling Binary Mixtures at Subatmospheric Pres-‘‘Why Aren’t Operating Systems Getting Faster As sures’’
Fast As Hardware?’’ Wade R. McGillis, John S. Fitch, William
John Ousterhout. R. Hamburgen, Van P. Carey.
WRL Technical Note TN-11, October 1989. WRL Technical Note TN-23, January 1992. ‘‘Mostly-Copying Garbage Collection Picks Up
Generations and C++.’’ Joel F. Bartlett.
WRL Technical Note TN-12, October 1989. ‘‘Limits of Instruction-Level Parallelism.’’ David W. Wall.
WRL Technical Note TN-15, December 1990. ‘‘The Effect of Context Switches on Cache
Perfor-mance.’’
Jeffrey C. Mogul and Anita Borg.
WRL Technical Note TN-16, December 1990. ‘‘MTOOL: A Method For Detecting Memory
Bot-tlenecks.’’
Aaron Goldberg and John Hennessy.
WRL Technical Note TN-17, December 1990. ‘‘Predicting Program Behavior Using Real or
Es-timated Profiles.’’ David W. Wall.
WRL Technical Note TN-18, December 1990.