IMPACT OF SOFTWARE RISK MANAGEMENT ON
ANALYSIS MODELING IN LIFE CYCLE OF WEB
APPLICATION DEVELOPMENT
J.ALJABRI
Student at King Abdulaziz University E-mail: [email protected]
ABSTRACT
Various branches of engineering use models effectively to reduce complexity, document analysis steps and facilitate communication within the development team. And this applies to software engineering and web engineering. Modeling aims to provide detailed sufficient descriptions to accomplish the system we want to build, modeling easily produces patterns represent specific forms of the system and supposed to be comprehensive. Because of privacy web applications the general framework of web application development is surrounded by many risks related with time pressure, the need for rapid release within environment its requirements are constantly changed . Thus time commitment Issue will be more important than waiting to achieve some requirements, this is the reason causes several parallel versions , depending on reuse parts, components and integrating it within the application. Also web development procedure have to adapt dynamically with the complexity of the application, quality we want. Any malfunction occurs during web development procedure life cycle; even on level of aesthetic appearance of web application; will lead to accumulated problems making internet users runaway the product, and this will illustrate the importance of this paper. In this paper, we will discuss impact of risk management on analysis modeling within web application development framework, we will explore its levels (content – navigation – presentation ) and impact of risk management on each level, supported by review system of scientific papers as an example to show the impact of risk management on analysis modeling and increasing the
chances of success.
Keywords: Web Application, Analysis , Modeling, Level, Risk, Management.
1. INTRODUCTION
Because, the wide spread of internet and development of its applications from static pages with some hypertexts to integrated systems provide complex services, the necessity of development special ways suite it is increased, and a special engineering related with web applications is born and clearly differs from followed software engineering to development systems. The reason of difference is the nature of web applications and its privacy. Web engineering [1] is the application of systematic and quantifiable approaches (concepts, methods, techniques, tools) to cost-effective requirements analysis, design, implementation, testing, operation, and maintenance of high quality web applications. Risk management [2] is a process that is used to minimize or eradicate risk before it can harm the productivity of a software project. Risk management in software engineering [3] is related to the various future harms that could be
Discussion will be distributed along the tow followed sections, we show an example illustrating the levels of analysis modeling in web applications and impact of risk management on it in section 4,
section 5 contains measurement of risk
management quality on previous example, we finally conclude in section 6.
2. LITERATUREREVIEW
Previously, there are two ways [2] that software engineers can handle risk. A reactive software engineer corrects a problem as it occurs, while a proactive software engineer starts thinking about possible risks in a project before they occur. A risk can be distributed along two aspects: risk probability and risk loss. These aspects are used to estimate the impact or Risk Exposure (RE) [4], as follows: RE= P(UO) . L(UO) where, RE: is the Risk
Exposure (or risk impact). P(UO) : is the probability of an unsatisfactory outcome. L(UO): is the loss associated to unsatisfactory outcome. Appreciation of risk probability is not a plain task and can not be 100% accurate. Some probability appreciation techniques use equations, risk-probability table or checklists [5],[4] where other techniques use subjective Bayesian approach [6] . Software
development has three viewpoints : project,process
and product , exploring these viewpoints we can say that each one of them affected by different types of
risks. For example, the “personnel shortfalls” risk
affects the project, “poor testing” affects process
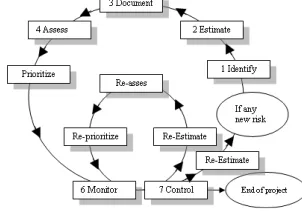
[image:2.595.303.523.222.419.2]whereas “product with wrong functionality” affects product[7]. thus we can conclude that risk management is becoming an important issue from these three viewpoints. There are many different software risk management tactics, some are called models and others called methods or framework, all of them have the same goal (managing the risk). SoftRisk model [8] is used to manage software risks. Figure.1 illustrates the steps of SoftRisk model.
Figure 1 : Steps of SoftRisk Model
This model depends on documenting , using historical risk data then focusing on top risks to reduce the effort and time in managing software risks.
[image:2.595.111.262.621.730.2]Riskit method [9] is presented by Jyrki Kontio and aim to manage software risk, the pattern of this method is shown in figure 2.
Figure 2 : Graph of Riskit Method
Riskit method depends on the idea of providing support to all relevant stakeholders in risk management process . The method is attached with analysis graph and uses a ranking technique called Riskit Pareto Ranking which uses probability and utility loss ranking . The users by ProRisk framework [10] ; which is an open system ; can determine a choice from published models or use different models to fill their project needs. It is suitable for small and large software projects. In this framework, a detailed analysis is needed to provide factor of project risk.
3. CHALLENGESOFWEBAPPLICATIONS
A number of challenges can be seen in the field of web applications development. We will list the most important properties of web applications and related challenges.
• Networks : Networks in key web
applications, and must serve a variety customers used different platforms.
• Concurrency : Concurrency in using
• Non prediction loading : The number of users is changing dramatically from time to time, it is expected that the application must process indefinite number of events at the same time.
• Performance : It contains performance
testing , load testing and stress testing
[12].If web application user have to wait a long time ; for any reason maybe long processing of server side ; he will leave to other websites (click button).
• Availability : web application must be
available (24 hours daily, 7 days weekly, year round) for more than one user at the same time, more than one link to the content.
• Content sensitive : quality , aesthetic of
content is considered as a main factor of web application efficiency [13] .
• Continuing evolution : unlike to other
software applications web applications are
developed, updated in very short periods.
More than, some of them (especially
content) is updated every few minutes .
• Immediacy : in spite of software
application try to reach market ASAP, web applications have very short available time (only days or weeks), so web engineers must use methods suite compressed timetable [14]. Direct links to the content.
• Security : sensitive contents must be
protected, safe methods transportation must be used.
• Aesthetics : look web application and user
feel, is undeniable part of application ability to attract users, so importance of
aesthetic appearance of the web
application equals the technical and programmatic design [15].
• Self-explanation : web application must
explain itself by the way of presenting it.
We can conclude that : web application have become a common type of modern software application , it is growing very fast compared with the traditional software which makes them an important part of engineering. We must carefully consider to running and deployment environment of web development as well as the significance of
related challenges or risks. Ideally, management of web application risks should be done along the whole life cycle, we chose analysis modeling from this life cycle to be discussed in the following section.
4. IMODELING LEVELS IN WEB
APPLICATIONANDRELATEDRISKS
We can talk about three levels when we want to model web applications which are content, navigation and presentation. Separation of these levels allows the reuse and reduces complexity [16].
4.1 Content Modeling
Information remains the most thing the web applications provide to users. Content modeling means information and application logics, the goal of content modeling [17] is making information structure stable even if information itself is changed. We benefited from the conference
review system with WSDM [18] to provide web
system for registering and reviewing papers in an conference as an example .
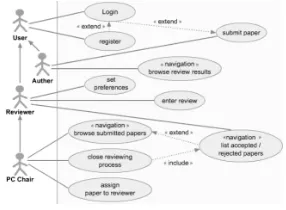
Figure 3 shows use case diagram, three reviewers
[image:3.595.336.479.443.548.2]must explore and chick the paper
.
Figure 3 : Use Case Diagram of The System
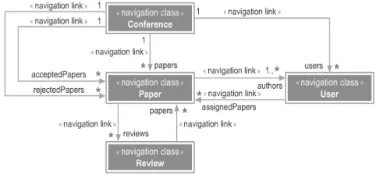
Figure 4 illustrates class diagram, the conference receives many topics and related to many users ( registers in conference and owners or reviewers the papers ).
[image:3.595.340.473.631.720.2]It is noticed that there is a restriction says : the author mustn't be a viewer of his own paper. State diagram is represented by figure 5. After deadline we can assign three reviewers, if evaluation exceeded a threshold the paper will be accepted else rejected , in both previous cases an e-mail will be sent to the author. When the ready paper is delivered to print it is printed then published.
Figure 5 : State Diagram of The System
4.2 Navigation Modeling
It means making the content as a nodes and links among them. Navigation modeling goal is to describe available paths of navigation for users [19], to get effective navigation we need to redundant providing for information by more than one node in navigation level. For our example we need three viewers for author, reviewer and manager of committee (pc chair). Figure 6 shows navigation model for pc viewer, pc can see all received papers and can explore lists of accepted and rejected papers in addition to reviewers profiles.
Figure 6 : Navigation Model of PC
4.3 Presentation Modeling
[image:4.595.100.278.241.302.2]It interests user interface and page layout. The goal of presentation modeling is to make the interaction between user and web application self-explaining and simple, so focus will be on unified structure layout for pages that provides a clear badge making web application recognized by the users. Figure 7 illustrates tow pages of our system.
Figure 7 : Pages of Paper and Author
We can use sequence diagrams to represent user interaction with the web application. Figure 8 shows sequence diagram to retrieve list of assigned papers.
Figure 8 : Assigned Papers Sequence Diagram
Now, after exploring modeling levels we will discuss the related risks depending on the features mentioned above in section 3. We will classify the risks into three fields: first, known risks and these are found after evaluating the system of interest. In common, it will relate with all previous features and more relating to performance, availability, self-explanation and immediacy. Second, unknown risks which are coming in advance and very difficult to distinguish. For an example: content sensitive, concurrency and aesthetics. Finally predicted risks,
depending on previous experiences and
corresponding features are: network and its problems, security, non prediction loading and continuing evolution to coping with new platforms. We will depend on SRE method [20] to describe risk management steps of analysis modeling for the previous example :
1. Identify: we must identify the risks which
have adversely affecting on modeling levels.
For content, we must identify who is the sensitive content, who can explore it, and what is the rules followed to reject or accept the paper. In addition to identify the
wanted classes accurately in
[image:4.595.324.488.311.403.2] [image:4.595.95.283.491.580.2]For navigation, we can release the following questions :
• Is there more than one link to
reach the wanted content?
(availability).
• are these links direct ?
(immediacy).
• Is access to content safely ?
By answering, we can define some risks that have affect on our system.
For presentation, we can ask:
• Have links the feature
self-explanation ?
• Is look and feel good for user ? (
aesthetic).
The lack of self-explanation in
presentation will effect and confuse the user. If system aesthetic doesn't reflect good feeling for user and the content will not appear in many formats suit what user needs, the system will be marked by the user with large weaknesses. Depending on we must, answering questions, and if discussed above we can identify the risks.
2. Analyzing : we will convert risks data into
information to measure the quality of risk management to make a decision about the risk . The details in the next section.
3. Plan : we will convert the extracting
information from the previous step into decision suit both present and future to increase chances of success to the fullest extent.
4. Track : this process aims to monitor the
risks situations and actions that are done to decrease it.
5. Control : its goal is responding to
triggering actions and adopting with new state.
5. MEASUREMENT OF RISK
MANAGEMENT QUALITY OF ANALYSIS MODELING
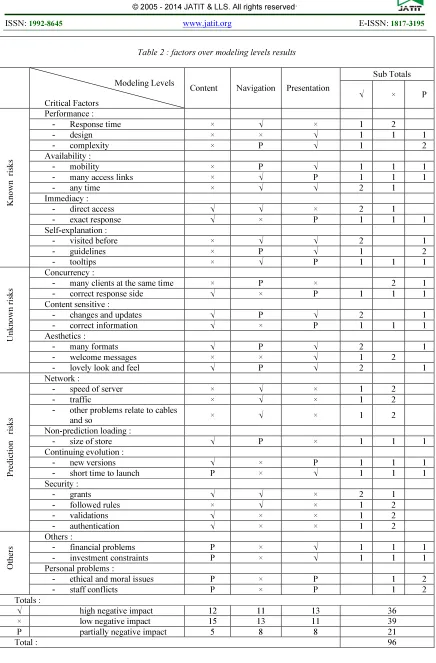
We will use the previous features; witch recognize web applications from other software; mentioned above in section 3 as a critical factors for measuring the quality. Some other factors will be added to cover some aspects I think it is important to discuss. Table 2 shows the results of measuring.
Table 1 includes three options for each critical factor, these are as the following :
Table 1 : options of measurement
Option Description
√ when the factor has high negative impact
and guide to failure.
× when the factor has low negative impact and don't guide to failure.
P When the factor has partially negative
impact on the success.
Table 2 : factors over modeling levels results
Modeling Levels
Critical Factors
Content Navigation Presentation
Sub Totals
√ × P
K
n
o
w
n
ri
sk
s
Performance :
- Response time × √ × 1 2
- design × × √ 1 1 1
- complexity × P √ 1 2
Availability :
- mobility × P √ 1 1 1
- many access links × √ P 1 1 1
- any time × √ √ 2 1
Immediacy :
- direct access √ √ × 2 1
- exact response √ × P 1 1 1
Self-explanation :
- visited before × √ √ 2 1
- guidelines × P √ 1 2
- tooltips × √ P 1 1 1
U
n
k
n
o
w
n
r
isk
s
Concurrency :
- many clients at the same time × P × 2 1
- correct response side √ × P 1 1 1
Content sensitive :
- changes and updates √ P √ 2 1
- correct information √ × P 1 1 1
Aesthetics :
- many formats √ P √ 2 1
- welcome messages × × √ 1 2
- lovely look and feel √ P √ 2 1
Pr
e
d
ic
ti
o
n
r
isk
s
Network :
- speed of server × √ × 1 2
- traffic × √ × 1 2
- other problems relate to cables
and so × √ × 1 2
Non-prediction loading :
- size of store √ P × 1 1 1
Continuing evolution :
- new versions √ × P 1 1 1
- short time to launch P × √ 1 1 1
Security :
- grants √ √ × 2 1
- followed rules × √ × 1 2
- validations √ × × 1 2
- authentication √ × × 1 2
O
th
e
rs
Others :
- financial problems P × √ 1 1 1
- investment constraints P × √ 1 1 1
Personal problems :
- ethical and moral issues P × P 1 2
- staff conflicts P × P 1 2
Totals :
√ high negative impact 12 11 13 36
× low negative impact 15 13 11 39
P partially negative impact 5 8 8 21
If we read table 2 horizontally, the numbers we get represent the score that each factor has over the whole three levels of modeling depending on the previous options. If we read table 2 vertically, the numbers we get represent the score that each level has over the whole critic factors depending on the previous options.
From the numbers that table 2 shows we can notice that the total number of critical factors that has high negative impact is 36 points from the total points which is 96 ( with percentage 37.5 % ). The ones which has low negative impact got 39 points ( with percentage 40 % ) whereas the factors which has partially negative impact has ( percentage 21 % ). As can be seen in table 2, the points are slightly different from one level to another. This means that the three levels are affected comparably and this is clear from the total points at the end of each level and this is because these three levels are associated to the same stage of web application life cycle . From the extracted percentages we can say; as a present decision; that we must focus on factors that have high negative impact more than the others, that is because more than one-third of the factors may guide to failure. As a future decision, it is better to focus on the factors that have low negative impact more than that have high negative impact because of the small percentage when comparing with the previous, so that decreasing it guide to
decrease the probability of failure
.
We must monitor all factors specially that have partially impact to avoid the probability to be high negative impact through adopting and response to its emergencies.
6. CONCLUSIONANDFUTUREWORK
In this paper, we showed that because of web applications privacy, this kind of engineering will be surrounded by many risks that can guide to failure. These risks are considered as challenges that can be seen in the field of web application development. It is illustrated the three levels ( content, navigation and presentation ) of analysis modeling of web application life cycle through an example of review system of scientific papers where we explored many diagrams suite each level. Then we applied steps of SRE method on it. Risks are classified into ( known, unknown and predicted risks ), mentioned challenges are considered as critic factors where it is arranged in a table, then data is converted into numerical information. Decisions are made to illustrate the impact of risk management on analysis modeling of web application.
We know that stages of web application life cycle are integrated and related to each other. We can expand risk management to cover all these stages, in addition we can study the impact of risk management on the interconnection among different stages of web application life cycle.
REFRENCES:
[1] Yogesh Deshpande, San Murugesan, Athula
Ginige, Steve Hansen, Martin Gaedke, Bebo
White and Daniel Schwabe, "WEB
ENGINEERING", Journal of Web Engineering,
Vol. 1, , No.1 (2002) 003-017, October 18,
2002.
[2] (2008) the software engineering website .
[online] . available :
http://openseminar.org/se/modules/21/index/sc reen.do
[3] Heinz-Peter Berg, "RISK MANAGEMENT:
PROCEDURES, METHODS AND
EXPERIENCES" , (Vol.1), June ,2010.
[4] Pradnya B. Rane, Suchita Patil, Pallavi
Kulkarni and B.B.Meshram, "Tying Web Project Estimation with Risk Managemen"t, IJCEM International Journal of Computational
Engineering & Management,Vol. 14, October
2011.
[5] A. Keshlaf and K. Hashim, "A Model and
Prototype Tool to Manage Software Risks", Proc. of First Asia–Pacific Conference on Quality Software, IEEE Computer Society, 2000, pp. 297–305.
[6] J. Moses, "Bayesian Probability Distributions
for Assessing Measurement of Subjective Software Attributes," Information and Software Technology, vol. 42, 15 May 2000, pp. 533-546.
[7] B. Boehm, J. Kwan, D. Port, A. Shah, and R.
Madachy,"Using the WinWin Spiral Model: A
Case Study," IEEE Computer, July 1998, pp. 33 - 44.
[8] Shailesh S. Limkar and Vaishali P. Bhosale, "
Software Project Risk Management"
Proceedings of the 5th National Conference,
March 2011.
[9] (2002) the R&D ware website. [online].
Available :
http://www.rdware.com/en/riskit-method
[10] (2009) the prorisk Professional Risk Analysis
website. [online]. Available :
http://www.ss.com.au/products/prorisk/prorisk. pdf
[11] (2014) the stack overflow website. [online].
http://stackoverflow.com/questions/2220981/co ncurrency-in-web-applications
[12] (2014) the Microsoft developer network
website. [online]. Available :
http://msdn.microsoft.com/enus/library/bb9243 56.aspx
[13] (2011) the help IQ website. [online]. Available
: http://www.helpiq.com/context-sensitive-help
[14] XU Dayou and SUN Haoxiang, " Features of
Web Media and Applications of It in Marketing ", School of Business Management, Guizhou College of Finance and Economics, P.R.China, 550004 .
[15]Alicia David and Peyton Glore, " The Impact
of Design and Aesthetics on Usability, Credibility, and Learning in an Online Environment" , Journal of Distance Learning Administration, Volume XIII, Number IV, Winter 2010.
[16]William G.J. Halfond, " Web Application
Modeling for Testing and Analysis" , College of Computing Georgia Institute of Technology, may 2010.
[17] Prepared by the National Center for O*NET
Development for USDOL, "Content Model", pp1-24.
[18]Olga De Troyer and Sven Casteleyn, "The
Conference Review System with WSDM" , WISE Research group, march 2001, pp 1-21.
[19]Eelco Herder," Modeling User Navigation",
Department of Computer Science, University of Twente, P.O. Box 217, 7500 AE, Enschede, The Netherlands.
[20]Ray C. Williams, George J. Pandelios and