NUMERICAL SIMULATION OF GRANULAR MOTION BY
PARTICLE FLOW CODE UNDER VIBRATION
1*
JIHUI LIANG, 2LILI XIN
1School of Automobile and Traffic, Shenyang LIGONG University, Shenyang 110159, China
2College of Engineering, Shenyang Agricultural University, Shenyang 110161, China
Email: [email protected]*, [email protected]
ABSTRACT
Internal friction and void ratio will change among granular particles under vibration, and the size of void ratio directly affects strength of granular media. To further study the effect of vibration parameters on granular mechanical properties, discrete element method is used to simulate particles motion in a vibrating rectangular case by PFC2D software and study the influence of vibration frequency and amplitude on void ratio of particles under cyclic loading. The results show that void ratio and axial stress of particles, which are with the same change trend, decrease with increasing vibration time, and the change process above is consistent with vibration compaction theory of internal friction decreasing doctrine.
Keywords: Vibration, Void ratio, PFC2D
1. INTRODUCTION
Discrete element method is commonly used to study granular motion at present, and granular system is considered as sufficient discrete elements, and each particle or bulk is as an element to simulate movement and distribution of granular media according to interaction among particles in whole process [1]. Compared with others, discrete element method has fully considered the separation, new contact among particles and elastic-plastic deformation of granular media, which are caused by relations of particles destroyed [2]. PFC2D software is a tool used to study characteristics of granular media and simulate large deformation problems of solid mechanics and flow problems of particles [3].
Due to the complexity of granular motion, most scholars at home and abroad are attracted to study granular motion and have achieved meaningful conclusions. T I Zohdi develops a flexible and robust solution strategy to resolve coupled systems comprised of large numbers of flowing particles embedded within a fluid. A model problem, consisting of particles which may undergo inelastic collisions in the presence of near-field forces, is considered [4], and the influence of the vibration amplitude on the final packing density is studied. The increase in the vibration amplitude leads to an increase in the final packing density [5]. S Remond presents a simulation study of confined periodic
mono-sized hard sphere systems under different vibration conditions and their influence on the final compaction [6-7].
In this paper, discrete element method is used to simulate particles motion in a vibrating rectangular case by PFC2D software and study the influence of vibration frequency and amplitude on void ratio of granular media under cyclic loading. Reasonable vibration parameters are obtained to improve compaction quality and work efficiency according to results. Section 2 discusses the numerical simulation process of movement and interaction of particles and introduces test process by PFC2D software. The numerical simulation results of particles are analyzed in Section 3. Section 4 summarizes and concludes the paper.
2. NUMERICAL SIMULATION PROCESS AND SUMMARY
2.1 Numerical Simulation Process
the rectangular case with 190, 280 mm in side length, and left and right walls are constrained, and sinusoidal pressure is applied on bottom wall to simulate shaking table. The relation between void ratio and axial stress is obtained in different frequency and amplitude [8].
2.2 Summary of Test
Contact model is the core of discrete element method, and spring-damper and sliding contact model are used in this paper.
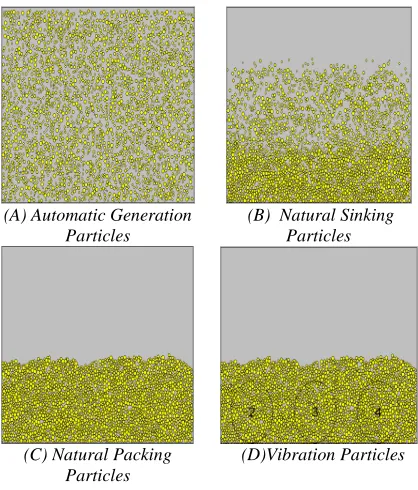
Particles with specified quantity and particle size are produced based on gaussian distribution in some specified region of rectangular case, and the minimum radius of particle is 0.25 mm, and the maximum radius of particle is 0.85 mm. Particles will compact on the bottom edge of rectangular case under gravity action, and sine vibration is applied on the bottom edge after particles reach stable compacting state. The test process is shown as Figure1.
(A) Automatic Generation Particles
(B) Natural Sinking Particles
(C) Natural Packing Particles
[image:2.612.340.506.146.285.2](D)Vibration Particles
Figure 1. Numerical Simulation Tests
3. NUMERICAL RESULTS
3.1. The Change Law of Void Ratio and Axial Stress under Vibration Load
Three measuring circles are selected in the coordinate range of natural packing particles, as Figure 1(d). The average values of void ratio and axial stress in measuring circles are used as approximate value of void ratio and axial stress after
numerical calculation. The results, as Figure 2 and Figure 3, show that void ratio and axial stress of particles present nonlinear variation under sinusoidal periodic load.
t
Figure 2. The Curve Between Void Ratio And Time
From the Figure 2 and Figure 3, void ratio and axial stress of particles show a decreasing tendency with increasing vibration time. Void ratio and axial stress reach a less value at initial stage of vibration because the bottom wall upward moves, and an instantaneous impact force is applied on natural packing particles which are subject to instantaneous extrusion, and void ratio and axial stress decrease rapidly, and the stage of particles changes from natural packing to vibration compacting. At stable stage of vibration, the change process of void ratio repeats from low to high and then from high to low, and decreasing amplitude is higher than rising amplitude, and the values of axial stress change repeatedly from zero to peak value and from peak value to zero. Particles repeat jump and fallback movement under vibration. Particles separate each other while jump, and forces among particles decrease gradually to zero, and pores among particles decrease because of gravity and inertia force, and axial stress increases while fallback. The change of void ratio is less, and axial stress is less, and all of them are tended to be stable at later stage of vibration, and particles reach the compacting state.
t
y
σ
[image:2.612.94.303.350.595.2] [image:2.612.341.501.585.703.2]Change process between void ratio and axial stress are analyzed in different amplitude, vibration frequency and friction coefficient.
3.2. The Influence of Vibration Parameters on Void Ratio
3.2.1 The effects of frequency on void ratio
When amplitude is 0.001 m and vibration frequency is 20Hz, 25Hz, 30Hz, 40Hz and 50Hz respectively, the relation curves between void ratio of particles and vibration time and the relation curves between average void ratio and vibration frequency are separately shown as Figure 4 and Figure 5.
From the Figure 4, the variation range of void ratio is 0.210~0.255, and the higher the frequency is, the higher the wave frequency of void ratio with time in the same amplitude, and change trend of curves is similar and decline with increasing time. From the Figure 5, average void ratio decreases with increasing frequency, and the value of average void ratio changes little when frequency is 20~25 Hz, and the value decreases rapidly when frequency is 25~30 Hz, and the value changes little when frequency is 30~50 Hz. The phenomenon shows that sandy soil compactness increase rapidly in the same amplitude when frequency is 25~30 Hz and the conclusion is consistent with test.
3.2.2 The influence of amplitude on void ratio
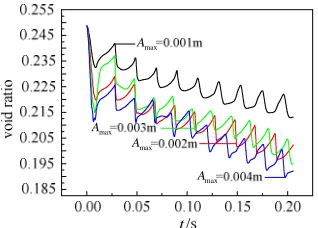
Curves between void ratio and time and curves between average void ratio and frequency are shown as Figure 6 and Figure 7 when frequency is 50 Hz and amplitude is 0.001 m, 0.002 m, 0.003 m and 0.004 m respectively.
max A
max A
max A
[image:3.612.333.504.207.334.2]max A
Figure 6. The Curve Between Void Ratio And Time
From the Figure 6, the variation range of void ratio is 0.185~0.255, and variation of void ratio is similar in the same vibration frequency and different amplitude, but extent of void ratio is
different. The larger the amplitude is,the larger the
extent of void ratio and the general extent of void ratio at initial stage of vibration. From the Figure 7, the value of average void ratio decreases and changes larger with increasing amplitude, except that amplitude is 0.002~0.003 m. The phenomenon shows that sandy soil compactness increases with increasing amplitude, and the conclusion is consistent with test.
max
A
Figure 7. The Curve Between Average Void Ratio And Amplitude
3.2.3 The influence of friction coefficient on void ratio
Curves between void ratio and time and curves between average void ratio and friction coefficient are shown as Figure 8 and Figure 9 when frequency is 50 Hz and amplitude is 0.001 m and friction coefficient is 0.3489~0.5.
µ µ µ
µ µ
µ µ
µ
Figure 8. Curve Between Void Ratio And Time
[image:3.612.335.508.438.710.2]µ
[image:3.612.121.280.539.653.2]From the Figure 8, the variation range of void ratio is 0.2~0.25, and change of void ratio is similar under the same working condition and different friction coefficient, but extent of void ratio is different. The smaller the friction coefficient is,
the larger the reduced extent of void ratio at initial stage of vibration and the larger the general decline extent of void ratio. From the Figure 9, average void ratio increases and changes large and increases rapidly with increasing friction coefficient, except friction coefficient is 0.4~0.42 and 0.45~0.47. The phenomenon shows that the smaller the friction coefficient is, the smaller the void ratio, and the result is consistent with test.
3.3 Relations of Vibration Parameters and Axial Stress, Void Ratio
3.3.1 Relations of vibration frequency and axial stress, void ratio
Curves between peak value of axial stress and void ratio and curves between average void ratio and frequency are shown as Figure 10 and Figure 11 when amplitude is 0.001 m and frequency is 20 Hz, 25 Hz, 30 Hz, 40 Hz and 50 Hz respectively.
m
ax
y
σ
f f
f f f
Figure 10. Curves Between Peak Value Of Axial Stress And Void Ratio
y
σ
f
Figure 11. The Curve Between Average Void Ratio And Frequency
From the Figure 10 and the Figure 11, the maximum axial stress decreases with increasing void ratio. The smaller the frequency is, the larger the maximum axial stress in the same amplitude, and extent of axial stress changes little while
frequency is 40 Hz and 50Hz respectively, and axial stress decreases rapidly while frequency is 20 Hz, 25 Hz, and 30 Hz. The result shows that the higher the frequency is, the smaller the void ratio, and the smaller the clearance of particles, the smaller the axial stress and shear strength in the same amplitude.
3.3.2 Relations of amplitude and axial stress, void ratio
Curves between peak value of axial stress and void ratio and curves between average void ratio and amplitude are shown as Figure 12 and Figure 13 when frequency is 50 Hz, and amplitude is 0.001 m, 0.002 m, 0.003 m, and 0.004 m respectively.
From the Figure 2 and Figure 13, axial stress decreases with increasing void ratio. The higher the amplitude is, the smaller the axial stress value in
the same vibration frequency. Axial stress changes little while amplitude is 0.004 m. Axial stress changes larger and decreases rapidly with decreasing amplitude. The phenomenon shows that the larger the amplitude is, the smaller the void ratio, axial stress and shear strength of particles in the same vibration frequency.
max A
max A
max A
max A
m
a
x
y
[image:4.612.317.517.336.651.2]σ
Figure 12. Curves Between Peak Value Of Axial Stress And Void Ratio
y
σ
max
A
Figure 13. Relation Between Average Void Ratio And Amplitude
3.3.3 Relations of friction coefficient and axial stress, void ratio
frequency is 50 Hz and friction coefficientare is 0.3489~0.5.
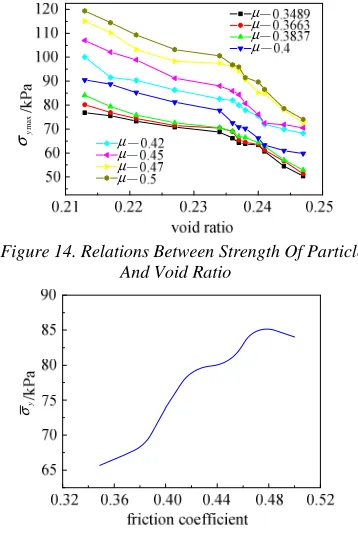
From the Figure 14 and Figure 15, axial stress decreases with increasing void ratio. The smaller the friction coefficient is,the smaller the axial stress in
the same amplitude and vibration frequency. Axial stress changes little while friction coefficient is 0.3489~0.4, and axial stress changes larger and decreases rapidly while friction coefficient is 0.42~0.5. The result shows that the smaller the friction coefficient is, the smaller the axial stress, and the smaller the shear strength is, the better compaction effect in the same amplitude and frequency.
µ µ µ
µ µ µ µ
µ
m
ax
y
σ
Figure 14. Relations Between Strength Of Particles And Void Ratio
y
[image:5.612.111.290.270.538.2]σ
Figure 15. Relation Between Average Axial Stress And Friction Coefficient
4. CONCLUSION
Granular motion is numerically simulated based on PFC2D software under cyclic loading, and variation of void ratio and axial stress of particles is analyzed to study the influence of vibration parameters on compacting state of particles and reflect intuitively application of vibration friction mechanism.
Void ratio and axial stress of particles show a decreasing tendency with increasing vibrating time. Void ratio and axial stress are smaller when vibration frequency is 40~50 Hz in the same
amplitude or amplitude increases in the same vibration frequency or friction coefficient decreases in the same vibration frequency and amplitude. The results show that the change trend of void ratio is similar to that of axial stress, namely increasing or decreasing simultaneously, under vibration load. Axial stress and shear strength is also smaller when void ratiois smaller, and the smaller the void ratio is, the better the compaction effect. The changing process is consistent with theory of vibrating compaction in internal friction decreasing doctrine, and validity of numerical simulation is proved.
ACKNOWLEDGMENT
This paper is supported by the National Natural Science Foundation of China (51105259).
REFERENCES
[1] Aixiang WU, Yezhi SUN, Jianhua. Wave propagation and mechanism of aided flow by vibration in granular flow field. The Chinese Journal of Nonferrous Metals. 2001; 11: 661-665.
[2] Rendong HUANG, Xingguo DAI. An experimental study on propagation properties of vibrating wave in loose ore and rock. Mining and Metallurgical Engineering. 1998; 18: 10-13. [3] Jinshan SUN, Jianshi ZHU, Xiangrui JIA. An
analysis of compaction wave in granular materlal. Chinese Journal of Theoretical and Applied Mechanics. 1999; 31: 423-433.
[4] T I Zohdi. Computation of strongly coupled multifield in terction in particle-fluid systems. Computer methods in applied mechanics and engineering. 2007; 196: 3927-3950.
[5] S Remond. Compaction of confined mono-sized spherical particle systems under symmetric vibration: a suspension model. Physica A. 2004; 337: 411-427.
[6] S Remond, J L Gallias. Simulation of periodic mono-sized hard sphere systems under different vibration conditions and resulting compaction. Physica A. 2006; 369: 545-561.
[7] S Remond. Simulation of the compaction of confined mono-sized spherical particles systems under symmetric vibration. Physica A. 2003; 329: 127-146.
[8] Lili XIN. Study on the Dynamic Characteristics of Vibration Friction and its Applications. Doctoral Dissertation of Northeastern

![Assessment of Physiological Health Status in Relations to Different Anthropometric and Cardio respiratory Measures of Head Supported Load Carrying Male Porters of Sikkim, India [Article Retracted]](data:image/gif;base64,R0lGODlhAQABAIAAAP///wAAACH5BAEAAAAALAAAAAABAAEAAAICRAEAOw==)