International Journal of Emerging Technology and Advanced Engineering
Website: www.ijetae.com (ISSN 2250-2459, ISO 9001:2008 Certified Journal, Volume 7, Issue 6, June 2017)
288
Variable Sampling for Resubmitted lots Predicted by Gibbs
Approach
Kanwar Partap Singh
1, Dr. Suman Kant
21PEC University of Technology Chandigarh, (M-Tech) (Total Quality Management) Production & Industrial Engineering 2Assistant Professor PEC University of Technology Chandigarh & Production & Industrial Engineering
Abstract— In this paper, a factors examining investigation
get ready for resubmitted part in view of the procedure ability list Cpk is created for ordinarily dispersed things with obscure mean and difference. The three arrangement parameters, test estimate n, basic acknowledgment esteem ka and the quantity of resubmissions m, are resolved at the same time by limiting normal specimen number (ASN) with two conditions indicated by the maker and the shopper. The benefits of the proposed resubmitted testing arrangement over the factors single inspecting arrangement are likewise talked about. Tables of plan parameters for chose restricting quality level (LQL), maker's a-hazard and purchaser's b-chance are given and examined the assistance of an application illustration. Acknowledgment examining, characterized as the examination and grouping of an example of units chosen aimlessly from a bigger bunch or parcel and a definitive choice about attitude of the part, for the most part happens at two focuses, i.e. approaching crude materials or parts and last generation. Numerous enterprises on the planet have their quality affirmation divisions to enhance the nature of the items and apply different acknowledgment testing gets ready for the examination of the items. For instance, to set up a bundle of cigarette the quality supervisor will review the speciation of length, width, shading and picking of the items.
Keywords— Statistical process control, Acceptance sampling, Descriptive statistics, Statistical Quality Control, Stable process
I. INTRODUCTION
Statistical Quality Control: Statistical quality control (SQC) is the term used to portray the arrangement of statistical instruments utilized by quality experts .Statistical quality control (SQC) is the utilization of statistical approach in quality control. Insights are worried with drawing surmising from arbitrary specimens. Thus SQC incorporates each one of those operational systems in quality control which are concerned with sampling and with assessing tests keeping in mind the end goal to take satisfactory choices on material, products, manufacturing processes, organization and so forth.
The benefit and-misfortune articulation of a modern organization is influenced generously by the degree to which its products and administrations can fulfill clients' needs, especially over the long haul. Statistical quality control can be isolated into three general classes:
1. Descriptive statistics are utilized to depict quality attributes and connections. Included are statistics, for example, the mean, standard deviation, the range, furthermore, a measure of the dispersion of information.
2. Statistical process control (SPC) includes reviewing an irregular example of the yield from a procedure and choosing whether the procedure is delivering items with qualities that fall inside a foreordained range. SPC answers the question of whether the procedure is working appropriately or not.
3. Acceptance sampling is the procedure of haphazardly reviewing an example of merchandise also, choosing whether to acknowledge the whole part in view of the outcomes. Acceptance sampling decides if a bunch of merchandise ought to be acknowledged or dismisses.
International Journal of Emerging Technology and Advanced Engineering
Website: www.ijetae.com (ISSN 2250-2459, ISO 9001:2008 Certified Journal, Volume 7, Issue 6, June 2017)
289
In any case, statistical process control (SPC) apparatuses are utilized most every now and again on the grounds that they recognize quality issues amid the generation procedure. Therefore, we will commit the vast majority of the section to this class of instruments. The quality control apparatuses we will be finding out about don't as it were measure the estimation of a quality trademark. They likewise enable us to distinguish a change or variety in some quality normal for the item or process. We will initially observe what sorts of variety we can watch when measuring quality. At that point we will be capable to distinguish particular devices utilized for measuring this variety. Variety in the creation procedure prompts quality imperfections and absence of item consistency. The Intel Corporation, the world's biggest and most gainful producer of chip, comprehends this. In this way, Intel has actualized a program it calls "copy-exactly" by any stretch of the imagination its assembling offices. The thought is that paying little respect to whether the chips are made in Arizona, New Mexico, Ireland, or any of its other plants; they are made in exactly the same way. This implies utilizing a similar hardware, the same correct materials, and laborers playing out similar assignments in precisely the same. The level of detail to which the "copy-exactly" idea goes is meticulous. For instance, when a chip making machine was observed to be a couple of feet longer at one office than another, Intel made them coordinate. At the point when water quality was observed to be diverse at one office, Intel initiated a purging framework to take out any distinctions [1].
Statistical Process Control: Statistical process control (SPC) is a technique for quality control in which statistical strategies are utilized. SPC is connected keeping in mind the end goal to screen and control a process. Monitoring and controlling the process guarantees that it works at its maximum capacity. At its maximum capacity, the process can make however much conforming product as could reasonably be expected with a base (if not an end) of waste (revamp or scrap). SPC can be connected to any process where the "conforming product" (product meeting specifications) yield can be measured. Enter instruments utilized as a part of SPC incorporate control diagrams; an emphasis on constant change; and the plan of examinations. A case of a process where SPC is connected is producing lines.
Applications of Statistical Process Control:
The utilization of SPC includes three primary periods of action:
1. Understanding the process and as far as possible. 2. Disposing of assignable (special) wellsprings of
variety, so that the process is stable.
3. Observing the continuous production process, helped by the utilization of control charts, to recognize huge changes of mean or variety.
Control charts: The information from estimations of variations at focuses on the process delineate checked utilizing control charts. Control charts endeavor to separate "assignable" ("special") wellsprings of variety from "common" sources. "Common" sources, since they are a normal piece of the process, are of significantly less worry to the producer than "assignable" sources. Utilizing control charts is a constant movement, continuous after some time.
Stable process: At the point when the process does not trigger any of the control outline "detection rules" for the control graph, it is said to be "stable". A process capacity investigation might be performed on a stable process to anticipate the capacity of the process to create "conforming product" later on.
Excessive variations: At the point when the process triggers any of the control outline "detection rules", (or then again, the process ability is low), different exercises might be performed to recognize the wellspring of the excessive variety. The apparatuses utilized as a part of these additional exercises include: Ishikawa diagram, planned trials, and Pareto charts. Outlined tests are methods for equitably measuring the relative significance (quality) of wellsprings of variety [2].
II. LITERATURE REVIEW
In [3] with unknown mean and variance for normally distributed items variables sampling inspection plan is developed that is based on the capability index Cpk. By
minimizing the average sample number (ASN) with two conditions the three plan parameters, number of resubmissions m, sample size n and critical acceptance value ka are determined simultaneously. Over the variables
International Journal of Emerging Technology and Advanced Engineering
Website: www.ijetae.com (ISSN 2250-2459, ISO 9001:2008 Certified Journal, Volume 7, Issue 6, June 2017)
290
The conditions for plan parameters, the required specimen estimate and the comparing basic esteem, are inferred in view of the correct sampling distribution rather than a guess approach subsequently the choices made are more exact and solid. Additionally, the productivity of the proposed factors resubmitted sampling arrangement is assessed and contrasted and the current factors single sampling arrangement. For illustrative reason, a case is introduced to illustrate the utilization of the inferred comes about for settling on a choice on item acknowledgment assurance. In [5] in this paper, build up an example measure model and refresh the acknowledgment/dismissal criteria of the past sampling plan to the new, more reasonable model with obscure change. What's more build up the operational characteristic curve (OCC). The sampling plan is contrasted and the normally utilized plan MIL-STD-414 (Sampling Procedures and Tables for Inspection by Variables for Percent Defective. Office of Defense: Washington, DC, 1957) and it is discovered (through reenactments) that the Cpk sampling plan has a little likelihood of tolerating faulty parcels and the required example estimate required is observed to be littler for vast parts. Also, examination is made between the two OCCs and it is discovered that the OCC produced for the Cpk sampling plan appears a higher accuracy (in a request of extent) in arranging parcels accurately. In [6] goal of this exploration is to build up a multistage sampling plan, in light of Cpk and changed in accordance with
acknowledgment sampling for factors, taken as an arbitrary specimen from a considerable measure of size N (given) having (roughly) a typical conveyance with a known difference. The sampling plan was contrasted with MIL-STD-414 (1957) and it was discovered (through recreations) that the Cpk sampling plan has a little
likelihood to reject great parts (0–0.03% versus 0–0.27% for the MIL-STD-414) what's more, a little likelihood to acknowledge inadequate parcels (0–0.01% versus 5.2– 8.37% for the MIL-STD-414). Furthermore, the required example size is littler for forms with high capacity file. In [7] present an effective item acknowledgment technique on the premise of the speculation CT pk list, to manage part
sentencing issue with low portion of defectives. It organize the required example estimate n and the comparing basic acknowledgment esteem c0 for different a-hazard, b-chance, and the levels of the part division of defectives that relate to acknowledgment what's more, dismissing quality levels. Specialists can utilize the proposed technique to settle on dependable choices in item acknowledgment.
In[8] In this paper, factors dull gathering sampling plans are created in view of the procedure ability file Cpk when the quality trademark takes after a typical conveyance with obscure mean and change. The sampling plan parameters, for example, the specimen estimate and the acknowledgment steady are resolved to limit the normal specimen number. Symmetric and asymmetric cases, in percent defectives because of two detail breaking points, are managed for indicated mixes of adequate quality level and restricting quality level. Tables are given and illustrations are given to utilize proposed plans in practice. In [9] the process capability indices (PCI) are helpful administration instruments, especially in the creation business, which give regular quantitative measures on the creation quality and capability. So sampling arranges in view of PCI will have wide applications in the generation ventures. This article proposes a factors brisk exchanging system in light of the PCI Cpk, where the quality normal for
intrigue takes after the ordinary appropriation with obscure mean and fluctuation. The proposed sampling system will be viable when testing is exorbitant and dangerous. The benefits of this system are too talked about. To decide the optimal parameters, tables are likewise built. The issue is detailed as a nonlinear programming where the target capacity to be limited is the normal example number and the limitations are connected to part acknowledgment probabilities at satisfactory quality level and restricting quality level under the working trademark bend. In[10]the consequences of a reenactment investigation of the conduct of three non-parametric bootstrap certainty cutoff points of the PCI Cpmk have been explored. This review demonstrates
that 95% and 90% SB limits perform altogether superior to anything the cutoff points in light of PB and BCPB strategies paying little heed to the circulation. As far as possible appear to be significantly more powerful than alternate points of confinement. The reenactment contemplate shows that the most noticeably bad of the three bootstrap strategies is the PB, which reliably had the most reduced extent of scope when the handle has an ordinary or chi-squared dispersion. In [11] this review utilized an fitting list CNpmk to assess non-regularly and typically
appropriated forms. Nonetheless, the correct likelihood circulation of CNpmk is excessively muddled to be
International Journal of Emerging Technology and Advanced Engineering
Website: www.ijetae.com (ISSN 2250-2459, ISO 9001:2008 Certified Journal, Volume 7, Issue 6, June 2017)
291
III. PROPOSED METHODOLOGY
Step1: Set the parameters
Step2: Initialize CPK , CPm , and CPmK randomly.
Step3: In this step input the dataset.
Step4: When dataset is input then Gibs sampling is applied.
Step5: When Gibbs sampling is applied, in this step sampling parameter is initialized.
Step6: After initializing the sampling parameter the swarm is initialized.
Step7: When swarms are initialized the fitness function is updated.
Step8: In this step, parameter is checked.
Step9: In this step a condition is applied, checked parameter is optimized.
Step10: If parameter optimized then parameter is analyzed otherwise go to step5.
[image:4.612.46.272.135.620.2]IV. RESULTS
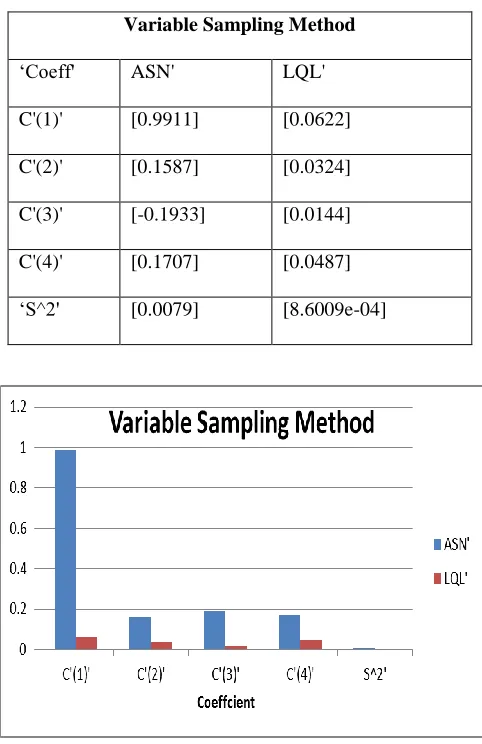
Table 4.1
Variable Sampling Method for different Coefficient:
Variable Sampling Method
‘Coeff' ASN' LQL'
C'(1)' [0.9911] [0.0622]
C'(2)' [0.1587] [0.0324]
C'(3)' [-0.1933] [0.0144]
C'(4)' [0.1707] [0.0487]
‘S^2' [0.0079] [8.6009e-04]
Figure 4.1 Comparison graph of different coefficient using Variable sampling method:
Set the parameter
Random initialization C
PK, C
Pm, and C
PmKInput the dataset
Gibbs sampling
Initialize sampling parameter
Initialize swarm
Update fitness function
Analyze parameter
Check parameter
[image:4.612.324.565.308.680.2]International Journal of Emerging Technology and Advanced Engineering
Website: www.ijetae.com (ISSN 2250-2459, ISO 9001:2008 Certified Journal, Volume 7, Issue 6, June 2017)
292
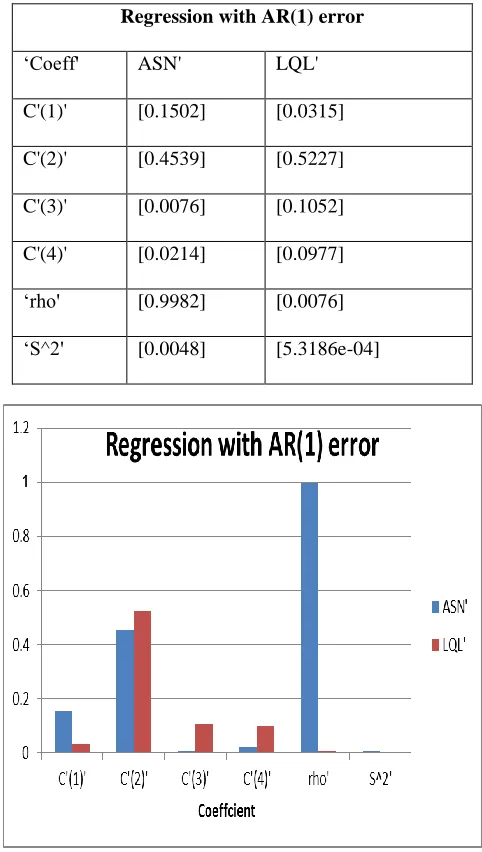
Table 4.2Regression with AR (1) error for different coefficients:
Regression with AR(1) error
‘Coeff' ASN' LQL'
C'(1)' [0.1502] [0.0315]
C'(2)' [0.4539] [0.5227]
C'(3)' [0.0076] [0.1052]
C'(4)' [0.0214] [0.0977]
‘rho' [0.9982] [0.0076]
[image:5.612.47.288.157.583.2]‘S^2' [0.0048] [5.3186e-04]
Figure 4.2 Graph of regression with AR (1) error in different coefficient
Table 4.3
Gibbs Sampling for different coefficient:
Gibbs Sampling
‘Coeff' ASN' LQL'
C'(1)' [0.9923] [0.0624]
C'(2)' [0.1582] [0.0325]
C'(3)' [-0.1938] [0.0144]
C'(4)' [0.1701] [0.0488]
‘S^2' [0.0079] [8.7032e-04]
‘df' [17.0802] [2.6528]
[image:5.612.321.583.157.606.2]International Journal of Emerging Technology and Advanced Engineering
Website: www.ijetae.com (ISSN 2250-2459, ISO 9001:2008 Certified Journal, Volume 7, Issue 6, June 2017)
[image:6.612.48.283.157.528.2]293
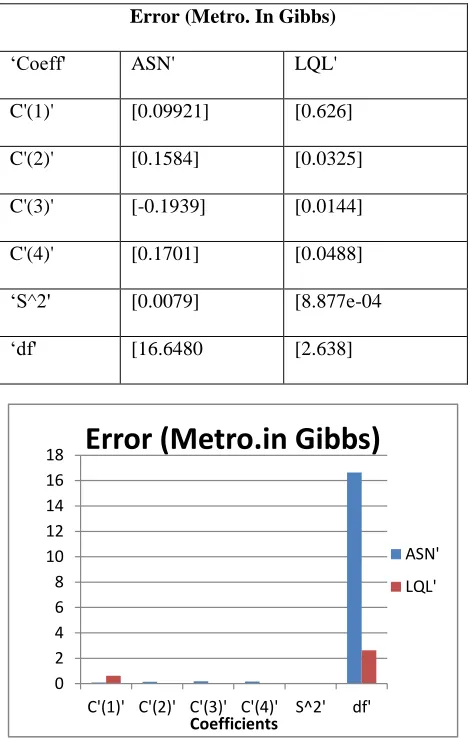
Table 4.4Error(Metro. In Gibbs) for different coefficients
Error (Metro. In Gibbs)
‘Coeff' ASN' LQL'
C'(1)' [0.09921] [0.626]
C'(2)' [0.1584] [0.0325]
C'(3)' [-0.1939] [0.0144]
C'(4)' [0.1701] [0.0488]
‘S^2' [0.0079] [8.877e-04
‘df' [16.6480 [2.638]
0 2 4 6 8 10 12 14 16 18
C'(1)' C'(2)' C'(3)' C'(4)' S^2' df'
Coefficients
Error (Metro.in Gibbs)
ASN'
LQL'
Figure 4.4 Graph of Error (Metro.in Gibbs) in different coefficient:
V. CONCLUSION
In this paper, the main work is on capability index improvement because the capability index shows the improvement of quality factor by sampling method.
So, Convergence of Cpk is a critical factor for quality
sampling. In the above given problem, adapted the prediction base variable sampling which uses swarm intelligence for selected the sampling slot that depends on previous LQL factor. If we converge the LQL factor then effective feedback will be obtained for the quality improvement. The nutshell of this method is to use previous information for reducing the time and improving the convergence.
REFERNCES
[1] Montgomery, Douglas C. Statistical quality control. Vol. 7. New York: Wiley, 2009.
[2] https://en.wikipedia.org/wiki/Acceptance_sampling
[3] Aslam, Muhammad, et al. "Variable sampling inspection for resubmitted lots based on process capability index Cpk for normally distributed items." Applied Mathematical Modelling 37.3 (2013): 667-675.
[4] Wu, Chien-Wei, Muhammad Aslam, and Chi-Hyuck Jun. "Variables sampling inspection scheme for resubmitted lots based on the process capability index C pk." European Journal of Operational Research 217.3 (2012): 560-566.
[5] [5] Negrin, Itay, Yisrael Parmet, and Edna Schechtman. "Developing a sampling plan based on Cpk—unknown variance." Quality and Reliability Engineering International 27.1 (2011): 3-14.
[6] Itay, Negrin, Parmet Yisrael, and Schechtman Edna. "Developing a sampling plan based on Cpk." Quality Engineering 21.3 (2009): 306-318.
[7] Pearn, Wen Lea, and C. H. Wu. "A close form solution for the product acceptance determination based on the popular index Cpk." Quality and Reliability Engineering International 29.5 (2013): 719-723.
[8] Aslam, Muhammad, et al. "Developing a variables repetitive group sampling plan based on process capability index C pk with unknown mean and variance." Journal of Statistical Computation and Simulation 83.8 (2013): 1507-1517.
[9] Balamurali, S., and M. Usha. "Optimal designing of variables quick switching system based on the process capability index C pk." Journal of Industrial and Production Engineering 31.2 (2014): 85-94.
[10] Balamurali, S. "Bootstrap confidence limits for the process capability index Cpmk." International Journal of Quality Engineering and Technology 3.1 (2012): 79-90.