International Journal of Emerging Technology and Advanced Engineering
Website: www.ijetae.com (ISSN 2250-2459,ISO 9001:2008 Certified Journal, Volume 5, Issue 10, October 2015)
293
Simple Formula for Evaluating Variable Stiffness of
Wind-Turbine Tower with Consideration of Flange - Joint
Separation
Le Anh Tuan
11Department of Civil Engineering – Danang University of Science and Technology – University of Danang, 54 Nguyen Luong
Bang Street, Danang city, Vietnam
Abstract— Development of clean renewable energies is necessary due to the global warming. Among them, because the development of wind power has been noticed, the number of wind turbines has been increasing. Since characteristic weather conditions and terrain conditions in Japan cause great damage to wind turbines, design guidelines (Japan Society of Civil Engineers 2007, 2010)[1] were published. In the
GL Wind 2003 (Europe), the maximum wind speed verifying the fatigue strength of high-strength bolts of wind turbines is set to 0.7 time of the design wind speed and the frequency of appearance of high wind speed is extremely low. Fatigue damages due to high wind speed can be ignored. On the other hand, the frequency of appearance of high wind speed in Japan is much higher. It is very important to understand the responses of wind turbines and the fatigue behaviors throughout the operation periods. The loading conditions of tower's flange - joints during high wind speed have not been clarified yet. So it is necessary to evaluate the fatigue strength in a strong wind condition up to the design wind speed and the response of wind turbine tower with the consideration of joint separation for establishing the design methods. In this study, we evaluate it in two steps. Firstly, a model of a tower that uses high-strength bolts at flange joints is created and FEM analyses are performed. Then, stiffness of the flange joint is determined in order to model variable stiffness of the flange joints with considering the whole wind turbine tower.
Keywords—wind-turbine tower, flange - joint, bolt, separation, stiffness.
I. INTRODUCTION
It is necessary to determine the axial force in the bolt rather than tensile force acting on the bolt when performing the evaluation of fatigue damage of the bolt. Because when evaluating cumulative fatigue damage, fatigue limit curve has been used in Schmidt - Neuper diagram [2] (Figure.1),
not the external forces of the bolts, axial forces actually occur inside of the bolts are necessary to be determined (Guide Line Wind 2003)[6]. As Schmidt - Neuper’s
evaluation formula (S-N formula)[2], we can calculate the
axial force of one bolt during operation period.
From the FEM analysis result, we can verify and compare between calculated results using the formula and analytical results from which to draw conclusions about the reliability of the results (Figure.2).
T
p=
{
T
v+ pT
sT
s≤ T
sIT
v+ pT
sI+ (λT
sII− T
v− pT
sI)
Ts−TsI
TsII−TsI
T
sI< T
s< T
sIIλT
sT
sII< T
s(1)
TsI= Tv×
(e − 0.5g)
e + g (2)
TsII=
Tv
λ × q (3) ;
Tv= N0= 0.75 × σy× Ae(4)
q = 1 − p (5)
p = Cb
Cb+ Cc
(6)
λ= (1 + g
0.7e) (7)
𝐶𝑓=
𝐸
2𝑡𝐹
{𝜋
4+
𝜋
8𝑑𝑤(𝐷𝐴− 𝑑𝑤) [.√
2𝑡𝐹∙ 𝑑𝑤
𝐷𝐴2 3
+ 1/
2
− 1]} (8)
𝐶𝑤=
𝜋 ∙ 𝐸 ∙ (𝑑𝑤𝑜− 𝑑𝑤𝑖)2
4𝑡𝑤
International Journal of Emerging Technology and Advanced Engineering
Website: www.ijetae.com (ISSN 2250-2459,ISO 9001:2008 Certified Journal, Volume 5, Issue 10, October 2015)
294
Here:
Tp : Axial force of bolt ;
Ts : Tensile force acting on the tubular body at one
respective bolt;
N0 : Design bolt tension;
Tv : Initial tension of bolt;
e : Distance between the end of flange bolt and center of bolt;
g : Distance between center of plate of tubular body and center of bolt ;
Cb : Tensile spring constant of bolt;
Cc : Compressive spring constant of flange;
p : The ratio of forces inside and outside ; : Compensated leverage ratio;
σy : Yield strength of bolt;
Ae : Effective cross-sectional area of screw;
𝐶𝑓 : Compressive spring constant of flange
𝐶𝑤 : Compressive spring constant of washer
ds : Shaft diameter of bolt
dw : Load bearing surface diameter
dh : Diameter of the bolt hole
𝑑𝑤𝑜 : Outside diameter of washer
𝑑𝑤𝑖 : Inside diameter of washer
tF : Width of flange
tw : Width of washer
E : Young modulus of steel DA : Bolt pitch
This calculation formula from (1) to (9) is suitable for a cylindrical tower, wind turbine and chimney with L type flange joint without an inner rib.
Collapse mechanism 1: Non-deformation
Collapse mechanism 2: Tensile force in bolt exceed the allowable tensile force by the lever reaction force (Pr). Plastic hinge occurs at local of tubular body
Collapse mechanism 3: Plastic hinge occurs at local of tubular body and the hole’s portion of bolt. The bolt stress exceeded the Yield point stress. With the development of enlarged wind turbine, people began using the flange joints that exceed the scope of the guideline formula with FEM analysis in basically. Therefore, they perform to revise the strength evaluation formula. With this concept Petersen’s evaluation [3], (GL for Design of Wind turbine Support
[image:2.612.330.545.154.690.2]Structures and Foundations, p.267, 268) formula has been used widely. In this formula Petersen has considered that allowable yield strength of flange have been divided in three collapse mechanism. (Figure.3)
Figure 1. Schmidt –Neuper diagram[2]
[image:2.612.372.509.277.536.2]Figure 2. Detailed diagram of L-flange joint
International Journal of Emerging Technology and Advanced Engineering
Website: www.ijetae.com (ISSN 2250-2459,ISO 9001:2008 Certified Journal, Volume 5, Issue 10, October 2015)
295
The failure at the ultimate limit state can either appear by exceeding the resistance in the bolt, in the flange or both at the same time, which are called failure modes 1 – 3 by Petersen[3], see Figure 3. Seidel [7][8] then differentiates
[image:3.612.319.568.153.652.2]between failure in the flange at the axis of the bolt or below the washer and called these failure modes 4 and 5 instead of 3. As Figure 4 shows, the relationship between the forces in the bolt and the applied tension in the tower shells is nonlinear and can be divided into four ranges.
Figure 4. Nonlinear relationships between bolt force and applied load in the shell of tubular towers with flange connections
Range 1:Approx, linear curve, stresses between flanges are reduced while contact zone is closed. Range 2: Successive opening of flanges. Range 3: Open connection with slope depending on loads geometry. Range 4: Plastification of bolts and/or flange until failure of the connections. The stresses in the bolt depend nonlinearly on the tension force as the connection has pre-loaded bolts. A typical graph showing the nonlinear correlation of external load and tension force in the bolt shown in Figure 4. The behavior is similar for the bending moment in the bolt. The complex nonlinear behavior of this eccentrically loaded connection and high dynamic loads of wind turbines with more then109 load cycles in 20 years demand for safe and economic design methods. Experimental investigations on flange segments in the laboratory and in operating wind turbines have been performed to calibrate the results of simplified calculation models against experimental values. Additionally, a 3D finite element model has been used to extend the range of investigated parameters.
II. METHODOLOGY
In this study we perform to create model the L-flange joints with high- strength bolts and analysis in three steps (Figure.5)
2.1 Step0: (Figure 5) Firstly, we examine the work of one bolt with consideration of L flange - joint separation. As a proposed model of Herbert Schmidt, using the FEM to analysis and collecting the data regarding the types of bolted flange – joint, compare the results with previous research of Petersen[3](3 collapse mechanism) and Seidel[7][8] (4 ranges of relation between tensile force acting
on the tubular body and axial force in bolt) and verify two results.
2.2 Step1: In Step1, we will examine the response of all the bolts at one flange-joint of wind turbine tower. Using FEM software to model, a part of wind turbine that has flange joint with high-strength bolts [5] (Figure.4 at Step1), identify
the response of each bolts when they are put together in the tower – joint model. It includes the pre – tension of bolt, axial force in bolt, critical states of bolt and the separation of ring flange – joint.
[image:3.612.83.259.246.365.2]2.3 Step2: From the analytical results, we can calculate the stiffness at each flange joint in whole wind turbine tower. Understanding the stiffness of each part in whole tower allowed modeling the whole tower like Figure.4 at Step2 simply.
Figure 5. The flowchart of the research
[image:3.612.322.568.397.659.2]International Journal of Emerging Technology and Advanced Engineering
Website: www.ijetae.com (ISSN 2250-2459,ISO 9001:2008 Certified Journal, Volume 5, Issue 10, October 2015)
296
III. RESULTS AND DISCUSSIONS
3.1 Step0
[image:4.612.49.283.223.463.2]3.1.1. Model: In Step 0 we model part of flange joint at one bolt like Figure 5 and the specifications of bolt and flange have been shown in Table 1.
Table 1.
Specifications of bolt and flange joint
Type of bolt M36 Material of bolt F10T Effective cross-sectional area of
bolt( Ab) 8.17cm
2
Distance between the end of
flange bolt and center of bolt (e) 65 mm Distance between center of plate
of tubular body and center of bolt (g) 59 mm Thickness of flange plate (tF) 75mm Thickness of tubular body (ts) 18 mm Shaft diameter of bolt (ds) 36 mm Diameter of the bolt hole (dh) 39 mm Material of flange plate and
tubular body
SM400 Yield point stress intensity of
flange plate and tubular body 235 N/mm
2
Yield point stress intensity of
bolts 900 N/mm
2
wb≃ws 100 mm 3.1.2. Analysis Methods: In Step0, we perform to analysis in 2 periods. Period 1, we set up the pre-stress (pre-tensile force) into bolt until reaching to the initial axial force by using couple temp – displacement analytical method. It means we cannot set up pre-stress in bolt normally, so we must assume that the bolt has been cooled at the suitable temperature. Because the nuts at both ends of the bolts have been attached in the flange, therefore when the bolt is cooled, the bolts will automatically be set up the pre-stress. By the test gradually we can cooled the bolts until reaching to the initial axial force in bolt. In this study the initial axial force of bolt was calculated by this formula Tv = 0.75×σy×Ae = 675 kN. In period 2, keeping the initial
axial forces in bolts and the tubular body was pulled by tensile forces TS.
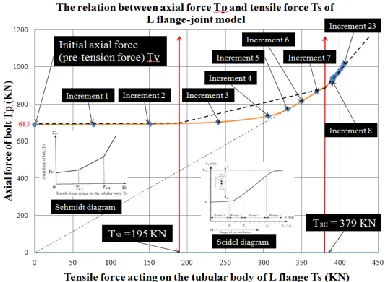
3.1.3. Results: With FEM analysis results, we have the relation between axial force in bolt and tensile force acting on the tubular body shown in Figure 7. From this results and compare with the Schmidt-Neuper[1] diagram and
Seidel[7][8] diagram (Figure.1,4) they have the same curve.
[image:4.612.50.289.226.459.2]See the Figure 7 in the first step of analysis we put the initial tensile force (pre-tension) in bolt to Tv = 685 KN by Couple temperature – displacement method, the second step started after reaching to the initial tensile force on bolt by putting the pull force (tensile force). In the first period although the tensile force increased fast, axial force in bolt increased very slowly. This means that the pull force (tensile force) acting on the top of the flange consumed to overcome the initial pressure force in the bolt
Figure 7. The relation between axial force Tp and Tensile force Ts
Now we find the similarities between FEM analysis result with S – N diagram, collapse mechanisms was proposed by Petersen, and 4 ranges collapse mechanism was developed by Seidel. With the configuration of this study was given (Table 1) we calculated the TSI = 195 KN
and TSII = 379 KN. See Figure 7 the tri-linear proposed by
Schmidt has a good agreement with FEM analysis.
Figure 8. Stress in bolt, flange, tubular body and the separation of flange joint at increment 0, 1, 2
[image:4.612.348.540.245.386.2]International Journal of Emerging Technology and Advanced Engineering
Website: www.ijetae.com (ISSN 2250-2459,ISO 9001:2008 Certified Journal, Volume 5, Issue 10, October 2015)
297
Figure 10. Stress in bolt, flange, tubular body and the separation of [image:5.612.323.561.136.666.2]flange joint at increment 6, 7, 8
Figure 11. Stress in bolt, flange, tubular body and the separation of flange joint at increment 9, 10, 23
Four ranges were developed by Seidel.
Range 1 (A) 0-Z1 the range 1 includes increments from 0 to 2. See Figure 7, 8 the TS increased fast but the TP almost
approximated. Stresses between flanges are reduced while contact zone is closed (Figure 8).
Range 2 (B) Z1-Z2 The range 2 includes increments from 3 to 5 (Figure 7). See the Figure 7, 9 the relationship curve between tensile force acting on tubular body Ts and axial force in bolt Tp is nonlinear curve. Successive opening of flanges.
Range 3(C) Z2-Z3 This range includes the increment from 5 to 8. See the Figure 7, 10 the relationship between Tp and
TS is linear and when connecting increment points from 5
to 8 and coordinate origin. It means that open connection with slope depending on loads geometry. From the increment 7 to 8 the tensile acting on tubular body reached to TSII = 379 KN.
Range 4(D) from Z3 to onward. This range includes increment from 8 to onward. See Figure 7, 11. Plastification of bolts and/or flange until failure of the connections.
Figure 12. The relationship between tensile force Tv and Separation of flange connection
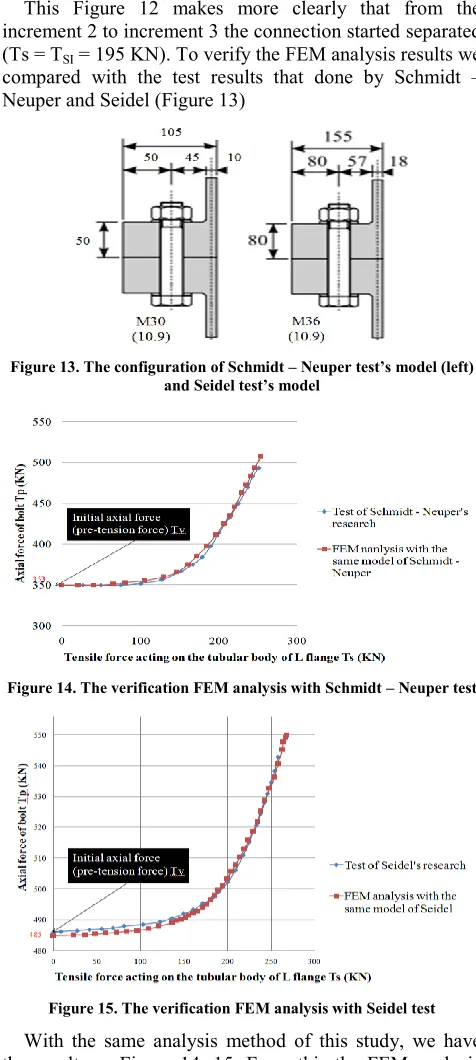
This Figure 12 makes more clearly that from the increment 2 to increment 3 the connection started separated (Ts = TSI = 195 KN). To verify the FEM analysis results we
[image:5.612.358.527.199.306.2]compared with the test results that done by Schmidt – Neuper and Seidel (Figure 13)
[image:5.612.331.558.341.470.2]Figure 13. The configuration of Schmidt – Neuper test’s model (left) and Seidel test’s model
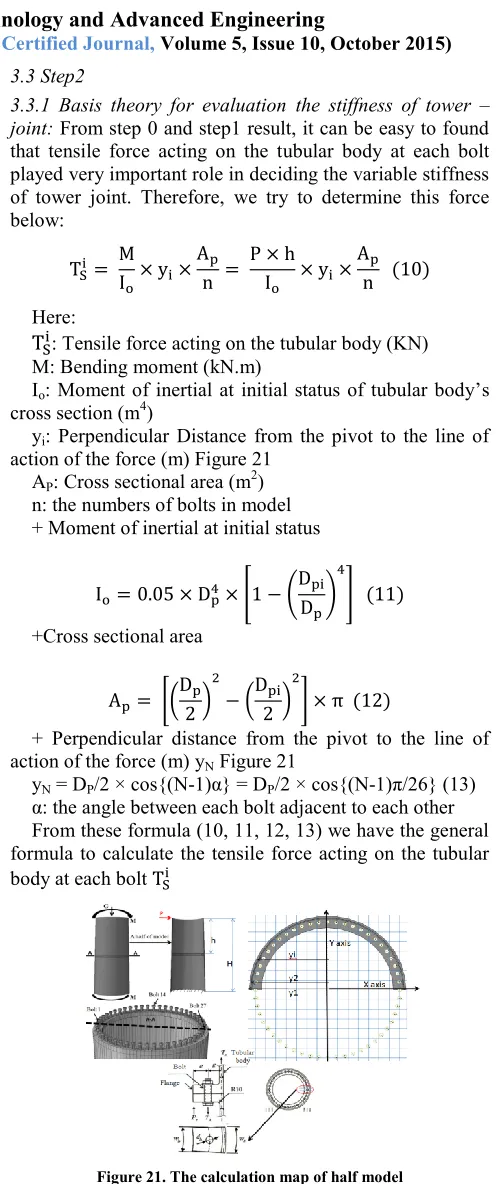
Figure 14. The verification FEM analysis with Schmidt – Neuper test
Figure 15. The verification FEM analysis with Seidel test
[image:5.612.330.554.485.628.2] [image:5.612.60.276.575.692.2]International Journal of Emerging Technology and Advanced Engineering
Website: www.ijetae.com (ISSN 2250-2459,ISO 9001:2008 Certified Journal, Volume 5, Issue 10, October 2015)
298
3.2 Step1 3.2.1. Model
[image:6.612.59.280.197.317.2]In Step 1 we create model is a part of tower at the flange joint[4][5] like Figure 16.
Figure 16. The modeling a half of flange joint in wind turbine tower
Table 2.
Specifications of bolt and flange joint
Outer diameter of tubular body Dp 1675 Inner diameter of tubular body Dpi 1639 Inner diameter of flange F 1409 Diameter of bolts circle G 1539 Number of bolts (in a half of flang joint
model) half of bolt 26 + 2×a Thickness of flange plate (tF) 75mm
[image:6.612.342.554.380.516.2]3.2.2. Analysis Methods: The same analysis method with step 0, we also set up the pre-stress into bolts until reaching to the initial axial force by using couple temp – displacement analytical method. To simplify the analysis we change the forces diagram acting on the flange joint of tower. Fixing the below tubular body and putting the horizontal force at the top of above tubular body like Figure 16.
3.2.3. Results: The relation between axial force and tensile force acting on the tubular body of each bolt (from bolt 1 to bolts 27 were defined like figure 16) shown in Figure 17. From the bolt 1 to bolt 13, the shape of the analysis’s results are the same with step 1.It means that the model and analysis method in this step is fine. Besides that, from bolt 1 to bolt 13 the bolt are pulled because the tubular body and flange joint from bolt 1 to bolt 13 was pulled and the opposite side ,from the bolt 14 to bolt 27,the initial axial forces in each bolt are almost unchanged. It means that the tubular body and flange joint are compressed.
In figure 18 it expressed the relation between axial force and tensile force acting on the tubular body of each bolt. We see that when the horizontal force increase the axial force in bolt also increase but it is very slowly in the first, the increasing are descending from bolt 1 to bolt 13. From bolt 14 to bolt 27 the axial force are almost unchanged with the initial axial forces. In figure 19 we can find out the relation between horizontal force and displacement at the top of model. The relationship between horizontal force acting on the top of model and displacement at the top of model shown in Figure 19. The analysis results show that when the horizontal force increased from 0 to 610 KN, horizontal force and displacement have linear relation. It means that the stiffness of tower in this range of loading was not changed. From horizontal force P = 610 KN the relation was nonlinear. If call K = P/δ is the stiffness of tower, from Figure 19 can see that K decreased. Besides that from FEA results at horizontal force at the top of model reached to P = 610 KN the ring flange connection started separated. From now we call P= 610 KN is P- separated.
Figure 17. The relation between axial force and tensile force acting on the tubular body of each bolt
[image:6.612.341.556.543.692.2]International Journal of Emerging Technology and Advanced Engineering
Website: www.ijetae.com (ISSN 2250-2459,ISO 9001:2008 Certified Journal, Volume 5, Issue 10, October 2015)
[image:7.612.319.567.102.694.2]299
Figure 19. The relation between horizontal force and displacement atthe top of model
Figure 20. The relationship between horizontal force acting on the top of model, P and tensile force acting on the tubular body at each bolt
Figure 20 showed the relationship between horizontal force acting on the top of model, P and the tensile force acting on the tubular body at each bolt. At previous step mentioned that the TSI = 195 KN can be calculated by using
Schmidt – Neuper formula. According to the results in previous step at tensile force acting on the tubular body of each bolt Ts reached to TSI = 195KN like Schmidt –
Neuper tri- linear diagram , the L flange – joint started separated (the stiffness of l flange – joint reduced). At Figure 20, when bolt 1 reached to the TSI = 195 KN, it
mean that the stiffness of part L flange – joint at bolt 1 reduced. The horizontal force acting on the top at model also reached to the P- separated = 610 KN. Comparing with the Figure 4.27, this phenomenal was suitable with the time when the stiffness of tower – joint was also reduced and the ring flange – joint started separated.
3.3 Step2
3.3.1 Basis theory for evaluation the stiffness of tower – joint: From step 0 and step1 result, it can be easy to found that tensile force acting on the tubular body at each bolt played very important role in deciding the variable stiffness of tower joint. Therefore, we try to determine this force below:
TSi =
M Io
× yi×
Ap
n = P × h
Io
× yi×
Ap
n (10)
Here:
TSi: Tensile force acting on the tubular body (KN)
M: Bending moment (kN.m)
Io: Moment of inertial at initial status of tubular body’s
cross section (m4)
yi: Perpendicular Distance from the pivot to the line of
action of the force (m) Figure 21 AP: Cross sectional area (m2)
n: the numbers of bolts in model + Moment of inertial at initial status
Io= 0.05 × Dp4× [1 − (
Dpi
Dp
)
4
] (11)
+Cross sectional area
Ap= *(
Dp
2)
2
− (Dpi 2 )
2
+ × π (12)
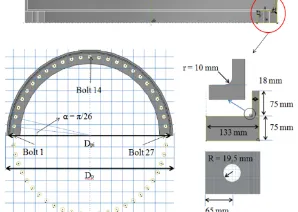
+ Perpendicular distance from the pivot to the line of action of the force (m) yN Figure 21
yN = DP/2 × cos{(N-1)α} = DP/2 × cos{(N-1)π/26} (13)
[image:7.612.53.278.137.300.2]α: the angle between each bolt adjacent to each other From these formula (10, 11, 12, 13) we have the general formula to calculate the tensile force acting on the tubular body at each bolt TSi
[image:7.612.62.272.339.493.2] [image:7.612.362.529.555.680.2]International Journal of Emerging Technology and Advanced Engineering
Website: www.ijetae.com (ISSN 2250-2459,ISO 9001:2008 Certified Journal, Volume 5, Issue 10, October 2015)
300
Figure 21(cont) The dimension of a half of model+At bolt N
TSN=
M 𝐼𝑜
× yN×
𝐴𝑝
n
= P × h
Io ×
DP
2 × cos[(N − 1) ×∝] × 𝐴𝑝
n (14)
[image:8.612.94.243.138.244.2]α = 2π/n
Figure 22. The relationship between tensile force Ts and horizontal force P by calculation
Using the formula from 10 to 14, the relation between tensile force acting on the tubular at each bolt Ts and horizontal force acting on the top of model, P shown in Figure 22. Compare the results were shown in Figure 22 (Calculated results) and Figure 20 (analysis results) they have a good agreement. Two of results also show that when tensile force acting on the tubular body reached to the TSI at
bolt 1, the horizontal force at the top of the model also reached to P-separated = 610 KN and ring flange connection started separated. From the Figure 20 and 22, we also found that when the tensile force acting on tubular body at bolt 1 reached to TSI, the tensile force acting on
tubular body from bolt 2 to bolt 13 had not reached TSI yet.
3.3.2 Proposed simplified formula to evaluate variable stiffness of tower joint: Therefore, the status of TS played a
very important role to decide the stiffness of tower. Because when each bolt from 1 to 13 reached to TSI, the
stiffness of tower decrease amount. Here assume that each bolt in ring flange corresponding with area (ao) on tubular
body which is equivalent to ao = AP/n. In this case AP = 937
cm2, the number of bolt in ring flange n = 52, a
o = 18,02
cm2. This area in the cross section of tubular shown in the Figure 23
Figure 23. Corresponding area with each bolt on cross section of tubular body
So the moment of inertial (io) of each part refer to Y axis
can be calculated as follow + Bolt N
ioN≃ aoyN2 (15)
b: The length of corresponding area (a0)
b = DP×π/n
tS: The thickness of tubular body
ao: Corresponding area on tubular body at each bolt
ao = AP/n
yN: Perpendicular Distance from the pivot to the line of
action of the force refer to Y axis was shown in formula (13)
To evaluate the stiffness of tower in this case we suggest a coefficient KIJ.KIJ is symbolized for the rest of moment of
inertial (io) of corresponding area (ao) when the respective
tensile force acting on the tubular body TS > TSI. We have:
KNj=
TSII− TS Nj
TSII− TSI
(16)
0 ≤ KNj≤1 (17)
+ TSNj≤ TSI the moment of inertial (io) is unchanged. It
[image:8.612.371.515.260.350.2] [image:8.612.51.270.264.511.2]International Journal of Emerging Technology and Advanced Engineering
Website: www.ijetae.com (ISSN 2250-2459,ISO 9001:2008 Certified Journal, Volume 5, Issue 10, October 2015)
301
+ TSI≤TS Nj
≤ TSII the moment of inertial (io) gradually
reduced
+ TSNj ≥ TSII the corresponding area on tubular body at
each bolt, ao = AP/n almost lost. Moment of inertial (io)
reduced until zero
From formula (23) can see that + TSNj≤ TSI , Kij = 1
+ TSI≤TS Nj≤
TSII, KNj is calculated by formula (16)
+ TSNj≥ TSII, KNj = 0
Here:
N: location of bolt.
j: when the tensile force TSNj = TSI at bolt j
For more clearly we give some example K11 is at the bolt 1, and TS11= TSI tại bolt 1
K12 is at the bolt 1 and TS12 is tensile force acting on
tubular body at bolt 1, TS22 = TSI at bolt 2. It means that at
that time the tensile force acting on the tubular body at bolt 1 TS12 > TS22
+If j ≤ N, KNj = 1. For example
K21 =1 because in this case TS21 < TSI at bolt 2
+According to the explanation above, the formula to evaluate the rest of moment inertial is as follow:
𝐾𝑁𝑗× 𝑖𝑜𝑁 (18)
+Therefore the lost of moment of inertial defined by:
(1 − 𝐾𝑁𝑗) × 𝑖𝑜𝑁 (19)
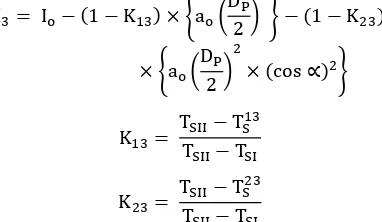
From all the formula from (10) to (19) we have equation to calculate the moment of inertial of tubular body’s cross section (Ij):
When TS11(at bolt 1) = TSI : (K33 =1)
I1 = Io
When TS22 (at bolt 2) = TSI : (K22 = 1)
I2 = Io - (1 − K12) × io1
I2= Io− (1 − K12) × (ao(
DP
2)
2
)
K12=
TSII− TS12
TSII− TSI When 𝑇𝑆33 (at bolt 3) = TSI : (K33 = 1)
I3= Io− (1 − K13) × i01− (1 − K23) × i02
I3= Io− (1 − K13) × ,ao(
DP
2)
2
- − (1 − K23)
× ,ao(
DP
2)
2
× (cos ∝)2
-K13=
TSII− TS13
TSII− TSI
K23=
TSII− TS23
TSII− TSI
With the same calculation, the general formula will be gained below:
When 𝑇𝑆
𝑗𝑗 (at bolt j) = T
SI
𝑰𝒋= 𝑰𝒐− (𝟏 − 𝑲𝟏𝒋) × 𝒊𝟎𝟏− (𝟏 − 𝑲𝟐𝒋) × 𝒊𝟎𝟐−
(𝟏 − 𝑲𝟑𝒋) × 𝒊𝟎𝟑− ⋯ − (𝟏 − 𝑲(𝑵−𝟏)𝒋) × 𝒊𝟎𝑵−𝟏 (𝟐𝟎)
Besides from the relationship between tensile forces acting on the tubular body of each bolt was calculated in Figure 22 we have the function to express the relation between TS and P in each bolt. We have the Table 3 at last
page of this paper
From Table 3 the variable stiffness of tower was calculated responding to the change of horizontal force, P. Here when P ≥ P-separated = 610 KN the stiffness of tower decreased.
Below equation, show the relationship between horizontal force acting on the top of model and the displacement at the top of model
𝛿 = 𝑃𝐻
3
3𝐸𝐼 (21)
[image:9.612.349.540.141.252.2]Therefore, from the calculation by using the formula from (10) to (21), the relationship between horizontal force, P and displacement at the top of model shown in Table 4 and Figure 24
Table 4.
The relationship between horizontal force acting on the top of model and the displacement at the top of model
Horizontal force, P (KN)
Moment of
inertial, I (m4) δ(mm) Displacement ,
0 0
605.5901 0.01638 20.129
609.375 0.016372 20.265
623.0032 0.016312 20.794
647.8405 0.016153 21.836
684.2105 0.015854 23.496
735.8491 0.015351 26.098
809.1286 0.014546 30.285
915.493 0.01328 37.534
International Journal of Emerging Technology and Advanced Engineering
Website: www.ijetae.com (ISSN 2250-2459,ISO 9001:2008 Certified Journal, Volume 5, Issue 10, October 2015)
[image:10.612.54.284.137.341.2]302
Figure 24. The comparison between FEM analysis results andcalculated results
See the Figure 24, the results were calculated by using proposed formulas above have a good agreement with the FEM analysis result.
Therefore, using Schmidt – Neuper formula to calculate the TSI, TSII and combine with the formula from (10) to (21)
the variable stiffness of tower can be calculated without conducting the FEM analysis.
IV. CONCLUSION
+With FEM analysis the L flange – joint, model of tower – joint were reproduced like the real worked mechanism
+The FEA results have a good agreement with tri-linear diagram (S-N diagram), 3 collapse mechanisms of Petersen and new 4 ranges failure mode Seidel
+With S-N formula, TSI, TSII were calculated. From the
results we can find out that when the tensile force acting on the tubular body TS=TSI, the L flange – joint started
separated (the stiffness of L flange- joint reduced)
+The comparison FEM analysis result with Schmidt – Neuper’s test result and Seidel’s test result have good agreement. The FEA results have been validity
+Horizontal force P >P-separated (the stiffness of tower – joint decreased). At P –separated the ring flange stared separated and matched with the time when the tensile force acting on tubular body TS reached to TSI
+The results of calculations by using the simplified formula have good agreement with FEM results. It means that we can determine the stiffness of tower during its operation by simple method above without conducting the very complicated FEM analysis.
REFERENCES:
[1] Guidelines for Design of Wind Turbine Support Structures and Foundation(JSCE), chapter 7, December 2010.
[2] Schmidt, H.,Neuper,M.: On the elastostatic behavior of an eccentrically tensioned L-joint with pre-stressed bolts,Stahlbau,66,pp.163-168,1997
[3] Petersen,CH.:Steel construction, Braunschweig : Vieweg-Verlag,1988
[4] Architectural Institute of Japan: Guideline structural design of chimney, 2007
[5] Architectural Institute of Japan: Guidebook on Design and Fabrication of High Strength Bolted Connections
[6] Germanischer Lloyd: GL wind 2003,Guideline for Certification of Wind turbines,2003
[7] Heistermann, C., Husson, W., Veljkovic, M.: ―Flange connection vs. friction connection in towers for wind turbines‖, Proc. of Nordic steel and construction conference (NSCC 2009), pp. 296 – 303, Malmö, Sweden, 2009
[8] Seidel, M.: ―Zur Bemessung geschraubter Ringflanschverbindungen von Windenergieanlagen‖,Dissertation, Universität Hannover, Institut für Stahlbau, 2001
![Figure 1. Schmidt –Neuper diagram[2]](https://thumb-us.123doks.com/thumbv2/123dok_us/8696509.878409/2.612.330.545.154.690/figure-schmidt-neuper-diagram.webp)