comm
en
t
re
v
ie
w
s
re
ports
de
p
o
si
te
d r
e
se
a
rch
refer
e
e
d
re
sear
ch
interacti
o
ns
inf
o
rmation
Genetic background influences murine prostate gene expression:
implications for cancer phenotypes
Daniella Bianchi-Frias, Colin Pritchard, Brigham H Mecham,
Ilsa M Coleman and Peter S Nelson
Address: Divisions of Human Biology and Clinical Research, Fred Hutchinson Cancer Research Center, Fairview Avenue, Seattle, WA 98109-1024, USA.
Correspondence: Peter S Nelson. Email: [email protected]
© 2007 Bianchi-Frias et al.; licensee BioMed Central Ltd.
This is an open access article distributed under the terms of the Creative Commons Attribution License (http://creativecommons.org/licenses/by/2.0), which permits unrestricted use, distribution, and reproduction in any medium, provided the original work is properly cited.
Prostate gene expression
<p>Microarray analyses to quantitate transcript levels in the prostates of five inbred mouse strains identified differences in gene expression in benign epithelium that correlated with the differentiation state of adjacent tumors.</p>
Abstract
Background: Cancer of the prostate is influenced by both genetic predisposition and
environmental factors. The identification of genes capable of modulating cancer development has the potential to unravel disease heterogeneity and aid diagnostic and prevention strategies. To this end, mouse models have been developed to isolate the influences of individual genetic lesions in the context of consistent genotypes and environmental exposures. However, the normal prostatic phenotypic variability dictated by a genetic background that is potentially capable of influencing the process of carcinogenesis has not been established.
Results: In this study we used microarray analysis to quantify transcript levels in the prostates of five commonly studied inbred mouse strains. We applied a multiclass response t-test and determined that approximately 13% (932 genes) exhibited differential expression (range 1.3-190-fold) in any one strain relative to other strains (false discovery rate ≤10%). Expression differences were confirmed by quantitative RT-PCR, or immunohistochemistry for several genes previously shown to influence cancer progression, such as Psca, Mmp7, and Clusterin. Analyses of human prostate transcripts orthologous to variable murine prostate genes identified differences in gene expression in benign epithelium that correlated with the differentiation state of adjacent tumors. For example, the gene encoding apolipoprotein D, which is known to enhance resistance to cell stress, was expressed at significantly greater levels in benign epithelium associated with high-grade versus low-grade cancers.
Conclusion: These studies support the concept that the cellular, tissue, and organismal context contribute to oncogenesis and suggest that a predisposition to a sequence of events leading to pathology may exist prior to cancer initiation.
Background
Family history and race represent two of the greatest contrib-utors to the probability of developing cancer of the prostate.
Recent estimates suggest that 42% of prostate cancer risk may be attributed to heritable factors that include the influ-ence of rare alleles capable of exerting substantial effects,
Published: 18 June 2007
Genome Biology 2007, 8:R117 (doi:10.1186/gb-2007-8-6-r117)
Received: 5 October 2006 Revised: 30 April 2007 Accepted: 18 June 2007 The electronic version of this article is the complete one and can be
act to amplify or buffer phenotypes [1]. Racial background accounts for disparities of more than 40-fold in the incidence of prostate cancer between Western and Asian men, and also associates with cancer progression and lethality [2]. Impor-tantly, risks attributed to racial categories may reflect not only genetic variables, but also a myriad of shared environ-mental exposures that include diet, infectious disease, and medication use.
Cancer susceptibility represents a continuum of interactions between the host and environment. At the extremes, each can exert dominant effects on the neoplastic process. For exam-ple, inherited differences in specific gene products, such as p53, Rb, and APC, lead to the near-universal development of cancers, regardless of differences in the host environment [3]. Similarly, exposures to ionizing radiation or chemical muta-gens can produce high rates of neoplasia regardless of the host genetic background. However, most human malignan-cies cannot be attributed to specific genes or extrinsic agents that exert dominant effects, but rather arise in the setting of complex multi-factorial gene-environment relationships. In this context, studies of twins have found that genetic back-ground is associated with a large proportion of supposedly nonhereditary cancers, a finding supported by the familial clustering of specific malignancies [1].
The identification of low-penetrance genetic modifiers that influence cancer phenotypes has been challenging in humans due to substantial genetic heterogeneity and the inability to identify, quantify and control for a wide-range of environ-mental variables. Furthermore, tumors arising in specific organ sites may exhibit multiple different histologies that include differentiation state and the propensity to progress at variable rates [4,5]. To overcome these hurdles, inbred strains of model organisms such as the mouse have been used to control environmental influences, homogenize tumor his-tologies, and reduce the complexity of genetic backgrounds [6]. Manipulating these variables has facilitated studies that link genomic loci with the propensity to develop neoplasia and the identification of genes that modulate tumor behavior. Despite highly similar genomes, striking differences in tum-origenesis and metastasis have been observed in different rodent strains induced to develop cancers of the lung, breast, intestine, skin, and prostate [7-11]. Breeding strategies designed to isolate the genes responsible for cancer suscepti-bility have successfully identified modifying loci [12]. The characterization of specific genes modulating cancer pheno-types indicates that carcinogenesis is influenced by tumor-intrinsic features as well as variables in the host macro- and microenvironments [13]. Intrinsic cellular properties include proliferation rates, genome stability, differentiation potential and the ability to senesce or undergo apoptosis. Tumor-'extrinsic' factors that influence the process of carcinogenesis include hormone concentrations, immune response, drug metabolism, and features of the local stroma involving matrix
loci exhibit multiple genetic interactions that suggest the existence of molecular networks that underlie cancer predis-position [6,7].
Studies of prostate carcinogenesis in rodent models devel-oped using chemical mutagens or gene-targeting strategies have clearly demonstrated modifications of cancer incidence and progression rates dependent on the host genotype. The substantial tumor-promoting or tumor-suppressing effects exerted by innate host factors suggests that features of benign tissues could allow the behavior of tumor growth to be pre-dicted. To support this hypothesis, influential biochemical or tissue variations must occur and must exhibit measurable characteristics. While variations in immune effectors and hormone levels represent likely influences on prostate car-cinogenesis in these model systems, differences intrinsic to the prostate gland could also account for tumor incidence rates between strains. One measurement of phenotypic potential involves the identification and quantification of cel-lular gene transcription.
To date, global analyses of gene expression in the normal prostate gland of mouse strains have not been reported. In this study, we used microarray analysis to profile prostate gene expression across five inbred mouse strains commonly used for modeling prostate development and carcinogenesis. We found substantial strain-dependent differences in pros-tate transcript expression patterns, including several genes implicated in prostate cancer development and progression. Analyses of these strain-variable genes in the human prostate enabled the determination of associations between transcript expression levels and phenotypes of prostate cancer, such as tumor grade. The results indicate that variables in prostate gene expression present prior to cancer initiation could mod-ify tumorigenesis.
Results and discussion
Determination of strain-specific differences in mouse prostate gene expression
Several studies have demonstrated the influence of genetic background on the development and progression of prostate cancer in rodents. Using a genetically engineered mouse model driving SV40T antigen expression in the prostate
gland, designated TRAMP, Gingrich et al. [14] determined
that prostate tumors arising in a mixed C57BL/6 × FVB back-ground display reduced latency, increased primary tumor growth and enhanced metastatic progression when compared to tumor development in a pure C57BL/6 background. A recent study of Pten deficient mice reported a critical role for genetic background that influenced the onset, tumor spec-trum, and progression rates for cancers that included pros-tate carcinoma [15]. Strain-specific effects have also been observed in mice with inactivation of the prostate-specific
comm
en
t
re
v
ie
w
s
re
ports
refer
e
e
d
re
sear
ch
de
p
o
si
te
d r
e
se
a
rch
interacti
o
ns
inf
o
rmation
neoplasia was more frequent in C57BL/6 and FVB/N strains than in the 129/SvImJ background (Cory Abate-Shen, per-sonal communication). Genetic background has also been reported to influence transgenic models of rat prostate car-cinogenesis, with cancer incidence rates ranging from 0% to 83%, depending on strain background [11].
To ascertain the extent of gene expression variability in the normal prostate arising in the context of different genetic backgrounds, we used cDNA microarray analysis to measure transcript abundance levels for approximately 8,300 genes in
the prostate glands of five frequently studied strains of Mus
musculus; C57BL/6, 129X1/Sv, BALB/c, FVB/N and DBA/2.
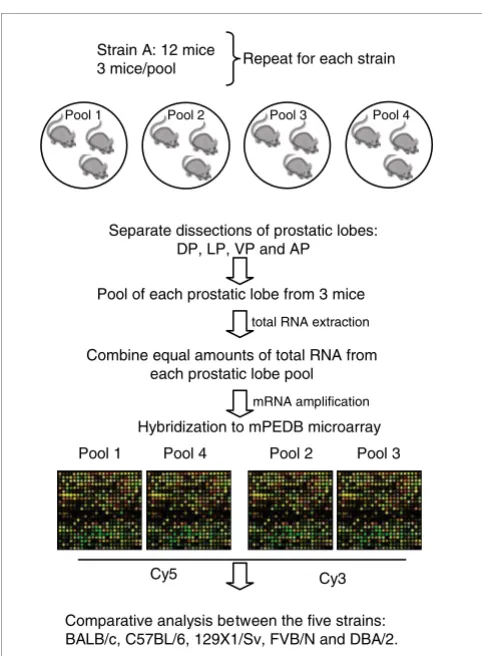
Four biological replicates consisting of tissues pooled from groups of three individuals were generated to facilitate statis-tical analyses and control for individual variability (Figure 1).
We employed a common reference pool design to control for technical differences in array construction and hybridization. The transcript level of each gene was measured as the ratio of the intensity of hybridization signal for a strain-specific experiment relative to that for the reference pool.
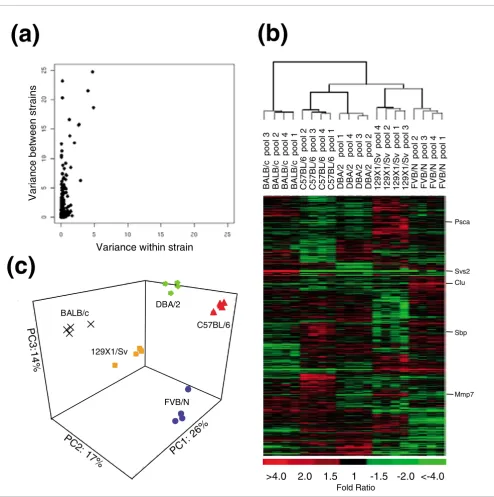
To determine the extent and magnitude of prostate gene expression variation between strains, we generated a one-way ANOVA table for each gene and compared the within-strain mean square (intra-strain replicates) to the between-strain mean square. As expected, the vast majority of genes exhib-ited low variance across the 20 array experiments. Further-more, few differences were observed in the intra-strain comparisons, a result likely influenced by the pooling of sam-ples to minimize the contribution of any individual mouse. However, comparisons of gene expression between strains identified substantial reproducible differences in the expres-sion of many genes (range from 1.3 to 190-fold; Figure 2a). We used significance analysis of microarrays (SAM)
proce-dures and applied a multiclass response t-test to identify
genes whose expression in one strain significantly differed from the other four strains. Approximately 13% of the genes (932 genes) exhibited significant differential expression given a moderate estimate of false positive differences of 10%. The heat map revealed that the pattern of variability in transcript levels did not result from variations unique to a particular strain, but rather represents genetic variability across all five strains assessed (Figure 2b).
To explore the relationships between strains, we performed average linkage hierarchical clustering using all the genes (data not shown) and then using only the 932 genes that were differentially expressed between strains as determined by the SAM analysis (Figure 2b). The resulting dendrograms are identical, indicating that strain specific variation is not entirely explained by a small number of genes exhibiting large changes in gene expression. The expression patterns derived from prostates of the same strain are highly concordant and produce a consistent grouping of samples according to their strain of origin (Figure 2b). Overall, the samples are divided into three major branches: branch I is represented by BALB/ c; branch II is represented by C57BL/6 and DBA/2; and branch III is represented by 129X1/Sv and FVB/N. Further-more, within each branch, sub-branches clearly grouped pools according to strain.
In order to further characterize the relationship between strains, we performed principal components analysis (PCA) using the 932 differentially expressed genes (Figure 2c). The first four components explained 70% of the total variance. As expected, each of these informative components identified a subset of genes that discriminated between at least two of the strains. Taken together, these results show that strain-spe-cific variation results from the differential expression of large numbers of genes and that this signal is stronger than the within-strain variability when using sample pools.
[image:3.612.54.295.81.409.2]Experimental design Figure 1
Experimental design. Prostates from 12 mice from each of 5 strains of Mus musculus (C57BL/6, 129X1/Sv, BALB/c, FVB/N and DBA/2) were resected and individual lobes were dissected: DP, dorsal prostate; LP, lateral prostate; VP, ventral prostate; AP, anterior prostate. Each experimental sample represents a pool of equal amounts of RNA for each prostatic lobe from three animals. Four independent experimental samples were created per strain: 12 mice divided into 4 pools of 3 mice each for a total of 4 microarray experiments per strain. Amplified RNA from each
experimental sample was hybridized against a reference pool onto custom mouse prostate cDNA microarrays using alternate dye-labeling to account for dye-specific effects.
Strain A: 12 mice 3 mice/pool
Combine equal amounts of total RNA from each prostatic lobe pool
mRNA amplification
Pool 1 Pool 4 Pool 2 Pool 3
Cy5 Cy3
Pool of each prostatic lobe from 3 mice
Hybridization to mPEDB microarray
Comparative analysis between the five strains: BALB/c, C57BL/6, 129X1/Sv, FVB/N and DBA/2.
Separate dissections of prostatic lobes: DP, LP, VP and AP
Pool 1 Pool 2 Pool 3 Pool 4
Among the expressed genes, those encoding pituitary
tumor-transforming 1 (Pttg1) and adenylate cyclase-associated
pro-tein 1 (Cap1) were found to be differentially expressed
between prostates of C57BL/6 and 129X1/Sv strains. Previ-ous studies have found concordant strain-dependent differ-ences in the expression of these genes in other mouse tissues
[16]. Transcripts encoding several members of the histocom-patibility complex also exhibited strain-dependent differ-ences. Relative to other strains, H2-Ea is expressed highly in prostates of DBA/2 and BALB/c mice; H2-k is expressed highly in 129X1/Sv and C57BL/6; H2-Q1 is expressed highly in 129X1/Sv, FVB/N and C57BL/6; and transcripts encoding
[image:4.612.63.557.82.578.2]Prostate gene expression differences among strains Figure 2
Prostate gene expression differences among strains. (a) Scatter plot of variance in gene expression levels between strains and within strains. (b) Average-linkage hierarchical clustering for the 932 differentially expressed genes among the five mouse strains (FDR <10%). Heat map colors reflect fold ratio values between sample and reference pool and mean-centered across samples. Columns represent biological replicates for each strain. Rows represent individual genes. Values shown in red are relatively larger than the overall mean; values shown in green are relatively smaller than the overall mean (see scale). Genes whose expression changes were confirmed by qRT-PCR, western blot or immunohistochemistry are listed. (c) Separation of the five strains in three-dimensional principal component space by applying PCA to the 932 genes with strain variance.
-1.5 -2.0 <-4.0
1
1.5
2.0
>4.0
(b)
(a)
Clu Psca
Svs2
Sbp
Variance within strain
Variance bet
w
e
en
strains
(c)
PC
1:
26
%
PC
2:
17
%
P
C
3
:1
4
%
BALB/c
129X1/Sv
DBA/2
C57BL/6
FVB/N
Mmp7
Fold Ratio
BA
L
B
/c
p
o
ol
3
BA
L
B
/c
p
o
ol 2
BA
L
B
/c
p
o
ol
4
BA
L
B
/c
p
o
ol 1
C57BL/6 pool 2 C57BL
/6 p
o
ol
3
C57BL
/6 p
o
ol
4
C57BL
/6 p
o
ol 1
DB
A/2 pool 1
DB
A/2 pool 4
DB
A/2 pool 3
DB
A/2 pool 2
129X1/S
v
p
o
ol
4
129X1/S
v
p
o
ol
2
129X1/
S
v
p
o
ol
1
129X1/
S
v
p
o
ol
3
FVB/N p
ool
2
FVB/N p
ool
3
FV
B/
N
p
o
ol
4
FVB/N p
ool
comm
en
t
re
v
ie
w
s
re
ports
refer
e
e
d
re
sear
ch
de
p
o
si
te
d r
e
se
a
rch
interacti
o
ns
inf
o
rmation
H2-D1 were least abundant in the C57BL/6 strain. Interest-ingly, the pattern of expression of this gene family did not correlate with the known H2 haplotypes of the strains, a find-ing also reported in a study evaluatfind-ing strain-specific gene expression variation in the mouse hippocampus [17].
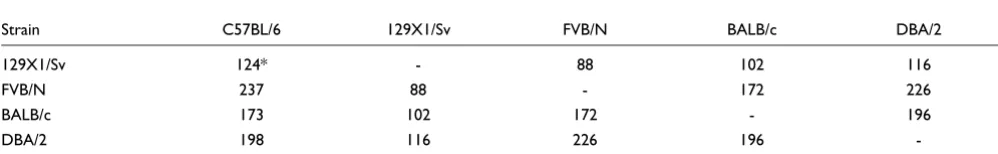
To identify differentially expressed genes unique to individ-ual strains, we performed a pair-wise comparison of tran-script abundance levels between each strain for a total of 10 pair-wise comparisons. The number of genes found to be dif-ferentially expressed between any two strains varied depend-ing on the strains compared (Table 1). Strains 129X1/Sv and FVB/N exhibit the fewest differences in prostate gene expres-sion (88 genes) whereas strains FVB/N and C57BL/6 exhibit the greatest number of transcript abundance differences (237 genes). Analyses of the promoter regions of these strain-vari-able genes did not identify sequence motifs that would sug-gest common regulatory mechanisms.
Confirmation of strain-dependent differences in prostate gene expression
Several genes exhibiting strain-dependent differences in prostate expression have been studied in the context of
pros-tate development (for example, Sbp), androgen regulation
(Fabp5, Odc), tumorigenesis (for example, Psca, Azgp1, Apod, Mmp7, Egf, Mgst1, Clusterin), and the progression of
metastatic cancer (Cxcl12, B2m, H2 family members) [8]. To
confirm the microarray results, we selected several of these genes for analysis by quantitative real-time
reverse-transcrip-tion PCR (qRT-PCR). Primer pairs specific to Svs2, Psca,
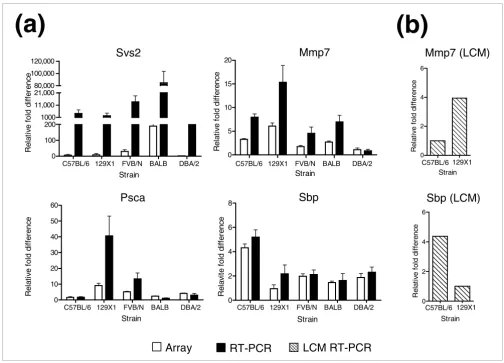
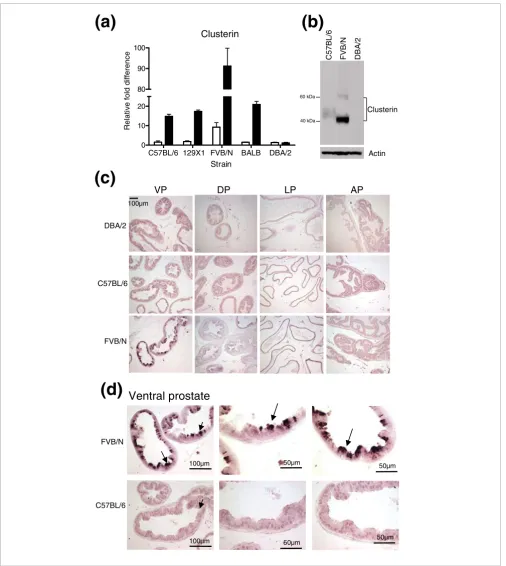
Mmp7, Spb and Clusterin were used to quantify transcripts in the same RNA samples used in the microarray experiments (Figure 3a; Figure 4a for clusterin). We measured transcripts encoding the housekeeping gene encoding ribosomal protein S16 to normalize the qRT-PCR data. From the microarray results, S16 expression did not vary significantly between strains.
Overall, the qRT-PCR transcript measurements for the five genes tested were in good agreement with the microarray data, though the magnitude of relative fold differences in the qRT-PCR assay was greater compared to the microarray results. This observation is partly due to intrinsic limitations in the microarray experimental design, where transcript
lev-els were measured as the ratio between an experimental sam-ple (strain samsam-ple) relative to that for the reference samsam-ple
(pool of all strains). The expression of Mmp7 varied between
5- and 15-fold between strains with the greatest difference observed in a comparison of 129X1/Sv and DBA/2 mice
(Fig-ure 3a). The expression of Psca varied up to 40-fold between
strains and the expression of Clusterin was at least 70-fold
greater in the FVB/N mice relative to any other strain.
Assessments of strain-associated variation in prostate cellular composition and cell type-specific gene expression
We hypothesized that strain-specific disparities in the ratios of cell types within the prostate gland could be reflected as measurable differences in transcript levels. The rodent pros-tate is composed principally of luminal secretory epithelium, basal epithelium, and a stroma consisting primarily of fibrob-lasts and smooth muscle, with a smaller component of endothelium, nerve cells, neuroendocrine cells, and inflam-matory infiltrates. Since our transcript profiling studies were performed using whole prostates containing mixtures of the various cell types, we could not exclude the possibility that differences in gene expression between strains were a result of differences in cell type ratios between strains. To address
this, we performed an ad hoc analysis using two prostates per
strain, and calculated the percentage of prostate area occu-pied by stroma and epithelium for each lobe. Based on the
estimated effect sizes and the corresponding p values, we did
not identify significant strain-associated differences in the ratios of cell types between strains (data not shown).
To further confirm that prostate gene expression differences arise from intrinsic genetic variation and not cell ratio effects, we microdissected secretory epithelium from two strains: C57BL/6 and 129X1/Sv. We measured the transcript levels
for two genes, Sbp and Mmp7, that exhibited
strain-associ-ated differences in the microarray studies. As shown in Figure
3b, transcript levels of Mmp7 and Sbp were four-fold higher
[image:5.612.54.553.117.194.2]and four-fold lower, respectively, in microdissected epithe-lium from 129X1/Sv relative to C57BL/6. These findings are in agreement with the differences in transcript levels observed for these genes in the analyses of whole prostates from these strains (compare Figures 3a and 3b). Together, these results support the conclusion that differences in
Table 1
Pairwise comparisons of mouse prostate gene expression between strains of Mus musculus
Strain C57BL/6 129X1/Sv FVB/N BALB/c DBA/2
129X1/Sv 124* - 88 102 116
FVB/N 237 88 - 172 226
BALB/c 173 102 172 - 196
DBA/2 198 116 226 196
prostate gene expression between strains, at least for the genes independently assessed in microdissected epithelium, represent an intrinsic cellular property rather than possible differences in prostatic cell type ratios between strains. Fur-thermore, the experimental design and microarray methods are capable of identifying transcript abundance differences between strains for genes expressed in a cell type- and
lobe-specific manner (for example, Sbp [18,19]), even when diluted
by mRNAs from all lobes and multiple cell types. However, it is likely that subtle, yet biologically relevant alterations in constituents of the stroma and glandular microenvironment also exist between strains. Identifying these differences will likely require detailed cell type-specific assays.
Strain-associated differences in prostate protein expression
We next sought to determine if strain-associated differences in prostate transcript levels were reflected by concordant dif-ferences in protein expression. We chose to evaluate protein levels of clusterin, which is encoded by a gene studied exten-sively in the context of prostate carcinogenesis and therapy resistance [20-22]. Clusterin, also known as
testosterone-repressed prostate message 2 (TRPM-2), is of particular
interest in view of active efforts to target its expression as a treatment for human prostate cancer [20]. Although the func-tion(s) of clusterin remains somewhat enigmatic, recent stud-ies indicate that antiapoptotic effects are mediated in part through direct interactions with activated Bax [22]. We have previously shown that clusterin expression is increased in
[image:6.612.55.559.84.446.2]Analysis of strain-dependent differences in prostate gene expression by qRT-PCR Figure 3
Analysis of strain-dependent differences in prostate gene expression by qRT-PCR. RNAs from preparations used in the (a) microarray analysis or (b)
microdissected epithelium were reverse transcribed and amplified using qRT-PCR with primers specific for seminal vesicle secretion 2 (Svs2), matrix metallopeptidase 7 (Mmp7), prostate stem cell antigen (Psca) and spermine binding protein (Sbp). Ribosomal protein S16 expression levels were used to normalize qRT-PCR data. Normalized results are expressed relative to the lowest expressing value. Error bars indicate the standard deviation of four biological independent replicates. qRT-PCR for microdissected epithelium is represented by one sample per strain for each gene. White bars denote measurements from the microarray analysis. Black bars denote measurements generated by qRT-PCR from whole prostate. Diagonal lines denote measurements generated by qRT-PCR from microdissected prostate epithelium.
sbp
Bl6 129X FVB C D2 0 2 4 6 8 Strain R e la vi te f o ld d if fer en ce psca
Bl6 129X FVB C D2 0 10 20 30 40 50 60 Strain R e la ti v e fo ld d iffe re n c e mmp7
Bl6 129X FVB C D2 0 5 10 15 20 Strain Rel a ti ve f o ld d if fer e n ce svs2
Bl6 129X FVB C D2 0 100 200 1000 11,000 21,000 80,000 100,000 120,000 Strain R e la ti v e fo ld d iffe re n c e
sbp (LCM)
BL6 129 0 2 4 6 Strain R e la ti v e f o ld d iff e re n c e
mmp7 (LCM)
BL/6 129X 0 2 4 6 Strain R e la ti v e fo ld d iffe re n c e
Array
RT-PCR
LCM RT-PCR
(a)
(b)
BALB DBA/2 C57BL/6 129X1 FVB/N
Psca
Svs2
Mmp7
Sbp
Mmp7 (LCM)
Sbp (LCM)
C57BL/6 129X1 C57BL/6 129X1 BALB DBA/2C57BL/6 129X1 FVB/N
BALB DBA/2
comm
en
t
re
v
ie
w
s
re
ports
refer
e
e
d
re
sear
ch
de
p
o
si
te
d r
e
se
a
rch
interacti
o
ns
inf
o
rmation
tumors developing in mice with a prostate specific deletion of
the Pten tumor suppressor gene [23]. Microarray
hybridization and qRT-PCR quantified clusterin transcripts at levels ten-fold or greater in prostates of FVB/N mice rela-tive to all other strains (Figure 4a). A western blot analysis using ventral prostate protein extracts detected higher clus-terin levels in prostates of the FVB/N strain when compared with DBA/2 and C57BL/6 strains (Figure 4b). We next per-formed immunohistochemistry to determine the cellular localization of clusterin expression. With the exception of the ventral lobe, we did not detect major differences in clusterin expression between mouse strains. However, substantially greater clusterin immunoreactivity was observed in the secre-tory epithelium of the ventral lobe of the FVB/N strain, rela-tive to any other lobe and all other strains. Staining was particularly intense in the apical region of the epithelium, suggesting that the secretory form of clusterin is the predom-inant differentially expressed isoform in FVB/N ventral pros-tate epithelium (Figure 4c,d). Based on these results, we speculate that elevated clusterin levels may contribute to the enhanced rate of prostate tumor development and progres-sion observed in the TRAMP FVB/N genotype.
Biological pathway analysis of mouse prostate gene expression profiles
The substantial number of genes found to be differentially expressed in the prostates of different mouse strains sug-gested that specific groups of genes could share common reg-ulatory mechanisms or participate in particular functional pathways. To address this possibility, we focused on differ-ences between the C57BL/6 strain relative to other strains due to the reduced tumorigenicity observed in transgenic mouse prostate cancer models arising in the C57BL/6 back-ground [14,15,24]. We used a method termed 'gene set test' (GST) in BioConductor that is analogous to the recently described gene set enrichment analysis (GSEA) algorithm [25] to determine if genes displaying relative differences in prostates of C57BL/6 mice were enriched in a database of bio-logically defined gene sets assembled by the Gene Ontology (GO) consortium. Only three of 258 gene sets, NADH dehy-drogenase activity, NADH dehydehy-drogenase (ubiquinone) activity, and phosphoinositide binding were statistically enriched in the C57BL/6 prostates (false discovery rate (FDR)
≤25%). While specific components of these pathways or
net-works could represent modifiers of the cancer phenotype, the results also suggest that influential genetic variation is broadly dispersed across functional biological pathways. This conclusion is tempered by acknowledged limitations to these studies that include the imperfect nature of algorithms used to determine gene enrichment and the fact that transcript measurements do not reflect the complete picture of biologi-cal pathways and networks.
Gene expression variability in the human prostate: correlations with cancer phenotype
Having established that consistent measurable differences in murine prostate gene expression occur in the context of genetic background, we next sought to determine if the orthologous genes were also variable in the human prostate, and whether the underlying normal gene expression levels, potentially representing quantitative traits, associate with aspects of human prostate carcinogenesis. We focused on transcript alterations between the C57BL/6 and FVB/N strains due to experimental evidence demonstrating that for the TRAMP model system of prostate cancer, the C57BL/6 genome delays cancer progression relative to an accelerated rate of carcinogenesis in other strains, including FVB/N [14]. We also focused on transcript differences between the C57BL/6 and BALB/c strains due to a recent report
describ-ing a reduced incidence of prostate adenocarcinomas in Pten
deficient mice of a 129/C57 background relative to high rates
of prostate carcinomas, up to 90% by 6 months, in Pten
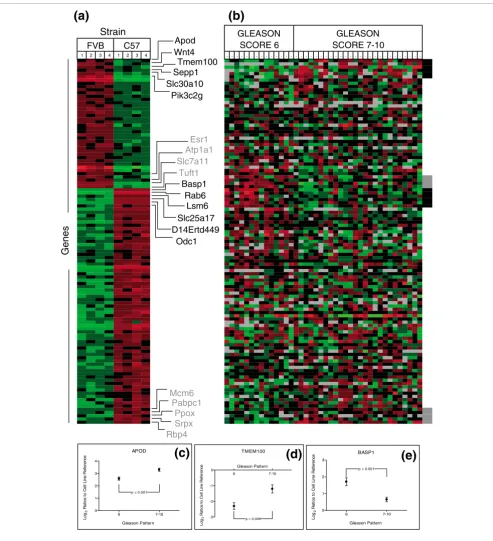
defi-cient mice of a 129/BALB/c background. These studies sug-gest the hypothesis that genes expressed highly in C57BL/6 prostates might function as inhibitors of carcinogenesis whereas genes expressed highly in other strains - relative to C57BL/6 - could function to promote or permit carcinogene-sis. Direct comparisons of transcript abundance levels from prostates of the C57BL/6 strain against FVB/N and C57BL/6 against BALB/c identified 237 and 173 genes with significant differences, respectively (Table 1; Figures 5a and 6a).
We next measured the transcript abundance levels of these variable murine prostate genes in human prostate tissues. Based on the TRAMP mouse model data, we hypothesized that if genes expressed highly in C57BL/6 relative to FVB/N prostates (designated C57-High) retard aspects of carcino-genesis, they would be down-regulated in the prostates of those individuals shown to have aggressive prostate cancers, and if genes expressed highly in FVB/N relative to C57BL/6 prostates (designated C57-Low) promote aspects of carcino-genesis, they would be elevated in the prostates of individuals with aggressive prostate cancers. Similar reasoning was applied to genes differentially expressed between BALB/c and C57BL/6 prostates.
We analyzed data reported by Lapointe et al. [26] that
gener-ated independent gene expression profiles from matched pairs of benign and neoplastic human prostate tissues accom-panied by pathological criteria of tumor aggressiveness according to the Gleason grading system. This human dataset contained orthologs for 113 of the 237 genes with differential expression in C57BL/6 relative to FVB/N prostates, and 91 of the 173 genes with differential expression in C57BL/6 relative to BALB/c prostates. We specifically focused on gene expres-sion in the benign tissue of each human prostate sample as a potential measure of an underlying predisposition to cancer phenotypes reflected by cancer grade: low pathological grade
Clusterin is highly expressed in the FVB/N strain Figure 4
Clusterin is highly expressed in the FVB/N strain. (a) qRT-PCR measurement of Clusterin RNA in prostate preparations used in microarray analysis. White bars are the data from the microarray experiments and black bars are values generated by qRT-PCR. (b) Western blot analysis of clusterin in the ventral prostates of FVB/N, DBA/2 and C57BL/6 mouse strains. Ventral prostate tissue (pool of three ventral prostates per lane/strain) was prepared and equal amounts of protein were resolved by SDS-PAGE and probed with anti-clusterin antibody. Antibody against β-actin was used as a loading control. (c, d)
Immunohistochemical analysis of paraffin sections from dorsal prostate (DP), lateral prostate (LP), anterior prostate (AP) (c) and ventral prostate (VP) lobes (c, d) of 8-9 week old mice from FVB/N, DBA/2 and C57BL/6 strains. Sections were stained with anti-clusterin antibody. Clusterin immunoreactivity is most intense in the apical region of the secretory epithelial cells from the ventral prostate (arrow).
clu
Bl6 129X FVB C D2
0 10 20 80 90 100
Strain
F
o
ld
di
ff
e
re
nc
e
(a)
(b)
(c)
(d)
BALB DBA/2
C57BL/6
DB
A
/2
C5
7BL/
6
FVB/N
DBA/2
C57BL/6
FVB/N
VP DP LP AP
C57BL/6 FVB/N
FVB/N 129X1
Clusterin
60 kDa
40 kDa
Actin Clusterin
Relati
v
e f
o
ld
d
iff
erence
100µm
100µm 50µm
100µm
50µm
50µm 50µm
comm
en
t
re
v
ie
w
s
re
ports
refer
e
e
d
re
sear
ch
de
p
o
si
te
d r
e
se
a
rch
interacti
o
ns
inf
o
rmation
[image:9.612.58.551.84.625.2]Mouse prostate strain-associated gene expression and analysis in human prostate tissues: FVB/N and C57BL/6 Figure 5
Mouse prostate strain-associated gene expression and analysis in human prostate tissues: FVB/N and C57BL/6. (a) Genes differentially expressed in prostates of FVB/N and C57BL/6 strains. Heat map colors reflect fold ratio values between sample and reference pool. Columns 1-4 represent biological replicates for each strain. Rows represent individual genes. Values shown in red are relatively larger than the overall mean; values shown in green are relatively smaller than the overall mean. (b) Transcript abundance levels in benign human prostate tissues associated with high grade (7-10) or low grade (≤6) adenocarcinomas for each gene determined to be altered in mouse strain comparisons where a corresponding ortholog was identified. Genes depected in (a) and (b) are in identical order. Black box (b) and text (a) represent genes with significant differential expression in the human datasets altered in the expected orientation. Gray box (b) and text (a) represent genes with significant differential expression in the human datasets altered in the opposite orientation. (c-e) Transcript alterations for selected genes in benign tissue samples associating with high (Gleason 7-10) and low (Gleason ≤6) prostate cancers. Plots represent the 95% confidence intervals of log2 expression ratios of tissues samples relative to a cell line reference.
1 2 3 4 1 2 3 4 . . . .
GLEASON SCORE 7-10
Strain
FVB C57
GLEASON SCORE 6
(b)
(a)
Sepp1 Slc30a10
Pik3c2g Tmem100
Esr1 Atp1a1 Slc7a11
Basp1 Rab6
Mcm6 Pabpc1
Srpx Rbp4
Ppox
Slc25a17 Lsm6
D14Ertd449 Odc1
Tuft1
APOD
6 7-10
0 1 2 3 4
p = 0.001
Gleason Pattern
Log
2
R
a
ti
os
t
o
C
e
ll
Li
ne
R
e
fe
re
nc
e
TMEM100
6 7-10
-3 -2 -1 0
p = 0.008
Gleason Pattern
Log
2
R
a
tio
s
to
C
e
ll L
in
e
R
e
fe
re
n
c
e
BASP1
6 7-10
0 1 2 3
p < 0.001
Gleason Pattern
Lo
g2
Rat
io
s
t
o
Cel
l L
in
e
Ref
e
re
n
c
e
Gen
e
s
(c)
(d)
(e)
Mouse prostate strain-associated gene expression and analysis in human prostate tissues: BALB/c and C57BL/6 Figure 6
Mouse prostate strain-associated gene expression and analysis in human prostate tissues: BALB/c and C57BL/6. (a) Genes differentially expressed in prostates of BALB/c (BALB) and C57BL/6 (C57) strains. Heat map colors reflect fold ratio values between sample and reference pool. Columns 1-4 represent biological replicates for each strain. Rows represent individual genes. Values shown in red are relatively larger than the overall mean; values shown in green are relatively smaller than the overall mean. (b) Transcript abundance levels in benign human prostate tissues associated with high grade (7-10) or low grade (≤6) adenocarcinomas for each gene determined to be altered in mouse strain comparisons where a corresponding ortholog was identified. Genes depicted in (a) and (b) are in identical order. Black box (b) and text (a) represent genes with significant differential expression in the human datasets altered in the expected orientation. Gray box (b) and text (a) represent genes with significant differential expression in the human datasets altered in the opposite orientation. (c-e) Transcript alterations for selected genes in benign tissue samples associating with high (Gleason 7-10) and low (Gleason ≤6) prostate cancers. Plots represent the 95% confidence intervals of log2 expression ratios of tissues samples relative to a cell line reference.
1 2 3 4 1 2 3 4 . . . .
GLEASON
SCORE 6
GLEASON
SCORE 7-10
BALB
C57
Strain
FBXO3
6 7-10 0.0
0.5 1.0
p = 0.004
Gleason Pattern
Lo
g2
Ra
ti
os
t
o
Ce
ll
Li
ne
Re
fe
re
nc
e RAB6A
6 7-10 0
1 2 3
p = 0.008
Gleason Pattern
Lo
g2
Ra
ti
os
t
o
C
e
ll
Li
ne
Re
fe
re
n
c
e FBP1
6 7-10 0.0
0.5 1.0 1.5
p = 0.007
Gleason Pattern
Lo
g2
Ra
ti
os
t
o
Ce
ll
Li
ne
Re
fe
re
nc
e
(b)
(a)
Gen
e
s
2310016C16Rik
Apip
0610009D07Rik
Tuft1
Slc7a11
E43000
Fbxo3
Acta1
Srpx
Mmp17
Ppox
D14Ertd449e
Rab6
Fbp1
Odc 1
Epha
Wnt4
comm
en
t
re
v
ie
w
s
re
ports
refer
e
e
d
re
sear
ch
de
p
o
si
te
d r
e
se
a
rch
interacti
o
ns
inf
o
rmation
In agreement with this hypothesis, seven genes expressed highly in C57BL/6 prostates were measured at significantly lower levels in prostates with high-grade cancers relative to
prostates with low-grade cancers (for example, BASP1)
(Fig-ure 5b-e).
Six genes expressed relatively highly in FVB/N prostates (for
example, ApoD) exhibited significantly higher transcript
lev-els in the prostates containing high-grade cancers relative to prostates with low-grade cancer (Figure 5). Apolipoprotein D
(APOD) is a member of the lipocalin superfamily of protein
transporters that is implicated in the pathogenesis of neuro-degenerative diseases and is regulated by androgens in both breast and prostate cells [27,28]. Studies of prostate cancer have demonstrated elevated APOD protein levels in prostate intraepithelial neoplasia and prostate carcinoma [29], but
associations between APOD polymorphisms, or APOD
expression in benign epithelium in the context of cancer phe-notypes have not been reported. Two recent studies of the Drosophila ApoD ortholog, GLaz, provide context for the potential influence of ApoD expression on cytoprotection and cell survival [30,31]. Overexpression of Glaz increased resist-ance to stresses that included starvation, hyperoxia and hypoxia, and resulted in the extension of organismal lifespan
[30]. Conversely, loss of GLaz resulted in the reduction of
Drosophila stress resistance and lifespan, consistent with APOD being part of a defense system that is activated in the setting of oxidative stress, or incited by exogenous environ-mental factors or intrinsic events such as aging or neoplasia [31].
Counter to our hypothesis, several genes exhibited significant expression differences inversely associated with the human prostate cancer grade-status predicted by the mouse pheno-types. For example, transcript levels of four C57-Low genes
(for example, Esr1) in benign prostate tissues were
signifi-cantly associated with low-grade cancers and five C57-High
genes (for example, Rbp4) were expressed at greater levels in
benign tissue associated with high-grade relative to low-grade prostate cancers (Figure 5b). Similar results were observed for genes differentially expressed between BALB/c and C57BL/6 prostates when evaluated in benign tissues from prostates with high-grade cancers relative to prostates with low-grade cancers (Figure 6).
One possible explanation for these findings centers on differ-ent tumor initiating mechanisms (and pathways) that subse-quently interact with different intrinsic intracellular and extracellular 'host' gene expression programs. For example, although studies of mouse prostate tumorigenesis demon-strate that the C57 strain appears to reduce tumorigenesis
caused by p53/Rb (TRAMP model) or Pten alterations, the
C57 background increases the development of prostate intraepithelial neoplasia lesions in mice with targeted
dele-tions of the Nkx3.1 homeobox gene [32], and increases
tum-origenesis in the setting of ras+myc expression, relative to
other strains [33]. Thus, the complexities of the interactions between different tumor initiating events and host genomes are likely to be quite complex, a factor that could certainly influence the interpretation of human data where initiating events for any particular primary tumor are poorly defined. As heritable differences provide ample opportunities for mutations in growth control genes to exert differential effects depending upon the inherent wiring of the altered cell or the surrounding micro- and macroenvironment, improved sub-classifications of human prostate tumors that associate with specific oncogenenic events, such as the recently reported TMPRSS2-ERG fusions [34], may assist in defining consist-ent associations. In support of this concept are data demon-strating that a polymorphism in the promoter region of the
MDM2 gene enhances MDM2 expression, attenuates p53
tumor suppressor function and accelerates tumor progres-sion rates of both hereditary and sporadic human cancers arising in the context of p53 alterations [35].
Conclusion
The quantification of tissue gene expression represents a measure of phenotypic variation at the molecular level that can be ascertained as comprehensive profiles reflecting active biological pathways. Exploiting gene expression information as quantitative traits (QTL) has facilitated large-scale efforts to identify genomic loci that contribute to complex pheno-types and diseases [36]. In this study we have found substan-tial reproducible gene expression differences in the murine prostate that associate with genetic background. Large strain-specific differences in tissue gene expression are not unique to the prostate. We have previously demonstrated that tran-script abundance levels in the liver differ between mice of dif-ferent strains [37]. Studies of strain-dependent differences in the development and progression of murine breast carcinoma have delineated gene expression differences in tumors arising in the context of genetic background [8], but it is likely that many of these differences were present in the breast tissues prior to cancer development. Indeed, mouse strains with high- or low-metastatic genotypes are reportedly distinguishable using gene expression measurements from benign breast tissue [38].
Materials and methods
Animal work and RNA preparation
Male mice 7 weeks of age were purchased from the Jackson Laboratory (C57BL/6J, 129X1/SvJ and FVB/NJ) or the Charles River Laboratories (BALB/cAnNCrl and DBA/ 2NCrl), maintained in a barrier facility and cared for in accordance with approved IACUC protocols. Following ship-ment, mice were acclimated to a common temperature, day-night cycle, and diet for 12 days to minimize environmental differences. Twelve mice from each of five strains, C57BL/6J, 129X1/SvJ, FVB/NJ, BALB/cAnNCrl and DBA/2NCrl (abbreviated C57BL/6, 129X1/Sv, BALB/c, FVB/N and DBA/ 2, respectively), were randomized for the day and time of sac-rifice. Following halothane anesthesia, mice were sacrificed by cervical dislocation. Prostates were rapidly excised, and dorsal, lateral, ventral and anterior lobes were separately dis-sected and snap-frozen in liquid nitrogen and stored at -80°C. To control for individual variability [39], the dissected pros-tate lobes from mice of each strain were divided into four pools of three mice each and combined for total RNA isola-tion. Prostate tissues were homogenized using a Polytron and total RNA was isolated using the RNeasy extraction kit (Qia-gen, Valencia, CA). Due to the limited concentration of total RNA obtained, specifically from the lateral lobe, equal
amounts of total RNA (0.7 μg) from each of the four pooled
lobes/strain were combined to produce secondary pools, and amplified with the MessageAmp™ aRNA kit (Ambion, Aus-tin, TX). Amplified RNA from each secondary pool (four pools per strain) was hybridized separately to cDNA microarrays for a total of 4 independent biological replicates per strain (12 mice, 4 pools of 3 mice per strain for a total of 4 microarray experiments per strain; Figure 1). A common reference sam-ple was created by combining equal amounts of RNA from all the samples from all strains.
Probe construction, microarray hybridization and data acquisition
The amplified RNA was used as template for cDNA probe syn-thesis followed by hybridization to a custom mouse prostate cDNA array (mPEDB array) composed of approximately 8,300 genes expressed in the developing and adult mouse prostate [40]. The 20 microarrays used for the experiment were all from the same printing batch. cDNA probes were
made from 2 μg of amplified RNA in a reaction volume of 30
μl containing 170 ng random hexamer primers, 0.2 mM
5-(3-aminoallyl)-2-deoxyuridine-5-triphosphate (amino acid-dUTP; Sigma-Aldrich, St. Louis, MO), 0.3 mM dTTP, 0.5 mM each dATP, dCTP, and dGTP, and 380 units of Superscript II reverse transcriptase (Invitrogen, Carlsbad, CA) incubated at 42°C for 120 minutes. After RNA hydrolysis, purified cDNA was combined with either Cy3 or Cy5 monoreactive fluors (Amersham Pharmacia, Piscataway, NJ) that covalently cou-ple to the cDNA incorporated aminoallyl linker in the pres-ence of 50 mM NaHCO3 (pH 9.0). The coupling reaction was quenched with hydroxylamine and reference and experimen-tal probes were combined, filtered, and competitively
Slides were washed sequentially with 1× saline sodium citrate (SSC)/0.03% sodium dodecyl sulfate (SDS), 1× SSC, 0.2× SSC, 0.05× SSC, and spun dry. To account for dye bias, half of the biological experimental samples per strain were labeled with Cy3 dye and the reference with Cy5 dye, and in the other half the labeling was inversed.
Microarray data collection and analysis
Fluorescent array images were collected for both Cy3 and Cy5 using a GenePix 4000B fluorescent scanner (Axon Instru-ments, Foster City, CA, USA). The image intensity data were gridded and extracted using GenePix Pro 4.1 software. For each array spot, the expression levels of the two fluorophores were obtained by subtracting median background intensity from median foreground intensity. A gene was only consid-ered expressed if the fluorescence intensity of the corre-sponding spot was at least six foreground pixels greater than four standard deviations above background in at least half of the arrays per strain. Array spots not meeting these criteria were designated NA. For each gene, the logarithm base 2 ratios (referred henceforth as log ratios) of the two channels were calculated to quantify the relative expression levels of genes between the experimental and reference samples.
To allow for inter-array comparisons, each array was normal-ized to remove systematic sources of variation. This was accomplished by means of a print-tip-specific intensity-based normalization method [41]. A scatter-plot smoother, which uses robust locally linear fits, was applied to capture the dependence of the log ratios on overall log-spot intensities. The log ratios were normalized by subtracting the fitted val-ues based on the print-tip-specific scatter-plot smoother from the log ratios of experimental and control channels. After nor-malization, spots were removed from further analysis if they had more then 3 NA values or if they were in the lower third quantile of abundance across all 20 arrays.
To identify genes that varied among strains of mice, log2 ratio
measurements were statistically analyzed using the SAM
pro-cedure [42]. A multiclass response t-test was used to
comm
en
t
re
v
ie
w
s
re
ports
refer
e
e
d
re
sear
ch
de
p
o
si
te
d r
e
se
a
rch
interacti
o
ns
inf
o
rmation
Comparisons of mouse prostate and human prostate gene expression for association with tumor phenotypes
To evaluate transcript abundance levels in benign human prostate epithelium that associated with cancer grade or stage, we focused on genes that were differentially expressed between prostates of C57BL/6 and FVB/N, and between C57BL/6 and BALB/c mouse strains. Based on studies of the
TRAMP and Pten prostate cancer models, we designated the
C57BL/6 strain as 'prostate cancer-inhibiting' and the FVB/N and BALB/c strains as 'prostate cancer-permitting'. The SAM algorithm was used to identify the 237 genes differentially expressed between C57BL/6-FVB/N and the 173 genes between C57BL/6-BALB/c strains using a FDR of <5%.
We next investigated whether differences in gene expression patterns of benign prostate tissues adjacent to prostate can-cers were associated with Gleason pattern or patient
out-comes. We evaluated a study by Lapointe et al. [26] that
profiled benign tissues matched with prostate adenocarcino-mas of defined Gleason grades. The data were derived from spotted cDNA microarrays and we normalized the data by fit-ting a print-tip specific Lowess curve to the log-intensity
ver-sus log-ratio plot. Normalized log2 ratio data were filtered to
include clones with orthologs to the Mouse Prostate Expres-sion Database (MPEDB) array. Out of the 237 and 173 genes that were identified as differentially expressed (q-value of <5%) between C57BL/6 and FVB/N, and between C57BL/6 and BALB/c, respectively, 113 and 91 had sufficient
informa-tion to test in the Lapointe et al. data. An unpaired
two-sam-ple t-test was used to determine the association between
expression level in the benign tissue and the corresponding Gleason pattern cancers adjacent to the normal samples. The R-code for this analysis can be found online at the MPEDB website in the supplementary data section [44].
Biological pathway analysis
In order to identify specific biological pathways that exhibit strain specific variation, we utilized the GST method available in BioConductor, an algorithm similar to the GSEA method
reported by Subramanian et al. [25]. Briefly, t-statistics
com-paring the expression levels of genes between the C57BL/6 and all other strains were used as input to the GST algorithm. All other settings were kept at their default status and the pathways were obtained from the GO database [45]. We defined a pathway as showing strain-specific variation if its corresponding FDR was less than 25%.
Microdissection of luminal epithelium
Frozen sections (7 μm) were cut from snap-frozen mouse
prostate glands and immediately fixed in cold 95% ethanol. After fixing, the slides were washed in deionized RNase-free water, stained with Mayer's hematoxylin for 30 seconds, fol-lowed by another water wash. The sections were then dehy-drated with two one-minute washes in 100% followed by two five-minute changes in Xylene. Approximately 4,000 luminal epithelial cells were captured from the ventral, dorsal, lateral
and anterior prostate lobes from 3 independent animals for a total of 12,000 cells per lobe using the Arcturus PixCell II instrument (Arcturus, Mountain View, CA, USA). Digital pho-tos were taken of tissue sections before, during, and after LCM and assessed independently to confirm the cell type-specificity of the captured cells. Total RNA was extracted using the Picopure RNA isolation kit (Arcturus) according to the manufacturer's specifications. The extracted RNA was subjected to two rounds of amplification using the Mes-sageAmpTM aRNA kit (Ambion).
Quantitative RT-PCR
RNA from microdissected epithelium and from preparations used in the microarray analysis were used as template for qRT-PCR. We used 200 ng of amplified RNAs or 20 ug of total RNAs to generate cDNAs. SYBR GREEN real-time PCR was performed as previously described [39]. Primers to ribosomal protein S16 were used to normalize cDNA loading. The
sequences of the primers used in this study were: S16
for-ward, 5'-AGGAGCGATTTGCTGGTGTGGA-3', S16 reverse,
5'-GCTACCAGGCCTTTGAGATGGA-3'; Psca forward,
5'-GCCTGGTAGAGGCTGAGATG-3', Psca reverse,
5'-ATCATCTCCTGGGACTCCTG-3'; Clusterin forward,
5'-TTTATGGACACAGTGGCGGA-3', Clusterin reverse,
5'-GCTTTTCCTGCGGTATTCCTG-3'; Mmp7 forward,
5'-CTGATGATGAGGACGCAGGA-3', Mmp7 reverse,
5'-ATTCATGGGTGGCAGCAAAC-3'; Svs2 forward,
5'-TCA-GAAAGGCCGTCTCAGTT-3', Svs2 reverse,
5'-AGCTGCT-TCGTCACTTCCTC-3'; Sbp forward,
5'-TGGAAACGATGATGATGACC-3', Sbp reverse,
5'-TGTGGA-GATGCAGGACTGAG-3'.
Western blot analysis
Prostates from three animals per strain were rapidly excised, and ventral lobes were separately dissected. Protein extracts were prepared by homogenizing and sonicating each ventral
prostate lobe in 500 μl of T-PER buffer (Pierce
Biotechnol-ogy, Rockford, IL, USA) and a cocktail of protease inhibitors (Roche, Indianapolis, IN, USA). Pooled ventral lobe lysates
(50 μg) were separated by SDS-PAGE followed by western
blot analysis using antibodies recognizing clusterin (M-18, Santa Cruz Biotechnology, Santa Cruz, CA, USA) and actin (I-19, Santa Cruz) at 1:200 and 1:400 dilutions, respectively.
Immunohistochemistry
Formalin-fixed, paraffin-embedded mouse prostate tissue sections were deparaffinized, and endogenous peroxidase
activity was blocked with 3% H2O2 for 5 minutes. Antigen was
oratories) for 30 minutes and visualized using VIP peroxidase substrate (Vector Laboratories). The sections were dehy-drated, and permanently mounted. Species-specific IgG iso-types were added in lieu of primary antibody as controls, and these sections demonstrated no detectable staining. The expression of clusterin was assessed in four independent ani-mals per strain.
Tissue morphometry
To evaluate the percentage of each prostate lobe occupied by stroma, two formalin-fixed, paraffin-embedded prostates per
strain were serially cut to generate 5 μm sections spaced 30
μm apart. Sections were stained with hematoxylin and eosin
and the total tissue areas and stroma areas were separately calculated from each prostate lobe using ImageJ image anal-ysis software [46]. Six measurements were taken from each of the four lobes for each of the five strains. To determine overall differences between strains, we fit the following model:
Yijk = μ + Straini + Lobej + εk
where Yijk is the percentage of stroma area observed from
mouse K, lobe j, strain i.
Data
Microarray data for this study have been deposited in the Gene Expression Omnibus [47] under accession GSE5962.
Acknowledgements
We thank members of the Nelson laboratory for helpful discussions. We thank Barbara Trask for critical review of the manuscript and helpful discus-sions. We thank Sarah Hawley for assistance with statistical analyses. This work was supported by grants from the National Institutes of Health (R01CA078836, U01CA84294, P01CA85859) and the Department of Defense (PC041158).
References
1. Lichtenstein P, Holm NV, Verkasalo PK, Iliadou A, Kaprio J, Kosken-vuo M, Pukkala E, Skytthe A, Hemminki K: Environmental and her-itable factors in the causation of cancer - analyses of cohorts of twins from Sweden, Denmark, and Finland. N Engl J Med 2000, 343:78-85.
2. Hsing AW, Tsao L, Devesa SS: International trends and patterns of prostate cancer incidence and mortality. Int J Cancer 2000,
85:60-67.
3. Emery J, Lucassen A, Murphy M: Common hereditary cancers and implications for primary care. Lancet 2001, 358:56-63. 4. Kattan MW, Stapleton AM, Wheeler TM, Scardino PT: Evaluation
of a nomogram used to predict the pathologic stage of clini-cally localized prostate carcinoma. Cancer 1997, 79:528-537. 5. Partin AW, Yoo J, Carter HB, Pearson JD, Chan DW, Epstein JI,
Walsh PC: The use of prostate specific antigen, clinical stage and Gleason score to predict pathological stage in men with localized prostate cancer [see comments]. J Urol 1993,
150:110-114.
6. Balmain A: Cancer as a complex genetic trait: tumor suscepti-bility in humans and mouse models. Cell 2002, 108:145-152. 7. Tripodis N, Hart AA, Fijneman RJ, Demant P: Complexity of lung
cancer modifiers: mapping of thirty genes and twenty-five interactions in half of the mouse genome. J Natl Cancer Inst 2001, 93:1484-1491.
8. Qiu TH, Chandramouli GV, Hunter KW, Alkharouf NW, Green JE,
tumor virulence in MMTV-PyMT-transgenic mice: correla-tion to human disease. Cancer Res 2004, 64:5973-5981. 9. Nagase H, Mao JH, Balmain A: A subset of skin tumor modifier
loci determines survival time of tumor-bearing mice. Proc Natl Acad Sci USA 1999, 96:15032-15037.
10. Koratkar R, Silverman KA, Pequignot E, Hauck WW, Buchberg AM, Siracusa LD: Analysis of reciprocal congenic lines reveals the C3H/HeJ genome to be highly resistant to ApcMin intestinal tumorigenesis. Genomics 2004, 84:844-852.
11. Asamoto M, Hokaiwado N, Cho YM, Shirai T: Effects of genetic background on prostate and taste bud carcinogenesis due to SV40 T antigen expression under probasin gene promoter control. Carcinogenesis 2002, 23:463-467.
12. Demant P: Cancer susceptibility in the mouse: genetics, biol-ogy and implications for human cancer. Nat Rev Genet 2003,
4:721-734.
13. Hunter K, Welch DR, Liu ET: Genetic background is an impor-tant determinant of metastatic potential. Nat Genet 2003,
34:23-24. author reply 25
14. Gingrich JR, Barrios RJ, Foster BA, Greenberg NM: Pathologic pro-gression of autochthonous prostate cancer in the TRAMP model. Prostate Cancer Prostatic Dis 1999, 2:70-75.
15. Freeman D, Lesche R, Kertesz N, Wang S, Li G, Gao J, Groszer M, Martinez-Diaz H, Rozengurt N, Thomas G, et al.: Genetic back-ground controls tumor development in pten-deficient mice. Cancer Res 2006, 66:6492-6496.
16. Sandberg R, Yasuda R, Pankratz DG, Carter TA, Del Rio JA, Wodicka L, Mayford M, Lockhart DJ, Barlow C: Regional and strain-specific gene expression mapping in the adult mouse brain. Proc Natl Acad Sci USA 2000, 97:11038-11043.
17. Fernandes C, Paya-Cano JL, Sluyter F, D'Souza U, Plomin R, Schalk-wyk LC: Hippocampal gene expression profiling across eight mouse inbred strains: towards understanding the molecular basis for behaviour. Eur J Neurosci 2004, 19:2576-2582.
18. Bhatia-Gaur R, Donjacour AA, Sciavolino PJ, Kim M, Desai N, Young P, Norton CR, Gridley T, Cardiff RD, Cunha GR, et al.: Roles for Nkx3.1 in prostate development and cancer. Genes Dev 1999,
13:966-977.
19. Mills JS, Needham M, Parker MG: Androgen regulated expres-sion of a spermine binding protein gene in mouse ventral prostate. Nucleic Acids Res 1987, 15:7709-7724.
20. Gleave ME, Miyake H, Zellweger T, Chi K, July L, Nelson C, Rennie P:
Use of antisense oligonucleotides targeting the antiapop-totic gene, clusterin/testosterone-repressed prostate mes-sage 2, to enhance androgen sensitivity and chemosensitivity in prostate cancer. Urology 2001, 58:39-49.
21. July LV, Akbari M, Zellweger T, Jones EC, Goldenberg SL, Gleave ME:
Clusterin expression is significantly enhanced in prostate cancer cells following androgen withdrawal therapy. Prostate 2002, 50:179-188.
22. Zhang H, Kim JK, Edwards CA, Xu Z, Taichman R, Wang CY: Clus-terin inhibits apoptosis by interacting with activated Bax. Nat Cell Biol 2005, 7:909-915.
23. Wang S, Gao J, Lei Q, Rozengurt N, Pritchard C, Jiao J, Thomas GV, Li G, Roy-Burman P, Nelson PS, et al.: Prostate-specific deletion of the murine Pten tumor suppressor gene leads to metastatic prostate cancer. Cancer Cell 2003, 4:209-221. 24. Kim MJ, Cardiff RD, Desai N, Banach-Petrosky WA, Parsons R, Shen
MM, Abate-Shen C: Cooperativity of Nkx3.1 and Pten loss of function in a mouse model of prostate carcinogenesis. Proc Natl Acad Sci USA 2002, 99:2884-2889.
25. Subramanian A, Tamayo P, Mootha VK, Mukherjee S, Ebert BL, Gil-lette MA, Paulovich A, Pomeroy SL, Golub TR, Lander ES, Mesirov JP:
Gene set enrichment analysis: a knowledge-based approach for interpreting genome-wide expression profiles. Proc Natl Acad Sci USA 2005, 102:15545-15550.
26. Lapointe J, Li C, Higgins JP, van de Rijn M, Bair E, Montgomery K, Fer-rari M, Egevad L, Rayford W, Bergerheim U, et al.: Gene expression profiling identifies clinically relevant subtypes of prostate cancer. Proc Natl Acad Sci USA 2004, 101:811-816.
27. Simard J, Veilleux R, de Launoit Y, Haagensen DE, Labrie F: Stimula-tion of apolipoprotein D secreStimula-tion by steroids coincides with inhibition of cell proliferation in human LNCaP prostate can-cer cells. Cancer Res 1991, 51:4336-4341.
comm
en
t
re
v
ie
w
s
re
ports
refer
e
e
d
re
sear
ch
de
p
o
si
te
d r
e
se
a
rch
interacti
o
ns
inf
o
rmation
Cancer Res Treat 1992, 23:77-86.
29. Hall RE, Horsfall DJ, Stahl J, Vivekanandan S, Ricciardelli C, Stapleton AM, Scardino PT, Neufing P, Tilley WD: Apolipoprotein-D: a novel cellular marker for HGPIN and prostate cancer. Pros-tate 2004, 58:103-108.
30. Walker DW, Muffat J, Rundel C, Benzer S: Overexpression of a Drosophila homolog of apolipoprotein D leads to increased stress resistance and extended lifespan. Curr Biol 2006,
16:674-679.
31. Sanchez D, Lopez-Arias B, Torroja L, Canal I, Wang X, Bastiani MJ, Ganfornina MD: Loss of glial lazarillo, a homolog of apolipo-protein D, reduces lifespan and stress resistance in Drosophila. Curr Biol 2006, 16:680-686.
32. Kim MJ, Cardiff RD, Desai N, Banach-Petrosky WA, Parsons R, Shen MM, Abate-Shen C: Cooperativity of Nkx3.1 and Pten loss of function in a mouse model of prostate carcinogenesis. Proc Natl Acad Sci USA 2002, 99:2884-2889.
33. Thompson TC, Timme TL, Kadmon D, Park SH, Egawa S, Yoshida K:
Genetic predisposition and mesenchymal-epithelial interactions in ras+myc-induced carcinogenesis in reconsti-tuted mouse prostate. Mol Carcinog 1993, 7:165-179.
34. Tomlins SA, Rhodes DR, Perner S, Dhanasekaran SM, Mehra R, Sun XW, Varambally S, Cao X, Tchinda J, Kuefer R, et al.: Recurrent fusion of TMPRSS2 and ETS transcription factor genes in prostate cancer. Science 2005, 310:644-648.
35. Bond GL, Hu W, Bond EE, Robins H, Lutzker SG, Arva NC, Bargon-etti J, Bartel F, Taubert H, Wuerl P, et al.: A single nucleotide pol-ymorphism in the MDM2 promoter attenuates the p53 tumor suppressor pathway and accelerates tumor formation in humans. Cell 2004, 119:591-602.
36. Schadt EE, Monks SA, Drake TA, Lusis AJ, Che N, Colinayo V, Ruff TG, Milligan SB, Lamb JR, Cavet G, et al.: Genetics of gene expres-sion surveyed in maize, mouse and man. Nature 2003,
422:297-302.
37. Pritchard C, Coil D, Hawley S, Hsu L, Nelson PS: The contributions of normal variation and genetic background to mammalian gene expression. Genome Biol 2006, 7:R26.
38. Yang H, Crawford N, Lukes L, Finney R, Lancaster M, Hunter KW:
Metastasis predictive signature profiles pre-exist in normal tissues. Clin Exp Metastasis 2005, 22:593-603.
39. Pritchard CC, Hsu L, Delrow J, Nelson PS: Project normal: defin-ing normal variance in mouse gene expression. Proc Natl Acad Sci USA 2001, 98:13266-13271.
40. Abbott DE, Pritchard C, Clegg NJ, Ferguson C, Dumpit R, Sikes RA, Nelson PS: Expressed sequence tag profiling identifies devel-opmental and anatomic partitioning of gene expression in the mouse prostate. Genome Biol 2003, 4:R79.
41. Dudoit S, Yang Y, Callow M, Speed T: Technical Report Berkeley, CA: Department of Statistics, University of California at Berkeley; 2000. 42. Tusher VG, Tibshirani R, Chu G: Significance analysis of
micro-arrays applied to the ionizing radiation response. Proc Natl Acad Sci USA 2001, 98:5116-5121.
43. Gentleman RC, Carey VJ, Bates DM, Bolstad B, Dettling M, Dudoit S, Ellis B, Gautier L, Ge Y, Gentry J, et al.: Bioconductor: open soft-ware development for computational biology and bioinformatics. Genome Biol 2004, 5:R80.
44. The Mouse Prostate Expression Database [http:// www.mpedb.org]
45. The Gene Ontology Database [http://www.geneontology.org] 46. Image J Software [http://rsb.info.nih.gov/ij/]