Optimal Location and Sizing of SVC Using Particle Swarm Optimization
Technique.
1,2
Siti Amely Jumaat
1Faculty of Elect. and Engineering,
Universiti Tun Hussein Onn Malaysia, 86400 Parit Raja, Batu Pahat, Johor, Malaysia
2
Ismail Musirin,
3Muhammad Mutadha Othman,
4Hazlie Mokhlis
2Faculty of Electrical Engineering, Universiti Teknologi
MARA Malaysia, 40450 Shah Alam, Selangor, Malaysia
2
[email protected] [email protected]
4Department of Electrical Engineering, Faculty of
engineering, University of Malaya, Kuala Lumpur, Malaysia
Abstract— This paper describes optimal location and sizing of static var compensator (SVC) based on Particle Swarm Optimization for minimization of transmission losses considering cost function. Particle Swarm Optimization (PSO) is population-based stochastic search algorithms approaches as the potential techniques to solving such a problem. For this study, static var compensator (SVC) is chosen as the compensation device. Validation through the implementation on the IEEE 30-bus system indicated that PSO is feasible to achieve the task. The simulation results are compared with those obtained from Evolutionary Programming (EP) technique in the attempt to highlight its merit.
Keywords-component; optimal location; optimal sizing; Particle Swarm Optimization; transmission loss minimization; static var compensator.
I. INTRODUCTION
The FACTS is a concept proposed by N.G. Hingorani [1] a well-known term for higher controllability in power systems by means of power electronics devices. FACTS devices can provide benefits in increasing system transmission capacity and power flow control flexibility and rapidity [2]. Population base, cooperative and competitive stochastic search algorithms are very popular in the recent year in the research area of computational intelligence. PSO algorithm was developed by Kennedy and Eberhart based on the social behaviors of animal swarms (e.g. bird blocks and fish schools) [17]. PSO is also applied for solving various optimization problems in electrical engineering [2, 3, 18-20]. Optimal locations of different types of FACTS devices in the power system has been attempted using different Evolutionary Programming (EP) techniques such as Hybrid Tabu Search and Simulated Annealing (TS/SA), GA, Repetitive Power Flow method (RPF), BA and Fuzzy decision making and PSO. The maximum increase in system loadability is achieved by GA and PSO techniques
with an optimal numbers of five TCSCs devices in the system. In [9], GA and PSO are used to optimize the parameters of TCSC. However, PSO have more advantageous than that of GA. PSO gives a better balanced mechanism and better variation to the global and local exploration abilities. Moreover, it can be applied to solve various optimization problems in power system such as power system stability enhancement and capacitor placement problems [10].This paper presents PSO technique for loss minimization in power system by using SVC. PSO was adopted to optimize the SVCs location and sizing to be installed in power transmission network. The PSO and EP techniques were performed on the IEEE 30-bus system have indicated that the proposed methods are worth in loss minimization scheme.
II. FACTSDEVICE
Flexible AC Transmission Systems (FACTS) devices have several types namely: thyristor controlled static compensator (TCSC), static var compensator (SVC), unified power flow controller (UPFC), static compensator (STATCOM), and thyristor controlled phase shifter transformer (TCPST) [11-12]. The SVC is a shunt type FACTS device defined as a shunt connected static var generator or absorber whose output is adjusted to exchange capacitive or inductive current so as to maintain or control specific parameters of the power system, typically the bus voltage [13]. The SVC can inject or absorb its reactive power (QSVC) at a chosen bus. It injects reactive power into
the system it QSVC < 0 and absorbs reactive power from the
system if QSVC > 0 [14]. The working range of SVC is
between 0MVar and +100MVar [21]. The SVC is modeled as a generator or absorber of reactive power as shown in Figure 1.a. It is modeled as an ideal reactive power injection at bus i, as shown in Figure 1.b. The injected 2011 First International Conference on Informatics and Computational Intelligence
power at bus i is: [15 - 16].
Figure 1.a Block diagram of SVC
Figure 1.b Mathematical model of SVC
III. OPTIMIZATIONSTECHNIQUE
A. Particle Swarm Optimization (PSO)
The PSO provides a population-based search procedure in which individuals called particles and changes their positions. The position of each particle is presented in X-Y plane. Each particle moves to the new position using velocity according to its own experience, called as Pbest.
Gbest is the overall best value obtained so far by any particle
in the population. By time to time, the PSO consists of velocity changes of each particle towards its Pbest and Gbest
[18-19]. Each particle tries to modify its current position and velocity according to the distance between its current position and Pbest, and the current position and Gbest. After
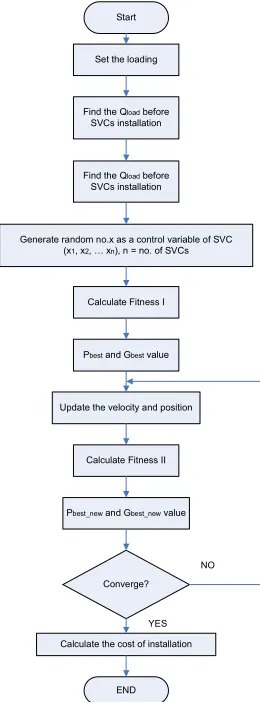
finding the best values the particle updates its velocity and position. Velocity of each particle can be modified. [2,3, 20]. The flowchart of PSO is shown in Figure 2.
B.Evolutionary Programming (EP)
The Evolutionary Programming (EP) is one of the artificial intelligent method is introduction by David B. Fogel in 1960 [21] was inspired from natural selection process to find the global optimum of complex problem [22]. It is evolutionary algorithms are based on computational models of fundamental evolutionary processes such as initialization, mutation, selection and reproduction. In [50], proposed EP to define the optimal
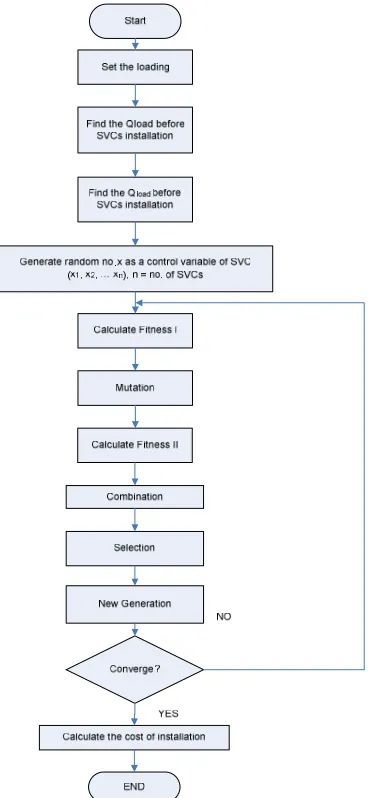
placement of FACTS device for maximization the total transfer capability (TTC) of power system. EP also searches for FACTS parameters, FACTS locations, and the real power generations except the slack bus in power system, the real power loads in sink area and generation bus voltages. In [22] proposed a loss sensitivity approach for placement of Phase Shifter Series Capacitors (PSSC) and Static VAR Compensators. In this research, EP technique was used to optimal the sizing of UPFCs with objective function to minimize the loss and improve the voltage profile. The flowchart of EP is shown in Figure 3.
Start
Set the loading
Find the Qload before SVCs installation
Find the Qload before SVCs installation
Generate random no.x as a control variable of SVC (x1, x2, … xn), n = no. of SVCs
Calculate Fitness I
Pbest and Gbest value
Update the velocity and position
Calculate Fitness II
Pbest_new and Gbest_new value
Converge?
Calculate the cost of installation
END
NO
[image:2.612.114.236.228.293.2]YES
Figure 2: A Flowchart of Particle Swarm Optimization (PSO)
IV. TEST RESULTS
A. Transmission Loss Reduction and Cost of Installation
In order to realize the effectiveness of the proposed PSO technique, the IEEE 30-bus system was tested to find the optimal location and sizing of SVC. The parameters of the optimization algorithm can be referred to [2, 3, 14, 20]. Results for transmission loss reduction when load i.e. buses max
min QSVC Q
Q ≤ ≤
(1)
SVC Q is Q =
26 and 29 are subjected to load variation are tabulated in Table I, and II. The location and sizing of SVC to achieve loss reduction at several loading conditions can be referred to the same table. For instance in Table I with loading condition of 20MVar, the transmission loss has been reduced to 17.5478MW. In order to achieve this, the location of SVC at Bus 26 and the sizing of SVC is 20.1679MVar as indicated in the table. The cost of installation at this scenario is US$1,083,300. From Table II it is observed that the value of transmission losses decrease rapidly and the cost of installation increase accordingly as the reactive power loading increase. Figure 4 shown the cost of installation SVC when load variation on Bus 26.
[image:3.612.325.544.80.432.2]Figure 3: A Flowchart of Evolutionary Programming (EP)
TABLE I: TRANSMISSION LOSS REDUCTION LOAD VARIATION AT BUS 26
Loading SVC
SVC
sizing Loss IC
Condition
location
bus (Mvar) (MW) (US$)
Qd26(Mvar) s1
5 26 6.2032 17.5415
88,284
10 26 10.2864 17.5466
429,440
15 26 16.6998 17.5415
697,340
20 26 20.1679 17.5478
1,083,300
25 26 27.1565 17.5432
1,869,000
30 26 27.9195 17.5919
[image:3.612.102.286.238.637.2]2,916,700
Figure 3: Results for Transmission Loss Reduction at Bus 29
Figure 4: Cost of Installation SVC When Load Variotion at Bus 26
[image:3.612.329.541.451.608.2]The cost of installation at this scenario is US$1,004,800. It is also shown the installation of SVC has significantly reduced the transmission loss in the system at all loading conditions as shown in Figure 5. Figure 6 shown the cost of installation SVC when load variation at Bus 29 is subjected to the system. Result shows that the implementations of PSO have reduced the transmission loss of the system indicating it as a feasible technique to perform optimization process in practical system.
TABLE II: TRANSMISSION LOSS REDUCTION LOAD VARIATION AT BUS 29
Loading SVC SVC sizing Loss IC
Condition
location
(Bus) (Mvar) (MW) (US$)
Qd29(Mvar) s1
5 29 9.0711 17.5591
195,055
10 29 13.0427 17.5577
448,910
15 29 16.6507 17.5635
664,840
20 29 23.7697 17.5582
1,004,800
25 29 27.2707 17.5598
996,490
30 29 32.8218 17.5580
[image:4.612.59.295.207.517.2]2,338,300
Figure 5: Results for Transmission Loss Reduction at Bus 29
B. Comparative Studies with Other Technique.
Comparative studies were conducted with respect to the results obtained using EP. The results are tabulated in Table III - VIII for load subjected to buses 26 and 29.
[image:4.612.315.553.296.407.2]Figure 6: Cost of Installation SVC When Load Variotion at Bus 29
TABLE III: TRANSMISSION LOSS REDUCTION LOAD VARIATION AT BUS 26 PERFORMED USING PSO AND EP.
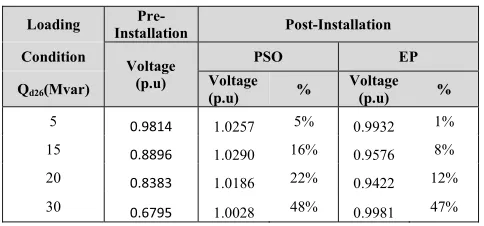
In Table III at loading condition of 15MVar; PSO managed to reduce the transmission loss from 19.0625MW to 17.5415MW (7.98%), while EP managed to reduce the transmission loss to 18.5395MW (2.74%). The same scenarios can be observed as well with 20MVar and 30MVar. It is shown that, PSO technique can be optimizing the transmission loss lower than EP. In Table IV at loading condition 15MVar; PSO managed to increase the voltage profile form 0.8896p.u to 1.0290pu (16%), while EP managed to increase the voltage profile to 0.9576pu (8%). The same scenarios can be observed as well with 20MVar and 30MVar. On other hand, Table V shown the cost of installation FACTS device when load variation at Bus 26. At loading condition of 15MVar; PSO managed the cost of installation FACTS device is US$697,340, while EP managed the cost of installation FACTS device is US$456,960. The cost of installation is related with reduction of reactive power in the system.
Loading
Pre-Installation Post-Installation
Condition
Loss (MW)
PSO EP
Qd26(Mvar)
Loss
(MW) %
Loss
(MW) %
5 17.7175 17.5415 0.99% 17.6625 0.31%
15 19.0625 17.5415 7.98% 18.5395 2.74%
20 20.3393 17.5478 13.72% 19.4151 4.54%
TABLE IV: VOLTAGE PROFILE IMPROVEMENT LOAD VARIOTION AT BUS 26 PERFORMED USING PSO AND EP.
TABLE V: COST OF INSTALLATION FACTS DEVICES LOAD VARIOTION AT BUS 26 PERFORMED USING PSO AND EP.
In Table VI at loading condition of 15MVar; PSO managed to reduce the transmission loss from 18.6839MW to 17.5648MW (5.99%), while EP managed to reduce the transmission loss to 17.5636MW (6%). The same scenarios can be observed as well with 20MVar and 30MVar. It is shown that, Both PSO and EP technique are comparable to optimizing the transmission loss. In Table VII at loading condition 15MVar; PSO managed to increase the voltage profile form 0.9p.u to 1.0412pu (16%), while EP managed to increase the voltage profile to 1.0214pu (13%). The same scenarios can be observed as well with 20MVar and 30MVar. On other hand, Table VII shown the cost of installation FACTS device when load variation at Bus 29. At loading condition of 15MVar; PSO managed the cost of installation FACTS device is US$681,960, while EP managed the cost of installation FACTS device is US$664,840.
IV. CONCLUSION
This paper has presented the application of Particle Swarm Optimization (PSO) and Evolutionary Programming (EP) technique for minimize the transmission loss and monitoring the voltage profile and SVC installation cost. In this study, PSO and EP methods are applied on bus 26 and 29 of IEEE 30-Bus system. From the simulation results demonstrated that the proposed PSO technique is feasible for loss minimization scheme in power system network. However, PSO is superior that EP in terms of loss
minimizations. For the future work, other FACTS devices such as TCSC can be incorporated together to achieve similar task.
TABLE VI: TRANSMISSION LOSS REDUCTION LOAD VARIOTION AT BUS 29 USING PSO AND EP
Loading
Pre-Installation Post-Installation
Condition
Loss (MW)
PSO Loss (MW)
Qd29(Mvar) Loss
(MW) %
Loss
(MW) %
5 17.7284 17.5576 0.96% 17.5591 0.95%
15 18.6839 17.5648 5.99% 17.5635 6.00%
20 19.4699 17.5577 9.82% 17.5582 9.82%
30 22.7158 17.5604 22.70% 17.5580 22.71%
TABLE VII: VOLTAGE PROFILE IMPROVEMENT LOAD VARIOTION AT BUS 29 PERFORMED USING PSO AND EP.
Loading Pre-Installation Post- Installation
Condition
Voltage (p.u)
PSO EP
Qd29(Mvar) Voltage
(p.u) %
Voltage
(p.u) %
5 0.9800 1.0307 5% 1.0296 5%
15 0.9000 1.0412 16% 1.0214 13%
20 0.8582 1.0292 20% 1.0338 20%
30 0.7423 1.0373 40% 1.0283 39%
TABLE VIII: COST OF INSTALLATION FACTS DEVICES LOAD VARIOTION AT BUS 29 PERFORMED USING PSO AND EP.
Loading Post-Installation
Condition PSO EP
Qd29(Mvar) Cost (US$) Cost (US$)
5 $111,170 $195,055
15 $681,960 $664,840
20 $1,000,900 $1,004,800
30 $2,344,900 $2,338,300
REFERENCES
[1] G.Hingorani, “Power electronics in electrical utilities: role of power electronics in future power systems”, in Proc 1988 IEEE, Vol. 76 No, 4 April 1988, pp.481-482. 1988
[2] Saravanan. M, Slochanal. S.M.R, Venkatesh. P, Abraham, P.S, “Applications of PSO Technique for Optimal Location of FACTS Devices Considering System Loadability and Cost of Installation,” in Proc 2005 7th International Power Engineering Conference (IPEC).
Pp. 716 - 721 Vol. 2 2005
[3] G.I.Rashed, H.I.Shaheen, S.J.Cheng, “Optimal Locations and Parameters Settings of Multiple TSCSs for Increasing Power System Loadability Based on GA and PSO techniques, in Proc 2007 Third IEEE International Conference on Natural Computation (ICNC 2007), 2007.
Loading
Pre-Installation Post-Installation
Condition
Voltage (p.u)
PSO EP
Qd26(Mvar)
Voltage
(p.u) %
Voltage
(p.u) %
5 0.9814 1.0257 5% 0.9932 1%
15 0.8896 1.0290 16% 0.9576 8%
20 0.8383 1.0186 22% 0.9422 12%
30 0.6795 1.0028 48% 0.9981 47%
Loading Post-Installation
Condition PSO EP
Qd26(Mvar) Cost (US$) Cost (US$)
5 $88,284 $52,293
15 $697,340 $456,960
20 $1,083,300 $642,250
[4] P.Bhasaputra, and W.Ongsakul, “Optimal Power Flow with Multi-type of FACTS Devices by Hybrid TS/SA Approach,” in Proc. IEEE ICIT’ 02 Bangkok Thailand, 2002.
[5] Idris. R.M, Kharuddin. A, and Mustafa, M.W, “Optimal Choice of FACTS devices for ATC Enhancement Using Bees Algorithm,” in Proc. 2009, Power Engineering Conference, 2009. (AUPEC 2009). Australasian Universities 2009, pp. 1 – 6, 2009.
[6] Phashant Kumar Towari, and Tog Raj Sood, “Optimal Location of FACTS Devices in Power System Using Genetic Algorithm,” in Proc. IEEE World Congress on Nature and Biologically Inspired Computing (NaBIC 2009), 2009.
[7] W. Ongsakul, and P. Jirapong, “Optimal allocations of FACTS devices to enhance total transfer capability using evolutionary programming,” in Proc. International Symposium on Circuits and Systems, Japan, 23-26 May vol. 5 pp. 4175-4178, 2005.
[8] M.M.E. Metwally, A.A. E. Emary, F.M.E.Bendary, and M.I. Mosaad, “Optimal allocations of FACTS devices to enhance total transfer capability using evolutionary programming,” in Proc. Power System Conference, 2008, MEPCON 2008, 12th International Middle –East, pp. 1-4.
[9] S. Panda, and N.P.Padly, “Comparison of particle swarm optimization and genetic algorithm for FACTS-based controller design,” Applied Soft Computing, vol 8, Issue 4, pp. 251-259, Mar. 2007.
[10] S. Chansareewittaya, and P, Jirapong, “Power Transfer Capability Enhancement with Multitype FACTS Controller Using Particle Swarm Optimization,” in Proc IEEE TENCON 2010.
[11] Ismail Musirin, Nur Dianah Mohd Radzi, Muhammad Murtadha Othman, Mohamad Khayat Idris, Titik Khawa Abdul Rahman, “Voltage Profile Improvement Using Unified Power Flow Controller via Articial Immune System”, WSEAS Transaction on Power Systems, Issue 4, Volume 3, April 2008.
[12] Nor Rul Hasma Abdullah, Ismail Musirin, Muhammad Murtadha Othman, “Static VAR Compensator for Minimizing Transmission Loss and Installation Cost Calculation,” Australian Journal of Basic and Applied Sciences, 4(4): 646-657, 2010.
[13] N.G.Hingorani, and L.Gygyi, “Understanding FACTS: Concept and Technology of Flexible AC Transmission Systems,” in Proc. IEEE Press, 2000, p.18. 2000.
[14] S. Auchariyamet, and S.Sirismrannukul, “Optimal Reactive Power Planning with FACTS Devices by Particle Swarm Optimization”, In Proc. 8th International conference on Advances in Power System
Control, Operation and Management (APSCOM 2009),2009, pp. 1 – 6. 2009.
[15] L.J. Cai, I.Erlich, and G.Stamtsis, “Optimal Choice and Allocation of FACTS Devices in Deregulated Electricity Market using Genetic Algorithm”, in Proc. Power Systems Conference and Exposition 2004. (IEEE PES 2004) 2004, pp. 201 - 207 vol.1 2004.
[16] R. D. Zimmermann, and D. Gan, "Matpower a Matlab power system simulation package, User’s Manual’’, Version 2.0, Dec. 1997. [17] J. Kennedy, and R. Eberhart, “Particle Swarm Optimization,” in
Proc. 1995 IEEE International Conf. on Neural Network, vol 4, pp. 1942-1948.
[18] Chansareewittaya. S, and Jirapong, P, “Power Transfer Capability Enhancement with Multitype FACTS Controllers Using Particle Swarm Optimization,” in Proc. 2010 IEEE TENCON Conference 2010, pp 42 - 47E. 2010.
[19] Hashemzadeh. H, and Hosseini. S.H., “Locating Series FACTS Devices Using Line Outage Sensitivity Factors and Particle Swarms
Optimization for Congestion Management,” Power & Energy Society General Meeting, 2009 (PES '09). pp 1-6, 2009.
[20] Sundareswaran. K, Hariharan. B, Parasseri. F.P, Antony. D.S, and Subair, B, “Optimal Placement of Static VAr Compensators (SVC’s) Using Particle Swarm Optimization,” in Proc 2010, International Conference on Power, Control and Embedded Systems (ICPCES), 2010 , pp. 1 – 4, 2010.