Q u a n t u m-d o t b a s e d
n a n o t h e r m o m e t r y in o p ti c al
pl a s m o ni c r e c o r di n g m e d i a
M a r t i n e z M a e s t r o , L, Z h a n g , Q, Xia n g pi n g , L, Ja q u e , D a n d G u, M
h t t p :// dx. d oi.o r g / 1 0 . 1 0 6 3 / 1 . 4 9 0 1 2 5 8
T i t l e
Q u a n t u m-d o t b a s e d n a n o t h e r m o m e t r y in o p ti c al pl a s m o n i c
r e c o r di n g m e d i a
A u t h o r s
M a r ti n e z M a e s t r o , L, Z h a n g , Q, Xia n g pi n g , L, Ja q u e , D a n d
G u , M
Typ e
Ar ticl e
U RL
T hi s v e r si o n is a v ail a bl e a t :
h t t p :// u sir. s alfo r d . a c . u k /i d/ e p ri n t/ 5 3 2 6 0 /
P u b l i s h e d D a t e
2 0 1 4
U S IR is a d i gi t al c oll e c ti o n of t h e r e s e a r c h o u t p u t of t h e U n iv e r si ty of S alfo r d .
W h e r e c o p y ri g h t p e r m i t s , f ull t e x t m a t e r i al h el d i n t h e r e p o si t o r y is m a d e
f r e ely a v ail a bl e o nli n e a n d c a n b e r e a d , d o w nl o a d e d a n d c o pi e d fo r n o
n-c o m m e r n-ci al p r iv a t e s t u d y o r r e s e a r n-c h p u r p o s e s . Pl e a s e n-c h e n-c k t h e m a n u s n-c ri p t
fo r a n y f u r t h e r c o p y ri g h t r e s t r i c ti o n s .
Quantum-dot based nanothermometry in optical plasmonic recording media
Laura Martinez Maestro, , Qiming Zhang, , Xiangping Li, Daniel Jaque, and Min Gu
Citation: Appl. Phys. Lett.105, 181110 (2014); doi: 10.1063/1.4901258 View online: http://dx.doi.org/10.1063/1.4901258
View Table of Contents: http://aip.scitation.org/toc/apl/105/18
Quantum-dot based nanothermometry in optical plasmonic recording media
Laura Martinez Maestro,1,2,a)Qiming Zhang,2,a)Xiangping Li,2Daniel Jaque,1and Min Gu2
1
Fluorescence Imaging Group, Departamento de Fısica de Materiales, Facultad de Ciencias Fısicas, Universidad Autonoma de Madrid, Madrid 28049, Spain
2
Centre for Micro-Photonics, Faculty of Science, Engineering and Technology, Swinburne University of Technology, Hawthorn, Victoria 3122, Australia
(Received 2 October 2014; accepted 27 October 2014; published online 6 November 2014)
We report on the direct experimental determination of the temperature increment caused by laser irradiation in a optical recording media constituted by a polymeric film in which gold nanorods have been incorporated. The incorporation of CdSe quantum dots in the recording media allowed for single beam thermal reading of the on-focus temperature from a simple analysis of the two-photon excited fluorescence of quantum dots. Experimental results have been compared with nu-merical simulations revealing an excellent agreement and opening a promising avenue for further understanding and optimization of optical writing processes and media. VC 2014
AIP Publishing LLC. [http://dx.doi.org/10.1063/1.4901258]
Gold nanorods (hereafter GNRs) are, without doubt, one of the most important building blocks in modern nanopho-tonics because of their unique optical, mechanical, and struc-tural properties.1 Optical properties of GNRs are governed by the presence of the so-called surface plasmon resonances (SPRs) that correspond to a collective motion of surface charges that are induced when GNRs are excited by optical radiation of a given “resonance” wavelength (so-called sur-face plasmon resonance wavelength, denoted bykSPR).kSPR
is settled, among other factors, by the GNR shape and dimensions.2When SPR is optically excited, there is a nificant light-to-GNR energy transfer that could lead to a sig-nificant heating of the GNR itself and, consequently, of its surroundings.3,4Because of their typically large light-to-heat conversion efficiency,5GNRs have received a great attention as photothermal transductors capable, as an example, of effi-cient and non-invasive photothermal therapy of cancer tumors in animal models.6In addition, it has been also dem-onstrated that how light-induced thermal loading of GNRs could be large enough to induce their partial/total melting that could result in an irreversible and drastic light-induced GNR shape change and, consequently, an irreversible change in their optical properties.7Based on this effect, GNRs have been used for the fabrication of optical recording devices.8,9 These are based on an optical recording medium consisting by a transparent polymer containing randomly orientated GNRs. Recording is performed by scanning a modulated and tightly focused laser beam in such a way that its absorption for GNRs of adequate shape and orientation induces a fast and well localized temperature rise in the GNRs.10For suffi-ciently high laser energies, the absorbing GNRs will heat up to above the threshold melting temperature and transform their shapes into shorter rods or spherical particles.8 This results in a well spatially localized population depletion of GNRs with a certain aspect ratio and orientation. Reading was performed by scanning a low power laser beam and measuring, for different polarization and wavelengths, the spatial distribution of the SPR-assisted two photon
luminescence generated by non-melted GNRs. Based on this approach, storage densities as large as 1.1 Tbits/cm3 have been, indeed, demonstrated.10It is crucial to reduce the cross talks in such an approach for high density information stor-age to manipulate the heating up of corresponding GNRs only by their deterministic polarization states and resonance wavelengths. Consequently, full control and future optimiza-tion of the writing parameters require an accurate knowledge of the local temperature increment induced in the recording medium by the laser irradiation. Despite of its interest, there is no, up to know, any work reporting on an experimental determination of the temperatures achieved during laser writ-ing of optical memories. Writwrit-ing parameters have been adjusted in the past accordingly to numerical simulations whose correctness (agreement between simulated and real temperature increment) remains, still, to be checked.11Such a corroboration would require a real time measurement of the laser induced temperature at the focus of the writing laser that is far from being an easy task. A possible approach could be the use of the so-called Luminescence Nanothermometers (LNthMs) that consist on nanoparticles (NPs) that show strongly temperature dependent lumines-cence.12A great variety of luminescent NPs have been dem-onstrated to be capable of high resolution luminescence thermal sensing.13Special mention has to be done to the use of semiconductor quantum dots (QDs) as two-photon excited LNthMs based on the temperature induced spectral shift of their luminescence band.14,15 For the particular case of CdSe-QDs, their luminescence has been found to suffer from a linear red-shift with temperature at a rate close to 0.1 nm/C, this allowing in the past for high resolution ther-mal sensing and imaging in different systems including liv-ing cells and microfluidics.14,16,17Very interestingly, CdSe-QDs are efficiently excited by 800 nm laser pulses, the same used for optical recording. Therefore, CdSe-QD based LNthMs seem to be especially suitable for fluorescence ther-mal sensing in optical recording media by using a single laser beam. Nevertheless, and despite of its potential interest, the use of CdSe-QDs for thermal measurements optical re-cording media has not been attempted up to now.
a)
L. M. Maestro and Q. Zhang contributed equally to this work.
0003-6951/2014/105(18)/181110/5/$30.00 105, 181110-1 VC2014 AIP Publishing LLC
In this work, we have incorporated CdSe-QDs into an optical recording medium consisting of GNR dispersed into a polymer film. The writing laser wavelength (close to 800 nm and matching kSPR) also promotes the two-photon
excitation of the temperature sensitive visible luminescence of CdSe-QDs. This fact has allowed us to determine the on-focus temperature of the optical recording media by using a simple single beam excitation set-up. Experimental results have been compared to numerical simulations. The influence that the polarization state of the laser writing beam polariza-tion has on the thermal loading has been also investigated and discussed.
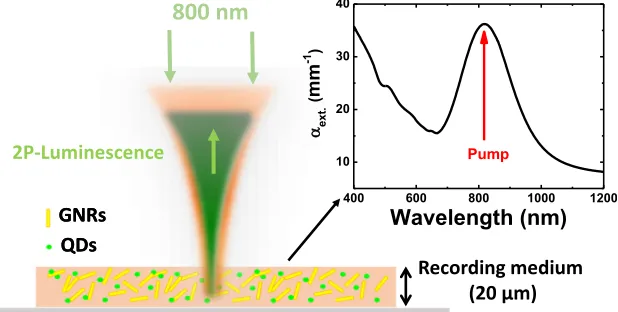
Figure 1 schematically shows the experimental set-up used in this work. The recording medium consists of a thick film of a 20lm thick polyvinyl alcohol (PVA) polymer de-posited on a microscope slide by spin coating.10 As explained in the introduction, optical recording is based on the laser-induced melting of GNRs that were incorporate into the film. In this work, the GNR concentration was set to 72 particles per lm3, this leading to an average distance between adjacent GNRs close to 240 nm. GNRs were synthe-sized by the wet chemical synthesis.18The dimensions of the synthesized GNRs were, on average, 15 nm in width and 45 nm in length. The surface plasmon resonance of the as-synthesized GNRs was found to be centered at 800 nm. This was only slightly modified by the incorporation into the polymer film as can be appreciated in Figure1that includes the extinction coefficient of the optical recording medium used all along this work, denoting the presence of the plas-mon resonance of GNRs at around 800 nm. Optical excita-tion of GNRs was performed by using a 100 fs, 80 MHz mode-locked Ti:sapphire laser tuned to 800 nm that was focused into the recording film by using a 0.75 NA micro-scope objective, leading to a laser spot of 1.3lm in diameter inside the recording media. Although optical recording can be also achieved by using continuous wave lasers, in this work, we decided to use fs laser pulses in order to excite the two-photon fluorescence of CdSe-QDs. Since numerical sim-ulations of laser induced thermal loading in recording media use optical parameters of non-modified GNRs, i.e., describe the pre-melting state, special care was taken to keep laser power well below the “melting limit.” This would ensure a minimal morphological modification of GNRs and, hence, a minimal variation of their optical properties. All along our experiments, laser power was only varied between 1 and 5
mW. For the purpose of thermal sensing, CdSe-QDs were also incorporated into the polymer before film deposition. The concentration of CdSe-QDs was set to be close to 10 particles per lm3, being this a concentration ensuring good signal-to-noise ratio measurements of their fluorescence (required for accurate temperature determination from the analysis of fluorescence band). The two-photon excitation of CdSe-QDs consists of a broad band extending from 700 nm up to 950 nm so that, as commented previously, the 800 nm laser pulses used for plasmonic excitation of GNRs also stimulated the two-photon excited red luminescence of CdSe-QDs.19 This fact is schematically drawn in Figure 1. The CdSe-QD fluorescence was collected by the same microscope objective used for 800 nm laser pulses focusing and was spectrally analyzed by using a high resolution fiber-coupled spectrometer.
Typical fluorescence spectra obtained in our experimen-tal conditions are included in Figure2(a)as obtained for two different 800 nm laser powers. The characteristic broadband emission of CdSe-QDs is clearly observed in both cases with not relevant contribution of the two-photon excited fluores-cence of GNRs that would lead to a broad band extending from 500 nm up to 700 nm, not observed in Figure2(a). Data included in Figure2(a) evidence as a strong dependence of the CdSe-QD luminescence on the 800 nm laser power. When laser power is increased, remarkable red-shift and lu-minescence quenching are found to occur. According to the previous works,15 these two facts are a clear signature of a relevant temperature increment at the 800 nm laser focus inside the optical recording media. The magnitude of such laser induced heating can be, indeed, estimated from a sim-ple spectral analysis of the CdSe-QDs luminescence. In col-loidal solutions, the emission peak of CdSe-QDs suffers from a temperature-induced red-shift at a rate on 0.1 nm/
C,17
[image:4.612.56.365.611.767.2]being this value determined by the combination of sev-eral factors (such as QD thermal expansion and temperature dependence of band gap) that could be modified when CdSe-QDs are embedded in a polymer medium.20QDs have been tested to be reversible and reliable nanothermometers up to temperatures as large as 80C. Thus, the determination of the on-focus temperature from the spectral analysis of the CdSe-QD luminescence requires a previous calibration. This is included in Figure 2(b) in which the CdSe-QD emission wavelength shift is plotted as a function of the optical re-cording media temperature. A clear linear relation is
FIG. 1. Schematic representation of the experimental set-up used in this work for thermal sensing inside optical data storage media. As an inset can be seen, the characteristic extinction spectra corresponding to the GNR based recording media in which CdSe-QDs have been incorporated as nanothermometers.
obtained, this being a desirable feature for thermal sensing purposes as it ensures a constant sensitivity in the whole range. The linear fit of experimental data concludes that the thermal induced spectral shift rate of CdSe-QDs in the poly-mer is 0.11 nm/C, i.e., virtually the same as that previously reported for CdSe-QDs in a colloidal solution.15,17
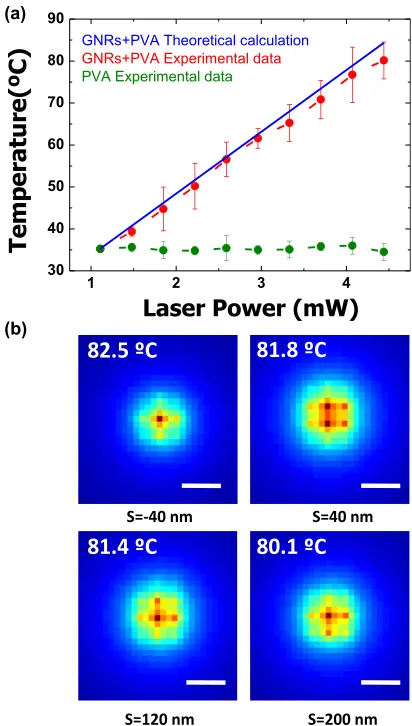
Based on the calibration curve shown in Figure 2(b), it is now possible to determine the 800 nm laser power depend-ence of the on-focus temperature induced inside the record-ing media. For this purpose, the laser power dependence of the peak wavelength was determined and translated into tem-perature units using the linear calibration curve of Figure 2(b). The on-focus temperature experimentally determined for different 800 nm laser powers has been included in Figure 3(a). At this point, several points should be noted. First, the use of a single beam configuration ensures that the measured temperature is that exactly corresponding to the temperature induced by the absorption of GNRs at the focus of the writing laser. Second, the 800 nm beam intensity fol-lows a Gaussian distribution and, consequently, the induced temperature is expected to vary within the laser spot. Since we are also collecting the whole CdSe-QD emission gener-ated from the irradigener-ated spot, the temperature estimgener-ated from the CdSe-QD luminescence and included in Figure3(a) cor-responds to an average temperature over the whole excitation area (1.3lm2). At this point, it should be also noted that de-spite the nanoscale nature of the heating sources (GNRs) we expect, in our experimental conditions, to have a smooth temperature profile at the microscale. According to the for-malism developed by Baffouet al., in our experimental con-ditions, we estimate that for a given GNR, the temperature increment induced by adjacent GNRs is larger than the tem-perature increment caused by the GNR itself.3,21 In these conditions, the measured average temperature would be very close to the actual GNR temperature, the parameter of inter-est in 5D optical recording. In any case, a clear linear rela-tion between the average on-focus temperature increment and the 800 nm laser writing power has been found. Such a linear relation is a clear indicator that, for the laser powers used in this work, non-linear processes (such as contribution of two-photon excitations, laser self-focusing, and irreversi-ble laser induce GNR melting) are not playing a relevant role. Additionally, we have performed the same experiments in a recording film without GNRs, i.e., only containing CdSe-QDs. This sample was treated as a “control” medium in order to check for the possible contribution of the CdSe-QDs nanothermometers to the laser induced thermal loading. Results obtained in this “control medium” have been also
included in Figure3(a). As can be observed, no local heating was noted in this case. This clearly evidences that the contri-bution of CdSe-QDs to the laser induced heating in our re-cording media can be neglected. We should also note that the on focus temperature determined in this work corre-sponds to a “time-average” temperature. Under pulse excita-tion and in some experimental condiexcita-tions, temperature could
FIG. 2. (a) Characteristic two-photon emission spectra obtained from the PVA recording medium and corre-sponding to CdSe-QDs as obtained under high/low laser power (800 nm) excitation. The spectral shift reveals a remarkable increase in the on-focus temperature due to laser induced plas-monic heating. (b) Wavelength shift versus temperature calibration curve of the CdSe-QDs dispersed in the record-ing media.
FIG. 3. (a) On focus temperature induced by the 800 nm laser excitation beam inside the recording media as a function of laser power. Red dots are experimental data, while green correspond to the “control” experiment (in absence of GNRs). The blue line corresponds to data extracted from bi-dimensional simulations. (b) Numerical simulations of the temperature dis-tribution in the surroundings of the 800 nm writing laser as obtained for a laser power of 4 mW. Each pattern corresponds to a different distance between the 800 nm beam axis and the closest GNR (denoted by S). The av-erage temperature obtained in each case is also included. Scale bar is in all the cases 500 nm.
[image:5.612.51.364.56.176.2] [image:5.612.334.540.304.667.2]show relevant time-variations following the laser pulse train.21,22Nevertheless, in our particular case, we have esti-mated a characteristic time for temperature variations in the PVA medium to be close to 10ls.23 This is much longer than the time between consecutive laser pulses (close to 10 ns). Consequently, the temperature inside the laser spot is expected to be steady even though the illumination is pulsed so that the time average (measured) temperature coincides with the instantaneous temperature inside the medium.
Experimental results can be now compared to the nu-merical simulations. Figure3(b)includes the numerical sim-ulations of the temperature distribution in the surroundings of the 800 nm writing laser as obtained for a 800 nm laser power of 4 mW. The simulation method is discussed in our previous publication.24As commented before, in our experi-mental conditions, the averaged distance between GNRs is close to 240 nm, i.e., comparable to the 800 nm beam radius. This means that a discrete/reduced number of GNRs can be found at the laser focus. In these conditions, the distance between GNR and 800 nm laser beam axis could be a critical parameter. In order to check of this possibility, we have explored possible influence of the relative distance between GNR and writing beam axis on the laser induced temperature pattern by performing different numerical simulations in which the position of the 800 nm beam axis and the closest GNR has been varied. Results are summarized in the differ-ent thermal patterns included in Figure3(b). Simulations cor-respond to a 800 nm laser power of 4 mW. For each simulation, the average temperature over the laser irradiated sea has been calculated and it is indicated in each case. It has been found that the relative position between the 800 nm laser axis and the closest GNR has a minimal influence in the calculated average temperature. Indeed, it has been found that the different relative position of GNR assumed in the simulations of Figure3(b) lead to variations in the average temperature not larger than 0.67%. Figure3(a)includes as a solid line the power dependence of the on-focus average temperature increment as obtained from numerical simula-tions by averaging between the results obtained for different position of GNRs inside the laser beam. As can be observed, a quite good agreement between modeling results and exper-imental data has been obtained. This fact fully validates the use of the thermal modeling procedures used in this work for a full understanding and future optimization of the laser writ-ing in optical recordwrit-ing media.
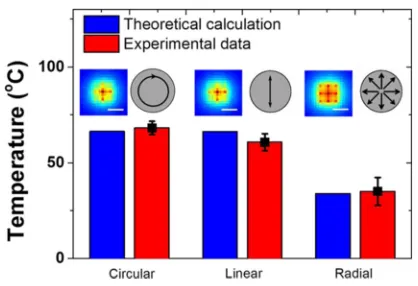
The overall temperature increment within the focal vol-ume can be manipulated by varying the polarization states of the incident illumination. Figure4shows the comparison of the focal temperature measurement between circular, linear, and radial polarization states. The reasonable agreement between experimental and theoretical result further confirms the validity of our model. Among the three employed polar-ization states, the radial polarpolar-ization excitation exhibits the relatively lower temperature rising due to a relative larger spot size, which indicates a less heat accumulation at the same input power of 4 mW during the laser writing process. This result implies the advantage of radial polarization for high density multiplexed optical recording9 by preventing the un-wanted melting of the GNRs away from the determin-istic polarization states. This is of special relevance when
optical recording is based on the combination of radial and azimuthal polarized beams.9
In summary, we have demonstrated that it is possible to monitor, in real time, the temperature of a GNR based optical recording media during laser irradiation by the incorporation of quantum dot luminescent nanothermometers. The ability of 800 nm femtosecond laser pulses for simultaneous excitation of the surface plasmon resonance of GNRs and of the thermal sensitive luminescence of CdSe-QDs allowed for simultaneous local heating and thermal reading of the optical recording me-dium by using a simple single-beam experimental set-up. Experimental data and numerical simulations were found to be in excellent agreement validating in this way previous assump-tions and parameter optimizaassump-tions done on the basis of numeri-cal simulations. The possibility here demonstrated of getting a direct measurement of local temperature during optical record-ing opens excitrecord-ing avenues towards a full understandrecord-ing and further optimization of the optical storage devices.
This work has been supported by the Spanish Ministerio de Inovacion y Competitividad (MAT2010-16161 and MAT2013-47395-C4-1-R). L. M. Maestro thanks the Spanish Ministerio de Economıa y Competitividad (MINECO) for a FPI Grant. Min Gu, Xiangping Li, and Qiming Zhang acknowledge the support from the Australian Research Council (ARC) Laureate Fellowship program (FL100100099). L. M. Maestro acknowledges the ARC Laureate Fellowship project for its support during her study in Swinburne University.
1
X. H. Huang, S. Neretina, and M. A. El-Sayed,Adv. Mater.21(48), 4880 (2009); Y.-Y. Yu, S.-S. Chang, C.-L. Lee, and C. R. C. Wang,J. Phys. Chem. B101(34), 6661 (1997).
2S. Eustis and M. A. El-Sayed,Chem. Soc. Rev.
35(3), 209 (2006); S. Link and M. A. El-Sayed,J. Phys. Chem. B103(40), 8410 (1999).
3
H. H. Richardson, M. T. Carlson, P. J. Tandler, P. Hernandez, and A. O. Govorov,Nano Lett.9(3), 1139 (2009).
4G. Baffou, R. Quidant, and C. Girard,Appl. Phys. Lett.
94(15), 153109 (2009).
5L. M. Maestro, P. Haro-Gonz
[image:6.612.334.543.51.194.2]alez, J. G. Coello, and D. Jaque,Appl. Phys. Lett. 100(20), 201110 (2012); L. M. Maestro, P. Haro-Gonzalez, A. Sanchez-Iglesias, L. M. Liz-Marzan, J. G. Sole, and D. Jaque,Langmuir 30(6), 1650 (2014).
FIG. 4. Experimental and theoretical result of the on focus temperature induced by the 800 nm laser excitation with circular, linear, and radial polar-ization at a power of 4 mW inside the recording media. Inset: Numerical simulations of the temperature distribution in the surroundings of the 800 nm writing laser as obtained for a laser power of 4 mW. Scale bar: 500 nm.
6X. Huang, I. H. El-Sayed, W. Qian, and M. A. El-Sayed,J. Am. Chem. Soc.128(6), 2115 (2006); E. B. Dickerson, E. C. Dreaden, X. H. Huang, I. H. Sayed, H. H. Chu, S. Pushpanketh, J. F. McDonald, and M. A. El-Sayed,Cancer Lett.269(1), 57 (2008); L. Jing-Liang and G. Min,IEEE J. Sel. Top. Quantum Electron.16(4), 989 (2010).
7
M. A. El-Sayed,Acc. Chem. Res.34(4), 257 (2001); S. Link, C. Burda, B. Nikoobakht, and M. A. El-Sayed,J. Phys. Chem. B104(26), 6152 (2000); H. Petrova, J. P. Juste, I. Pastoriza-Santos, G. V. Hartland, and L. M. Liz-Marzan,Phys. Chem. Chem. Phys.8(7), 814 (2006).
8
M. Gu, X. Li, and Y. Cao,Light: Sci. Appl.3, e177 (2014).
9
X. P. Li, T.-H. Lan, C.-H. Tien, and M. Gu, Nat. Commun. 3, 998 (2012).
10P. Zijlstra, J. W. Chon, and M. Gu,Nature
459(7245), 410 (2009).
11
J. Wang, Y. Chen, X. Chen, J. Hao, M. Yan, and M. Qiu,Opt. Express 19(15), 14726 (2011).
12C. D. S. Brites, P. P. Lima, N. J. O. Silva, A. Millan, V. S. Amaral, F.
Palacio, and L. D. Carlos,Nanoscale4(16), 4799 (2012); D. Jaque and F. Vetrone,ibid.4(15), 4301 (2012).
13
F. Vetrone, R. Naccache, A. Zamarron, A. J. de la Fuente, F. Sanz-Rodriguez, L. Martinez Maestro, E. Martin Sanz-Rodriguez, D. Jaque, J. G. Sole, and J. A. Capobianco,ACS Nano4(6), 3254 (2010).
14L. M. Maestro, E. M. Rodriguez, F. S. Rodriguez, M. C. I. la Cruz, A.
Juarranz, R. Naccache, F. Vetrone, D. Jaque, J. A. Capobianco, and J. G. Sole,Nano Lett.10(12), 5109 (2010).
15S. Li, K. Zhang, J. M. Yang, L. W. Lin, and H. Yang,Nano Lett.7(10),
3102 (2007).
16
D. Choudhury, D. Jaque, A. Rodenas, W. T. Ramsay, L. Paterson, and A. K. Kar,Lab Chip12(13), 2414 (2012).
17J.-M. Yang, H. Yang, and L. Lin,ACS Nano5(6), 5067 (2011). 18
B. Nikoobakht and M. A. El-Sayed,Chem. Mater.15(10), 1957 (2003).
19
L. M. Maestro, E. M. Rodriguez, F. Vetrone, R. Naccache, H. L. Ramirez, D. Jaque, J. A. Capobianco, and J. G. Sole, Opt. Express18, 23544 (2010).
20A. Olkhovets, R. C. Hsu, A. Lipovskii, and F. W. Wise,Phys. Rev. Lett. 81(16), 3539 (1998).
21G. Baffou, P. Berto, E. B. Ure~
na, R. Quidant, S. Monneret, J. Polleux, and H. Rigneault,ACS Nano7(8), 6478 (2013).
22G. Baffou and H. Rigneault,Phys. Rev. B
84(3), 035415 (2011).
23
S. Serak, A. Kovalev, A. Agashkov, H. F. Gleeson, S. J. Watson, V. Reshetnyak, and O. Yaroshchuk,Opt. Commun.187(1–3), 235 (2001).
24Md Azim Ullah, Xiangping Li, Xueming Cheng, Xiaojian Hao, Yahui Su,
Jianshe Ma, and Min Gu,Opt. Express20(22), 24516 (2012).