OVERLAPPED
SPEECH
AND
MUSIC
SEGMENTATION
USING
SINGULAR
SPECTRUM
ANALYSIS
AND
RANDOM
FORESTS
Duraid Yehya Mohammed
School of Computing, Science and Engineering
University of Salford, Manchester, UK
Submitted in Partial Fulfilment of the Requirement of
the Degree of Doctor of Philosophy
In the name of Allah, the Gracious, the Merciful.
Alif, Lam, Meem. This is a perfect Book; there is no doubt in it. it is a guid-ance for the righteous; Who believe in the unseen and observe Prayer, and spend out of what We (Allah) have provided for them; and who believe in that which has been revealed to thee [O Muhammad], and that which was revealed before you (all other prophets), and they have firm faith in the Hereafter. Those are upon [right] guidance from their Lord, and it is those who are the successful. (Holy Quran Chapter 2 (Surat Al-Baqara): verses 1:5)
Meanwhile in writing, there is always going to be something that can be improved or
you will catch a mistake in the second, third, or even in the tenth run through, and as
Abdul Raheem Albasanee Quote in the (12th Century):
"I have not seen in this day and age, that a human writes a book in which he sees no
deficiency. He always thinks that if I added such and such or I removed such and such
TABLE OF CONTENTS
1 INTRODUCTION ... 21
1.1 INTRODUCTION ... 21
1.2 THE AIM AND OBJECTIVES OF THE STUDY ... 25
1.3 THE OBJECTIVES ... 25
1.4 THE OUTLINE OF THE THESIS ... 26
1.5 PUBLICATIONS OUTCOME FROM THIS RESEARCH ... 27
1.5.1 Journals and Conferences Papers ... 27
1.5.2 Posters in Published Conferences Proceeding ... 28
2 LITERATURE REVIEW AND BACKGROUND OF AUDIO CLASSIFICATION SYSTEM ... 29
2.1 INTRODUCTION ... 29
2.2 AUDIO CLASSIFICATION SYSTEMS ... 29
2.2.1 Framing ... 32
2.2.2 Feature Extraction ... 33
2.2.3 Machine Learning ... 35
2.3 RELATED WORK ... 37
2.3.1 Music Information Retrieval ... 38
2.3.2 Automated Speech Recognition ... 41
2.4.3 Acoustic Event Detection ... 42
2.3.3 Mixed Audio Classification ... 43
2.3.4 Sound Source Separation ... 46
3 THE COMMON AUDIO FEATURES ... 52
3.1 INTRODUCTION ... 52
3.2 FEATURE EXTRACTION ... 53
3.3 TIME DOMAIN FEATURES ... 55
3.3.1 Zero Crossing Rate (ZCR) ... 55
3.3.2 Root Mean Square (RMS) ... 58
3.3.3 Entropy ... 59
3.4 FREQUENCY DOMAIN FEATURES ... 60
3.4.1 Pitch ... 61
3.4.2 Brightness ... 62
3.4.3 Roughness ... 63
3.4.4 Irregularity ... 64
3.4.5 Spectral Roll-off Frequency ... 65
3.4.6 Spectral Centroid (SC) ... 66
3.4.7 Spectral Spread (SS) ... 68
3.4.8 Spectral Skewness... 69
3.4.9 Mel Frequency Cepstrum Coefficients (MFCC) ... 70
3.4.10 Spectral Entropy ... 71
3.5 SUMMARY ... 73
4 RANDOM FORESTS ... 74
4.1 INTRODUCTION ... 74
4.3 RANDOM FORESTS ... 77
4.3.1 Random Forest Training... 78
4.3.2 Impurity Function... 80
4.3.3 Stopping Criteria ... 82
4.4 SUMMARY ... 84
5 SINGULAR SPECTRUM ANALYSIS METHODOLOGY ... 85
5.1 INTRODUCTION ... 85
5.2 BASIC METHODOLOGY OF SSA ... 86
5.2.1 Embedding ... 88
5.2.2 Lagged-Covariance Matrix ... 91
5.2.3 Singular Value Decomposition (SVD) ... 91
5.2.4 Grouping ... 94
5.2.5 Diagonal Averaging (Reconstruction of the one-dimensional series)... 97
5.3 EXAMPLE OF SSA ... 98
5.4 SUMMARY ... 102
6 SAMPLE COLLECTION AND DATASET ... 103
6.1 INTRODUCTION ... 103
6.2 DATASET ... 103
6.3 MIXER MODEL ... 105
6.3.1 Normalisation Stage: ... 105
6.3.2 Mixing stage ... 106
7 EVALUATION AND EXTENSION OF EXISTING SYSTEM – A CASE STUDY ... 108
7.1 MARSYASEVALUATIONANDEXTENSION... 108
7.1.1 Principles Framework of MARSYAS ... 108
7.1.2 Limitations of MARSYAS ... 110
7.1.3 Proposed Algorithm Framework ... 110
7.1.4 Experimental Setup ... 118
7.1.5 Conclusion and Discussion ... 121
7.2 SPEECH AND MUSIC CLASSIFICATION OF MIXED SOUNDTRACKS USING RANDOM FOREST EVALUATION 122 7.2.1 Audio Features... 122
7.2.2 One Vs All-Classification ... 123
7.2.3 Random Forests Classifier ... 124
7.3 SUMMARY ... 128
8 AUGMENTED AND MODIFIED FEATURES ... 129
8.1 ENTROCY(ENTROPY FREQUENCY) ... 129
8.1.1 EXPERIMENTAL METHOD ... 130
8.1.2 Entrocy Validation ... 133
8.1.3 Entrocy Results and Discussion ... 135
8.2 MEAN CROSSING RATIO (MCR) ... 138
8.3 PEAK VARIANCE RATE (PVR) ... 141
8.4 SPEECH AND MUSIC CLASSIFICATION USING THE AUGMENTED FEATURES ... 143
8.5 SUMMARY ... 144
9.1 INTRODUCTION ... 145
9.2 ADAPTED SSAMETHOD DESCRIPTION ... 145
9.2.1 Window Length Optimization ... 147
9.2.2 Singular Value Decomposition ... 151
9.2.3 Grouping Speech/Music Components ... 152
9.2.4 Reconstructed Signal Classification ... 158
9.3 PRINCIPAL COMPONENTS CLASSIFICATION METHOD ... 159
9.3.1 The Proposed Classification Method ... 161
9.3.2 Principal Components Calculation ... 163
9.3.3 Transformed Feature Space ... 166
9.3.4 Principal Components Classification ... 167
9.3.5 Performance Measure ... 170
9.3.6 The Optimization of The Frame length and SSA Window length ... 171
9.4 SUMMARY ... 172
10 RESULTS AND COMPARISONS ... 174
10.1 OVERALL SYSTEM TESTING ... 174
10.2 RESULTS COMPARISONS ... 177
10.3 EVALUATION OF USABILITY WITH REAL WORKED SAMPLES AND DISCUSSION ... 187
10.3.1 Evaluation OF Usability with Real Worked Samples ... 187
10.3.2 Discussion ... 189
11 CONCLUSION AND FUTURE WORK ... 191
11.2 FUTURE WORK ... 194
REFERENCES ... 196
APPENDIX A: TABLES ... 214
APPENDIX B: AUDIO PRODUCTION LAB ... 216
L
IST OFT
ABLESTABLE 2-1SUMMARY OF PAST APPLICATIONS ... 31
TABLE 2-2LIST INCLUDING MOST PROMINENT MIR SOFTWARE AND TOOLS ... 40
TABLE 7-1BENCHMARKAUDIOMIXINGDATABASE(% OF AMPLITUDE) ... 118
TABLE 7-2SPEECH DETECTION ACCURACY (SDA) OF THE PROPOSED SYSTEM ... 121
TABLE 7-3EXTRACTED FEATURES AND ADOPTED WINDOW FOR EACH CALCULATED FEATURE... 123
TABLE 8-1:SPEECH/MUSIC DISCRIMINATION ERROR RATE, THE RATIO BETWEEN NUMBER OF MISCLASSIFIED FRAMES AND TOTAL NUMBER OF FRAMES N EACH GROUP ... 136
TABLE 8-2:MUSIC DETECTION ERROR RATE, THE RATIO BETWEEN NUMBER OF MISCLASSIFIED FRAMES AND TOTAL NUMBER OF FRAMES IN EACH GROUP ... 136
TABLE 9-1NORMALISED CONFUSION MATRIX FOR THE SPEECH,MUSIC AND MIX CLASSIFICATION TASK (K-FOLD CROSS VALIDATION METHOD, K =10). (NUMBERS IN %)... 171
TABLE 10-1CLASSIFICATION RECALL AND PPV AND UNBALANCED F1SCORE OF METH.1 ... 178
TABLE 10-2CLASSIFICATION RECALL AND PPV AND UNBALANCED F1SCORE OF METH.2 ... 180
TABLE 10-3CLASSIFICATION RECALL AND PPV AND UNBALANCED F1SCORE OF METH.3 ... 181
TABLE 10-4 CLASSIFICATION RECALL AND PPV AND UNBALANCED F1SCORE OF METH.4. ... 183
TABLE 10-5CLASSIFICATION RESULTS OF METH.4 ACCURACY (%) IN TEN FOLDS FOR ALL MIXING RATIOS ... 186
L
IST OFF
IGURESFIGURE 1-1THE CONTENTS OF OVERLAPPED SOUNDTRACKS ... 23
FIGURE 2-1CLASSIFICATION SYSTEM ARCHITECTURE ... 29
FIGURE 2-2MUSIC INFORMATION RETRIEVAL MIRSYSTEM ... 39
FIGURE 2-3THE GENERAL ARCHITECTURE OF AUTOMATED SPEECH RECOGNITION SYSTEM ... 42
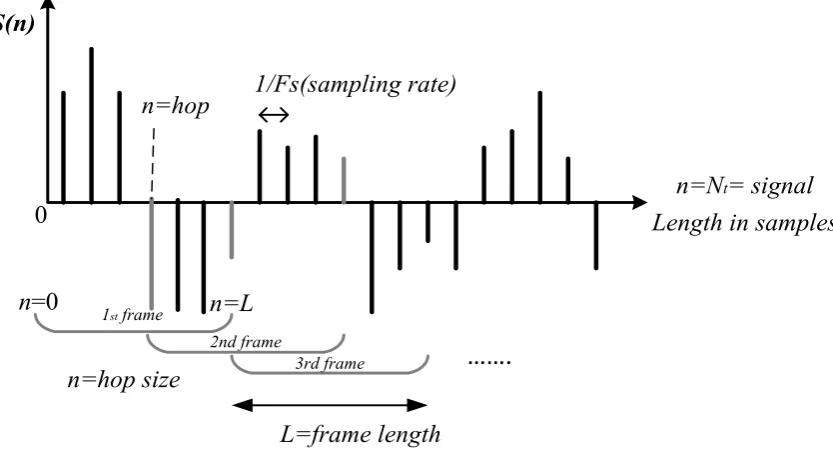
FIGURE 3-1 NOTATIONS FOR AUDIO SIGNAL FRAMING ... 54
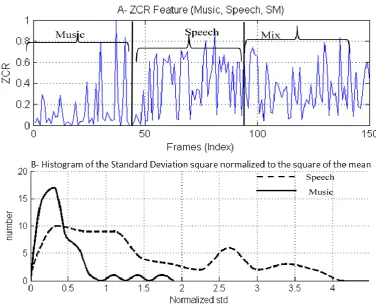
FIGURE 3-2ZCRFEATURE. ... 57
FIGURE 3-3RMSFEATURE VALUE ... 58
FIGURE 3-4ENTROPY FEATURE ... 60
FIGURE 3-5BRIGHTNESS CALCULATION PROCEDURE ... 62
FIGURE 3-6BRIGHTNESS FEATURE ... 63
FIGURE 3-7ROUGHNESS FEATURE ... 64
FIGURE 3-8SPECTRAL IRREGULARITY FEATURE ... 65
FIGURE 3-9SPECTRAL ROLL-OFF FEATURE ... 66
FIGURE 3-10SPECTRAL CENTROID FEATURE ... 67
FIGURE 3-11SPECTRAL SPREAD SSFEATURE. ... 69
FIGURE 3-12SPECTRAL SKEWNESS FEATURE. ... 70
FIGURE 3-13SPECTRAL ENTROPY FEATURE ... 73
FIGURE 4-1 SIMPLE DECISION TREE FOR AUDIO FILE CLASSIFICATION ... 75
FIGURE 4-2 THE DETERMINATION OF HYPERPLANES ... 77
FIGURE 4-3SIMPLE DECISION TREE ARCHITECTURE WITH B-TREES, KI REPRESENTS THE PROBABILITY ... 78
FIGURE 4-5IMPURITY ESTIMATION FUNCTIONS ... 81
FIGURE 5-1SINGULAR SPECTRUM ANALYSIS ALGORITHM ... 87
FIGURE 5-2TRAJECTORY MATRIX PRODUCTION ... 90
FIGURE 5-3DIAGONAL AVERAGING METHOD ... 98
FIGURE 5-4INPUT SINUSOIDAL SIGNAL WITH ADDITIVE NOISE ... 99
FIGURE 5-5SINGULAR SPECTRUM OF TIME SERIES UNDER TEST ... 100
FIGURE 5-6FIRST 6PRINCIPAL COMPONENTS OF TIME SERIES UNDER TEST ... 101
FIGURE 5-7SSA DEMONSTRATION OF RECOVERED SOURCE SIGNAL ... 102
FIGURE 6-1SPEECH MUSIC MIXER MODEL... 105
FIGURE 6-2MIXING ARCHITECTURE OF SPEECH AND MUSIC SAMPLES ... 107
FIGURE 7-1MARSYAS SYSTEM FRAMEWORK ... 109
FIGURE 7-2MARSYAS WITH SPEECH ENHANCEMENTS ALGORITHM FOR NON-EXCLUSIVE AUDIO INDEXING . 113 FIGURE 7-3THE AUDIO CONTENT TIMESTAMP (TOP) BEFORE THE ENHANCEMENT AND (BOTTOM) AFTER THE ENHANCEMENT. ... 118
FIGURE 7-4AUDIO FILE SPECTROGRAM BEFORE AND AFTER ENHANCEMENT ... 120
FIGURE 7-5GENERAL ARCHITECTURE OF THE TRAINING RF PHASE.THE VARIABLE XI REFERS TO FEATURES .. 126
FIGURE 7-6ARCHITECTURE OF THE TESTING PHASE.FEATURE SPACE IS FED AS INPUT TO CLASSIFIER’S MODEL AND THE OUTPUT WILL REPRESENT THE PREDICTED CLASS LABEL. ... 127
FIGURE 8-1ENTROPY SEGMENTATION ... 132
FIGURE 8-2ENTROCY CALCULATION PROCEDURE, M REFERS TO THE NUMBER OF SEGMENTS ... 133
FIGURE 8-3RANDOM FOREST DT, THE VALUE REPRESENTS THE THRESHOLD OF HYPERPLANES WITH RESPECT TO THE FEATURE AXIS ... 134
FIGURE 8-5:ENTROCY ERROR RATE FOR MUSIC DETECTION (S REFERS TO SPEECH,M:MUSIC AND N
REPRESENTS NOISE) ... 137
FIGURE 8-6MCR STATISTICAL FEATURES FOR THE BRIGHTNESS SHORT-TERM FEATURE ... 140
FIGURE 8-7CALCULATION METHOD OF PVRFEATURE ... 141
FIGURE 8-8PVRFEATURE ... 142
FIGURE 8-9TRAINING RF USING AUGMENTED FEATURES SPACE ... 143
FIGURE 9-1MIXED SOUNDTRACK ... 146
FIGURE 9-2GENERAL FLOWCHART OF PROPOSED METHOD (METH.3) FOR MIXED SOUNDTRACK DECOMPOSITION. ... 147
FIGURE 9-3SINGULAR EIGENVALUES OF THE MIXED SAMPLE TIME SERIES FOR VARIOUS WINDOW LENGTHS, 8-160 SAMPLES (TOP) AND 240-464 SAMPLES (BOTTOM). ... 150
FIGURE 9-4FIRST THREE PAIRS OF PC PLOTTED AS TIME SERIES ... 152
FIGURE 9-5THE ESTIMATED SPECTRUM FOR PCS OF SPEECH (TOP), THE ESTIMATED SPECTRUM FOR PCS OF MUSIC (MIDDLE) AND THE ESTIMATED SPECTRUM FOR PCS OF MIXED CLASS (BOTTOM) ... 153
FIGURE 9-6 MATRIX OF W-CORRELATIONS, OF MIXED SOUNDTRACK ... 156
FIGURE 9-7INPUT SIGNAL OF SSA(TOP), CONSTRUCTED TIME SIGNAL CORRESPONDING TO THE FIRST PAIR (MIDDLE SIGNAL) CONSTRUCTED TIME SIGNAL CORRESPONDING TO THE SECOND PAIR (BOTTOM) ... 157
FIGURE 9-8SPECTRUM OF THE ORIGINAL SIGNAL OF SSA(TOP), SPECTRUM OF THE RECONSTRUCTED TIME SIGNAL CORRESPONDING TO THE FIRST PAIR (MIDDLE), RECONSTRUCTED FROM THE SECOND PAIR (BOTTOM) ... 158
FIGURE 9-9SPECTRUM OF THE FIRST TEN PCS OF THE GIVEN SIGNAL ILLUSTRATED IN FIGURE 8-3; THE X-AXIS INDICATES FREQUENCY AND THE Y-AXIS AMPLITUDE... 160
FIGURE 9-10GENERAL ARCHITECTURE OF THE RF TRAINING AND TESTING PHASE FOR PC PREDICTION (METH.4) ... 162
AUDIO FILE PRESENTED IN FIGURE 9-1 ... 163
FIGURE 9-12 THE FIRST THREE PRINCIPAL COMPONENTS WITH THE HIGHEST VARIANCE FOR SPEECH SAMPLES ... 165
FIGURE 9-13 THE FIRST THREE PRINCIPAL COMPONENTS ... 165
FIGURE 9-14PCDC OFFSET REMOVAL ... 166
FIGURE 9-15TRANSFORMED ZCRFEATURE167 FIGURE 9-16 GENERAL ARCHITECTURE OF THE MIXED SOUNDTRACK CLASSIFICATION ... 169
FIGURE 9-17RELATION BETWEEN FRAME SIZE AND SSA WINDOW LENGTH BASED ON THE CLASSIFICATION ACCURACY OF METH.4. ... 172
FIGURE 10-1PERFORMANCE AVERAGE (F1SCORE %) FOR METH.1 ... 179
FIGURE 10-2PERFORMANCE AVERAGE (F1SCORE %) FOR METH.2 ... 180
FIGURE 10-3PERFORMANCE AVERAGE (F1SCORE %) FOR METH.3(DIFFERENT MIXING RATIOS) ... 182
FIGURE 10-4PERFORMANCE AVERAGE % OF EXP4 FOR DIFFERENT MIXING RATIO ... 183
FIGURE 10-5COMPARISON OF BASELINE CLASS. METHOD WITH ALL SUGGESTED AND APPLIED METHODS ... 184
FIGURE 10-6SUGGESTED METHOD COMPARISONS USING NORMALISED STANDARD ERROR FOR UF1 SCORE ... 186
ACKNOWLEDGEMENTS
Foremost, I would like to express my sincere gratitude towards our God (Allah), who is
the all-powerful and all-knowing creator; Allah has bestowed countless blessings upon
us. Some examples of which are, Allah has endowed us with the gifts of sight and he
ar-ing, the intellect, health, wealth and family. Allah has even subjected everything in the
universe for us: the sun, the moon, the heavens and the earth, and many countless things,
as the Qur’an states, “If you tried to number Allah’s blessings, you could never
count them.” (Holy Quran, Surat Al-Maa’idah, 16:18).
Secondly, this thesis epitomises not only my struggle at the writing up, it is an
achieve-ment in more than three years of effort at Salford University and precisely within my
supervisors. My experience at audio signal processing has been nothing less than
ac-ceptable. Since my PhD study starting on October 1st, 2013 I have felt that I have been
given unique chances to work and learn from them and start taken advantage of them.
From the beginning to the end of these years, I have learned to make my interest and
passion in cutting edge research. This study displays the lessons learned in investigate
one of those cutting edge research: this thesis is the result of work by me with my
su-pervisors, who I wish to thank them. Primarily, I wish to thank my consultant, Dr.
Fran-cis Li, my supervisor. He has been inspirational since the first days I started functioning
of the origins tested using the tried and tested method; I remember he used to say
some-thing like "you’re a good researcher and have a good programming skills and need for
more planning and scientific communication!" to encourage me to contact and learn
more from the experience of other researcher and follow the cleverer research approach.
Ever after, Francis has assisted me not just by offering research supervision, but also
road to end this study. Thanks to him, I had the chance to enrich my knowledge. In
conjunction, I wish to thank and highly appreciate Dr. Philip Duncan, my co-supervisor.
He was the man who saved the teamwork, on every hitch and obstacle of every dilemma
or challenge throughout the study journey by means of his professional knowledge in
principles of the digital signal processing and by keep me focusing on the contribution.
He supports me academically and emotionally to crop up with the research theme.
Meanwhile, at the most difficult times when writing this thesis, he gave me the proper
support and the freedom I wanted to progress on. I acknowledge that he provide me
with all support as an expert in digital signal processing. My thesis team or committee
directed and guided me over all the research time and work. Thankfulness to both of
them for being my foremost mentors.
Also indigent of acknowledgement that I am very grateful to my PhD studentship
spon-sorship by the Iraqi government representative by “the Ministry of Higher Education and Scientific Research” which makes this study in this field possible and helped
pro-vide such an educational environment to work in. Furthermore, I would also like to
recognise with much thankfulness the role of all those employees involved in Iraqi
Cul-tural Attaché in London throughout my PhD studies, notably the former and present
Counsellor Attaché (Professor Musa al-Musawi and Professor Hassan Al Alak).
An exceptional appreciation ought to also be given to my fellow post -graduates
(Anugrah Sabdono Sudarsono (Nanoo), Alex Wilson, James F Massaglia, Usman Ali,
Joshua Meggitt, Ahmed Al-Noori, Will Bailey, Omar Eldwaik and Khamis Ahmed and
Nikhilesh Patil) in the room G10/11 and the new postgraduate office for the countless
Outside the sphere of the Newton building there are a few people whose support and
friendship I would like to acknowledge; all my brothers, all my friends back home.
Also, I feel this acknowledgement would not be complete without recognition of
Mu-hammed M. Al-Maathidi, who introduced me to Francis Li and set me on this path. I
also wish to express sincere thanks to my home University, Iraqi University College of
Education for Women, Baghdad, and colleagues for their help and support.
On a more personal note, I thank with love Amel and Abdulrahman, my wife and son.
Considering me most as a Ph.D candidate, Amel herself has been my best friend and
great companion, loved, supported, encouraged, entertained wife and helped me get
through this sustained challenging period of time in the most positive way. Again, I need to write something about my new baby “AFNAN”, who has only seven days old
meantime my writing up to this part from the thesis. Also, I would like to express my
emotional demands that come with caring for a new-born baby and helped me continue
through this distressing period.
Last but not the least, I must thank my parents, who they passed away; and I can’t say
more than Qur’an states, [And lower to them the wing of humility out of mercy
and say, “My Lord! Have mercy on them both as they did care for me when I was little”] (Holy Quran, Surat Al-isrā, 17).
Without their care, consultation, consolation, encouragement and..etc. I would
L
IST OFA
BBREVIATIONS ANDA
CRONYMSAASP Audio and Acoustics Signal Processing challenge
ASR Automated Speech Recognition
CHIL Computers in the Human Interaction Loop
dBs decibels
DT Decision Tree
DFT Discrete Fourier Transform
EEG Electroencephalography
Entrocy ENTROpy frequenCY
FFT Fast Fourier Transform
GMM Gaussian Mixture Model
HMM Hidden Markov Model
MARSYAS Music Analysis, Retrieval and Synthesis for Audio Signals
MCR Mean Crossing Ratio
MCR Mean Crossing Ratio
MFCC Mel-frequency Cepstral Coefficients
MIR Music Information Retrieval
NMF Non-negative Matrix Factorization
OL Office Live
PCs Principal Components
pmf Probability mass function
RFs Random Forests
RMS Root Mean Square
SC Spectral Centroid
SNR Signal to Noise Ratio
SS Spectral Spread
SSA Singular Spectrum Analysis
std Standard deviation
SVM Support Vector Machine
UAR Unweighted Average Recall
VAD Voice Activity Detection
S
YMBOLSOverall annotations: notations and equations are for the most part given in the time
domain, except as otherwise specified. For simplicity and clarity, signals and frames in
the time domain are shown in italics and lowercase, whilst, frequency domain notations
are denoted in italic uppercase. Vector quantities are shown in bold lowercase whilst
matrix quantities are indicated by bold uppercase font. Individual matrix and vector
elements are shown in an italic typeface and their position indicated by subscripts i, j.
Symbol definitions are tabulated below. Symbols used only in passing are not included.
Nt The total length of the given audio signal in a number of samples.
S(k) The audio spectrum calculated for the audio frame.
L The length of the frame (the total number of samples in each frame)
P(k) The squared magnitude audio spec-trum estimated for the S(k) of the au-dio frame.
hop The hop size in samples (the size of win-dow shifting measured in samples).
k The bin index of the frequency. s(n) Audio signal NFT The size of the spectrum.
n Represents the time index of the audio signal samples
Estimated valuef(x) Audio Frame U Eigenvectors matrix
n The time index of the audio frame sample. e Eigenvector
i Theindex of the frame position (1≤ i ≤ L) µ The statistical Average
fe Audio Feature φ The Signal phase
arg max Maximum value in the vector Cx Covariance Matrix
arg min Minimum value in the vector m Number of training samples NF The total number of frames in the audio
signal s(n).
Nof Number of calculated features
Fs Sampling rate λ Eigenvalue
Denotes for all Lambda
R Real number K Number of embedding vectors
A
BSTRACTRecent years have seen ever-increasing volumes of digital media archives and an enormous amount of user-contributed content. As demand for indexing and searching these resources has increased, and new technologies such as multimedia content
man-agement systems, enhanced digital broadcasting, and semantic web have emerged, au-dio information mining and automated metadata generation have received much atten-tion. Manual indexing and metadata tagging are time-consuming and subject to the
bi-ases of individual workers. An automated architecture able to extract information from audio signals, generate content-related text descriptors or metadata, and enable further information mining and searching would be a tangible and valuable solution.
In the field of audio classification, audio signals may be broadly divided into speech or music. Most studies, however, neglect the fact that real audio soundtracks may have
either speech or music, or a combination of the two, and this is considered the major hurdle to achieving high performance in automatic audio classification , since
overlapping can contaminate relevant characteristics and features, causing incorrect
classification or information loss.
This research undertakes an extensive review of the state of the art by outlining the
well-established audio features and machine learning techniques that have been applied
in a broad range of audio segmentation and recognition areas. Audio classification sys-tems and the suggested solutions for the mixed soundtracks problem are presented. The suggested solutions can be listed as follows: developing augmented and modified
fea-tures for recognising audio classes even in the presence of overlaps between them; ro-bust segmentation of a given overlapped soundtrack stream depends on an innovative
of driven classification methods; and finally a technique for continuous time series tasks.
In this study, SSA has been investigated and found to be an efficient way to discriminate speech/music in mixed soundtracks by two different methods, each of which has been
developed and validated in this research. The first method serves to mitigate the overlapping ratio between speech and music in the mixed soundtracks by generating two new soundtracks with a lower level of overlapping. Next, feature space is calculated
for the output audio streams, and these are classified using random forests into either speech or music. One of the distinct characteristics of this method is the separation of the speech/music key features that lead to improve the classification performance.
Nevertheless, that did encounter a few obstructions, including excessively long pro-cessing time, increased storage requirements (each frame symbolised by two outputs),
and this all leads to greater computational load than previously. Meanwhile, the second method employs the SSA technique to decompose a given audio signal into a series of Principal Components (PCs), where each PC corresponds to a particular pattern of
os-cillation. Then, the transformed well-established feature is measured for each PC in order to classify it into either speech or music based on the baseline classification sys-tem using a RF machine learning technique. The classification performance of
real-world soundtracks is effectively improved, which is demonstrated by comparing speech/music recognition using conventional classification methods and the proposed
21
1
I
NTRODUCTION1.1
Introduction
Since the invention of the audio recorder in 1877, of the motion picture camera in 1880,
and of the video recorder in 1951, a great many archives of recorded soundtracks have
come into existence. Over and above this, recent years have seen the archiving of ever
-increasing volumes of digital media, along with an enormous amount of user
-contrib-uted content. Digitisation can preserve the content; however, the usability of the data is
limited if there is no tangible way to search for interesting content from the mass of
data. Such metadata is essential for semantic analysis, indexing, searching, and many
other applications. Manual annotation methods for metadata, i.e. data about the content,
are time-consuming, prone to errors and sometimes biased. Consequently, there is a
pressing need for automated classification, recognition, and information mining of
au-dio content.
There is a considerable body of research that promotes audio content analysis through
recognition of particular audio classes (speech or music) in a mutually exclusive manner
and under specific conditions (e.g. Khonglah and Prasanna, 2016, Eyben, 2016 and
Khaldi et al., 2016). To extract keywords or semantic meaning from soundtracks,
tech-niques such as speech recognition, music information retrieval, and event sound
detec-tion can be employed. Therefore, audio classificadetec-tion is a key pre-processing stage for
automated semantic audio content analysis and metadata generation.
Automatic classification of real-world audio soundtracks into speech and/or music,
when the two sometimes overlap, is a particularly challenging problem. Although it is
re-CHAPTER 1:INTRODUCTION 22
trieval system’s performance, little research has been performed with the aim of
ad-dressing this problem (e.g. Lee and Ellis, 2008, Sell and Clark, 2014, Tomonori et al.,
2008). Zhang and Kuo (2001) presented an approach to annotation based on
segmenta-tion and annotasegmenta-tion of audio data into three main categories, namely components
com-prising silence, those with music, and those without music. Segments falling into each
of the last two categories are then further classified into more components. The Audio
and Acoustics Signal Processing challenge (AASP) (Giannoulis et al., 2013), which is
sponsored by the IEEE Signal Processing Society, is a worldwide competition of
tech-nical innovation to classify real-world scenario signals with and without overlapping
issues. The scope is limited to speech and other indoor/outdoor events; no music has
been included, and its main objective is to detect prominent events and to ignore the
remaining content of the soundtracks. One conclusion drawn from the AASP was that “the task of recognising individual potentially overlapping sounds becomes
signifi-cantly challenging and the performance of systems that are even prepared to deal with
polyphonic content falls dramatically” (Giannoulis et al., 2013). Although the AASP is
about speech and event sounds, the conclusion from this large-scale competition
sug-gests that the technically challenge in handling overlapped audio classes remains
un-solved.
In fact, the literature on audio content analysis has concentrated principally on classical
classification, i.e. categories are logically exclusive, such that an element is assumed to
CHAPTER 1:INTRODUCTION 23
the non-overlap condition. This hinders some attempts to put these techniques to
prac-tical use in audio information mining since a segment of the soundtrack can have either
speech, music, event sounds or any combination thereof, as shown in Figure 1-1.
Figure 1-1 The contents of overlapped soundtracks
There are several effective audio feature and machine learning techniques which have
reported satisfactory performance in recognising a particular class in the controlled
con-dition. However, the overlapped nature of audio content represents the greatest ch
al-lenge for information retrieval systems since it can contaminate the characteristics and
features of the overlapped classes such that they cannot be classified correctly, with a
classical classification method, without losing useful information. In Duncan et al.
(2014) and Mohammed et al. (2015), a new technique has been proposed for
non-exclu-sive classification through using a timestamp with three classifiers, each of which
func-tions as a sensor to detect its respective class even when overlapping takes place.
Con-sequently, the start and end of each class can be determined even when overlapped.
Speech/music cleaning or enhancement algorithms have been suggested as a possible
solution, and several techniques have been proposed in the literature, even though there
CHAPTER 1:INTRODUCTION 24
accomplish speech/music separation with mono channel recording, giving adequate
per-formance without prior knowledge about a given signal. If knowledge of the recorded
voice signal is available, this can help in developing specific spectral
masking/subtrac-tion techniques allowing separamasking/subtrac-tion of the spectral content of the recorded voice in the
time-frequency representation of the mixed signal. However, since real sounds are
com-posed of a comb-pattern of harmonics exponentially spaced in frequency, it remains
almost impossible to resolve the harmonic overlap problem in the mixed signal, which
means that a distortion will inevitably be introduced into the separated signals after
processing. Consequently, mitigating the overlapping between components through
separating them into a number of oscillations with a lower ratio of overlapping and then
classifying them separately is key.
The overall purpose of this study is to investigate the potential of singular spectrum
analysis (SSA), which represents an analysis of time series utilising the singular
spec-trum as an efficient decomposition tool to improve the classification of arbitrary
sound-tracks. It is worth noting here that, with the overlapped nature of the audio content, in
order to correctly determine the target class a new criterion is required. On the other
hand, it is not the purpose of this study to separate the audio sources nor enhance the
components, but rather to determine the contents of each segment of the audio
sound-track. Due to there being a wide range of kinds of acoustic events, with unlimited
char-acteristics, in the world, the scope of the present thesis is limited to speech and music.
The SSA algorithm is used for the classification of mixed soundtracks. The first method
is to adapt existing methods by reducing the degree of overlap between different classes
of audio content, in order to mitigate classification difficulties and improve the
CHAPTER 1:INTRODUCTION 25
mixed soundtrack classification using transformed features extracted using SSA.
Fur-thermore, an augmented and modified feature set has been developed which has the
ability to detect music even when overlapping takes place. This generates a si gnificant
feature set for mixed soundtrack classification. Comparison of classification accuracy,
specificity, and sensitivity against those of another state of the art method is made. The
performance shows promise.
Classification accuracy was also compared with existing baseline classification
meth-ods; the developed algorithm has outperformed other methods based on results
pub-lished in the literature.
1.2
The Aim and Objectives of the Study
The aim of this study is to develop an automatic classification of overlapped
sound-tracks using an SSA algorithm. In other words, the aim is to investigate the capabilities of Singular Spectrum Analysis in overlapped soundtrack classification. “Can SSA be
effectively used to mitigate the classification difficulties associated with overlapping
between ingredients of mixed sounds and then improve the performance of automatic
classification?” is the research question.
1.3
The objectives
The objectives of this study may be more specifically stated as
To carry out a detailed literature and background study.
To generate and prepare a suitable dataset to conduct an experimental study of the
suggested methods in this thesis.
To evaluate, interpret, and justify the existing classification method.
To study and clarify the SSA technique as a widespread method for noise
CHAPTER 1:INTRODUCTION 26
To develop an SSA-based novel method for overlapped soundtrack classification;
this is accomplished by two different methods and through a number of processes.
To evaluate the usability of the SSA method with regard to real worked mixed
samples.
To identify the limitations of the method developed through this study and suggest
future work.
1.4
The outline of the Thesis
This thesis is organised as follows: Chapter 1 gives a general introduction. Chapter 2
presents a literature review of most of the relevant work, including the current state of
the art in the audio information retrieval, in which content classification is typically
used as a pre-processing stage. Chapter 3 investigates the anatomy of the feature space,
the computation of the common features in the literature, and general comparisons
be-tween speech and music characteristics. Chapter 4 reviews machine-learning models for
audio classification and highlights the Random Forests (RFs) and Decision Tree (DT)
algorithms to be adopted in this thesis. Chapter 5 gives a general demonstration of the
applied datasets and the generation of mixed soundtracks. Chapter 6 proposes a
multi-iterative algorithm using MARSYAS (Music Information Retrieval and SYnthesis
Sys-tem) with a method employing spectral subtraction algorithms for non-exclusive
clas-sification. Chapter 7 demonstrates set of newly developed features. Chapter 8 provides
a brief description of the methodology of Singular Spectrum Analysis and its
applica-tion, and gives an example. Chapter 9 describes the proposed methods using the
Singu-lar Spectrum Analysis methodology for overlapped soundtrack classification. It also
explains a bespoke method, parameters, decomposition, and classification for PCs
cor-responding to soundtracks through transformed features calculation. Chapter 10 reports
CHAPTER 1:INTRODUCTION 27
explanation of the usability of the proposed methods with SSA with real-worked
sound-tracks. Finally, Chapter 12 summarizes the present work, draws the conclusions and
limitations of this study, and suggests future work.
1.5
Publications Outcome from this Research
1.5.1
Journals and Conferences Papers
1. Duncan, P., Mohammed D., and Li F., 2014. "Audio Information
Mining–Prag-matic Review, Outlook, and A Universal Open Architecture" Audio Engineering
Society Convention 136, Berlin, Germany, 24 April. Audio Engineering Society
AES, p. 9075.
2. MOHAMMED, D., DUNCAN, P., AL-MAATHIDI, M. M. & LI, F. F. 2015. “A
System for Semantic Information Extraction from Mixed Soundtracks Deploying
MARSYAS Framework”. 13th International Conference on Industrial Informatics INDIN Cambridge, UK: IEEE.
3. Mohammed, D.Y., Duncan, P.J. and Li, F. F., “Audio information extraction from
arbitrary sound recordings”, in: 22nd International Congress on Sound and
Vi-bration (ICSV22), 12th - 16th July, Florence, Italy.
4. Mohammed, D.Y., Duncan, P.J. and Li, FF, “Audio Content Analysis in The
Pres-ence of Overlapped Classes- A Non-Exclusive Segmentation Approach to
Miti-gate Information Losses”, Global Summit and Expo on Multimedia &
Applica-tions August 10-11, 2015 Birmingham, West Midlands, UK.
5. Mohammed, D. Y., Li, F. F., “Overlapped Soundtracks Segmentation: a Singular
Spectrum Analysis and Random Forests Approach”, Accepted in IEEE ICKEA
CHAPTER 1:INTRODUCTION 28
6. Mohammed, Duraid, Li, Francis; “Overlapped Soundtracks Classification Using
Singular Spectrum Analysis and Random Forests”, submitted to IEEE Access
journal 12th-Jun-2017.
7. Mohammed et al.., 2016. “The Extraction of Semantic information from Arbitrary
Audio Soundtracks Recording”, Proceedings of the CSE 2016 Annual PGR
Sym-posium (CSE-PGSym 16).
1.5.2
Posters in Published Conferences Proceeding
1. MOHAMMED, D. Y., DUNCAN, P. J.& LI, F. F. 18th June 2014, Poster-Dean
Showcase, Salford University, Manchester, Uk, “Audio information Mining,
Pro-grammatic review” and won the prize for the best poster.
2. MOHAMMED, D. Y., DUNCAN, P. J.& LI, F. F. 2015 , “Audio information
Mining for arbitrary soundtracks recordings”, Poster-Dean Showcase, Salford
University, Manchester, Uk, 28 June 2015.
3. Furthermore, Build the suggested UOA (Universal Open Architecture) system
toolbox and participate in the university fellowship. The toolbox won the second
round of Innovation fellowship.
4. MOHAMMED, D. Y., DUNCAN, P. J. & LI, F. F., 2016, “A System for Semantic
Information Extraction from Mixed Soundtracks Deploying MARSYAS
29
2
L
ITERATURER
EVIEW ANDB
ACKGROUND OFA
UDIOC
LAS-SIFICATION
S
YSTEM2.1
Introduction
In the present chapter, the current state of the art in the field of Audio Content
Classi-fication is highlighted. There are many papers related to this field. Exhaustive review
of all the related papers is not the intention, only some major milestones and those upon
which subsequent work in the thesis is built are listed. The chapter is organised as
fol-lows. In section 2.2 work related to this study is discussed. Section 2.3 presents a
liter-ature review from the point of view of audio classification architecture including
pre-processing steps (framing, frame size selection, and windowing), feature extraction and
machine learning techniques.
2.2
Audio Classification Systems
Audio classification systems analyse the given audio signal and generate labels that describe the signal. These labels are used to characterise the target class’s segments in
accordance with the classification system. Figure 2-1 exhibits the common architecture
of the classification systems.
Dataset
Features
Extraction
Classifier
Features
Pattern
decision
Figure 2-1 Classification system Architecture
The categorization/classification can be done on the basis of three stages: at the
CHAPTER 2:INTRODUCTION 30
classification system processes each of these frames separately to classify i t into one of
the classes as above. Furthermore, normalisation and windowing are significant
pro-cesses for bringing the input frame to the normative of the classification form; this will
be explained in more detail later on in this study. Sets of time domain, frequency
do-main, and time-frequency domain features are extracted and used for data reduction and
characterization of audio content. The most common and successful features, identified
through the literature review, are selected in this study for real-world audio
classifica-tion. In addition, a modified feature is developed to complement the other features in
the classification process. The final stage is the machine learning technique, which is
used to tackle recognition or classification problems with audio samples (Bishop, 2006).
The common aim of pattern recognition algorithms is learning and generalisation. In
other words, the classifier acquires certain rules from training data which are generally
suitable for solving all similar problems despite their having a different dataset.
In general, audio content analysis refers to extraction and retrieval of information from
audio content that depends on the extracted features. In this study, real-world audio
signal classification, with some emphasis on the overlapping of the speech/music
clas-ses, has been carried out.
The adoption and development of classification methods are typically application
-driven. During the past decades, many bespoke segmentation and classification systems
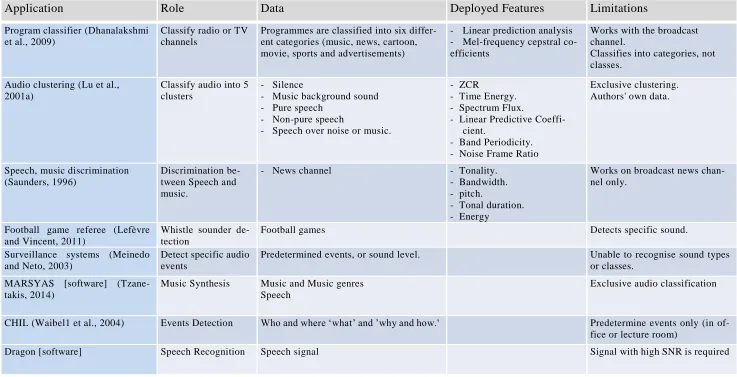
have been implemented; Table (2-1) lists a number of bespoke systems for audio
Table 2-1 Summary of Past Applications
Application Role Data Deployed Features Limitations
Program classifier (Dhanalakshmi et al., 2009)
Classify radio or TV channels
Programmes are classified into six differ-ent categories (music, news, cartoon, movie, sports and advertisements)
- Linear prediction analysis - Mel-frequency cepstral co-efficients
Works with the broadcast channel.
Classifies into categories, not classes.
Audio clustering (Lu et al., 2001a)
Classify audio into 5 clusters
- Silence
- Music background sound - Pure speech
- Non-pure speech
- Speech over noise or music.
- ZCR
- Time Energy. - Spectrum Flux.
- Linear Predictive Coeffi-cient.
- Band Periodicity. - Noise Frame Ratio
Exclusive clustering. Authors' own data.
Speech, music discrimination (Saunders, 1996)
Discrimination be-tween Speech and music.
- News channel - Tonality.
- Bandwidth. - pitch.
- Tonal duration. - Energy
Works on broadcast news chan-nel only.
Football game referee (Lefèvre and Vincent, 2011)
Whistle sounder de-tection
Football games Detects specific sound.
Surveillance systems (Meinedo and Neto, 2003)
Detect specific audio events
Predetermined events, or sound level. Unable to recognise sound types or classes.
MARSYAS [software] (Tzane-takis, 2014)
Music Synthesis Music and Music genres Speech
Exclusive audio classification
CHIL (Waibel1 et al., 2004) Events Detection Who and where ‘what’ and ’why and how.' Predetermine events only (in of-fice or lecture room)
CHAPTER 2:LITERATURE REVIEW AND BACKGROUND OF AUDIO CLASSIFICATION SYSTEM 32
2.2.1
Framing
Traditionally, the audio file is partitioned using a time window into a series of
consec-utive analytical frames of limited length, with or without overlapping. Many research
studies have shown that, in general, frame sizes in the range 10-40 ms are appropriate,
some examples of which are Huang and Hansen (2006), Wang et al. (2000), Kim et al.
(2005). Others, such as Saunders (1996), Scheirer and Slaney (1997) have used a longer
window with fixed size up to 2.4 s, and their research achieved a high accuracy rate
when discriminating speech from music on a broadcast news channel. In fact, this makes
it possible to look at state transition processes over consecutive frames. In particular,
each 2.4 s window (or segment) contained 150 non-overlapped frames. The
experi-mental results gave a 98% success rate (Scheirer and Slaney, 1997), distinguishing
mu-sic from speech with an error rate of 5.8% when using frame by frame parsing and 1.4%
when the window size of 2.4s was used.
Lu et al. (2001b) provide a different scenario for audio classification, classifying audio
through its contents into five classes (silence, music background sound, pure speech
and non-pure speech (speech over noise or music)) by Support Vector Machine (SVM).
The audio file was segmented into one-second segments, and each of these segments
was subdivided into non-overlapping frames of 25 ms before classifying these segments
into one of the above five classes. This work depended on the extraction of two sets of
features. The first set consists of Mel Frequency Cepstrum Coefficients (MFCCs) and
the second set comprises perceptual features including short time energy, Zero Crossing
Rates (ZCR), sub-band power distribution, brightness, bandwidth and pitched ratio
(ratio between the number of pitched frames and the total number of frames in a
sub-clip), spectrum flux, linear spectrum pair, and band periodicity. In addition to these two
CHAPTER 2:LITERATURE REVIEW AND BACKGROUND OF AUDIO CLASSIFICATION SYSTEM 33
frames within each 1-second segment were also computed and used. Energy information
is employed at the beginning of the algorithm to discriminate between silence and non
-silence. At the next stage the non-silence is further divided into the last four classes,
which are detected using 3 SVMs as follows: SVM1 divides non-silence into with
speech and without speech; SVM2 splits the speech clip into non-pure speech and pure
speech; and SVM3 divides without speech clips into background sounds and music.
This seems to suggest that zooming in signal processing and analysis, and the combined
use of both short-term analytical frames and slightly longer-term segments are
particu-larly beneficial. Typically, if the frame length is too short then it will not have enough
samples to obtain reliable spectral information, and if it is much longer, then the signal
will change significantly throughout the frame.
Also, the window function is used to reduce the edge effect of the framing. There are a
number of window types, one of the most popular being the Hanning window, which is
used for general purpose applications because of its low spectral leakage (low distortion
and the ability to recover the original signal from the converted one is high), with the
trade-off being a slightly decreased resolution (widening of the main lobe) (Harris,
1978). In this work, the Hanning window has been used as a filter window to reduce the
edge discontinuities (Kim et al., 2005).
2.2.2
Feature Extraction
Feature extraction involves processing the segmented audio data to generate statistically
significant observations and other salient information, and is essentially a form of data
reduction. Commonly used features are frequency domain and time domain statistics.
Time-frequency domain approaches are becoming increasingly popular (Kos et al.,
CHAPTER 2:LITERATURE REVIEW AND BACKGROUND OF AUDIO CLASSIFICATION SYSTEM 34
A survey of comprehensive research concerning feature extraction can be found in Shao
et al., 2003 and MITROVIC et al., 2010, including taxonomy tables of more than 73
parameters that can effectively represent audio features in a diverse variety of ways.
Features are usually extracted from overlapped frames (each frame includes a number
of samples). The section above lists a number of researchers who tested different frame
sizes in their research; they show the effects of the frame’s size on the results.
Gianna-kopoulos (2009) extracted a set of raw and statistical features from 100 ms frames
with-out overlapping for harm detection (violent sound detection e.g. gun sound, screaming
and so on) in audio content. The final decision is made on the basis of the statistical
features (standard deviation, mean, median).
For speech/music discrimination, Sell and Clark (2014) derived new features from the
Chroma vector based on the musical tonality. Kos et al. (2013) proposed a new set of
features (Energy Variance of Filter Bank) for speech/non-speech segmentation. Kos
mentioned that the newly developed set of features could be deployed as a discriminator
between speech and music with efficient results. Gaussian Mixture Model GMM has
been used for evaluation of proposed features. For the same classification purpose ,
Khonglah and Prasanna (2016) investigate the behaviour of two different feature sets.
The first set is related to the excitation source and contains the normalised
autocorrela-tion peak strength of zero frequency filtered signal and the peak-to-side lobe ratio of
the Hilbert envelope of the linear prediction residual. The second set denotes the vocal
tract system and syllabic rate of speech and includes the log mel energy feature, which
represents the vocal tract information. The modulation spectrum represents the slowly
varying temporal envelope. Khonglah states that the proposed sets of feat ures provide
additional improvements in speech/ music discrimination when combined with existing
CHAPTER 2:LITERATURE REVIEW AND BACKGROUND OF AUDIO CLASSIFICATION SYSTEM 35
deployed for evaluation purposes.
Tzanetakis and Cook (1999a) implemented a real-time speech/music discrimination
sys-tem with some emphasis on music retrieval, called MARSYAS (Music Analysis,
Re-trieval and SYnthesis for Audio Signals). The MARSYAS system provides high
accu-racy through applying several features (Spectral centroid, Spectral flux, Pitch, MFCC,
Zero crossings Rate (ZCR), Root Mean Square (RMS), Spectral roll-off) with some
statistical computations. The comparison is made between two groups of features for
classifying audio files into the following audio classes (speech, noise, crowd noise, and
music genres (popular music, classical music (Jazz, Folk, Electronica, Rand, Rock,
Reg-gae, and Vocal)) (McKinney and Breebaart, 2003). The first of these contains low order
signal characteristics (Root Mean Square RMS, Zero Crossing Rate (ZCR), bandwidth,
spectral centroid and energy, and MFCC). The second group represents roughness,
sharpness, loudness, and temporal envelope fluctuations. Gaussian-based quadratic
dis-crimination analysis is used for classifying, and results in the evaluation. The author
indicated that results could be improved by enhancements of the feature space.
Chapter Three will cover the most common audio features which have been used in the
field of audio classification and deployed in the work described in the above literature.
2.2.3
Machine Learning
Machine Learning refers to an artificial process that optimises a feature extraction stage
to partition the data into relevant classes. There are two main methods of classific ation,
namely: unsupervised classification (clustering); and supervised classification
(discrim-ination). These two have been applied to a diverse range of work including physics,
mathematics, statistics, engineering, artificial intelligence, computer scien ce, and the
CHAPTER 2:LITERATURE REVIEW AND BACKGROUND OF AUDIO CLASSIFICATION SYSTEM 36
An important and growing body of literature has investigated various machine-learning
techniques in the field of audio content analysis. Dhanalakshmi et al. (2009) categorized
audio using Radial Basis Function Neural Networks (RBFNN), which are based on
Radial Basis Function (distance function) as the activation function for hidden layer
neurons and SVM reliant on event type to categorise audio into six different categories
(music, news, cartoon, movie, sports, and advertisements), with accuracy of 92%.
Lin-ear predictive coefficients, linLin-ear predictive cepstrum coefficients, and Mel-frequency
Cepstrum Coefficients (MFCC) were extracted from audio. SVM and neural networks
were also applied with the same features to compare the result with RBFNN method.
The accuracy rates were 92% and 93% respectively.
Lu et al. (2002) classified audio specifically into four categories: speech, music,
envi-ronmental sounds, and silence. This was achieved using K-nearest-neighbour as the
ma-chine learning technique to discriminate the audio into classes. The speech segments
were further divided into groups to denote different speakers through a developed
un-supervised segmentation/classification algorithm.
Lefèvre and Vincent (2011) combined Hidden Markov Model with K-mean classifier in
order to classify football games into three classes (whistle, crowd and speaker's voice).
Each audio class was detected via several features. These features are computed either
from a complete audio segment or from a frame (set of samples). The segment length
was static at 1 second and the frame size represents 1024 samples with 512 overlapping.
Lavner and Ruinskiy (2009) deployed the Decision Tree technique with time domain
ZCR feature and frequency domain features such as spectral energy, MFCC, and others
to discriminate between speech and music in real time audio files. The author reported
CHAPTER 2:LITERATURE REVIEW AND BACKGROUND OF AUDIO CLASSIFICATION SYSTEM 37
Thambi et al. (2014) used Random Forests (RFs), which is considered the modern
generation of DT machine learning, to improve the discrimination between speech and non
-speech to decrease the required storage space through saving only -speech segments. The
authors illustrated that RFs results were better than other decision tree algorithms. Also,
smoothing is used over five segments to improve the results. Random forest was
compared against the bagging and bootstrapping decision tree algorithms by Zhang
(2015) for classifying environmental audio into five different sets (bird, wind, rain, frog,
and thunder) based on various sizes of training samples; the results show the stability
of random forest against the other two algorithms.
Díaz-Uriarte and Alvarez de Andrés (2006) deployed RFs for Gene selection and
clas-sification of microarray data. Due to the promising results and performance, the authors
recommended that RFs become a "standard tool-box”. Later on, Statnikov et al. provide
a comprehensive study for the same purpose of classification between random forests
and support vector machines (Statnikov et al., 2008). The author reported that RFs
clas-sifier outperformed SVM classification results.
RFs also gave an excellent output even with the small size of the training samples, due
to its geometric characteristics of being treated as a collection of hyperplanes, each one
orthogonal to the respective feature axis (Breiman, 2001a).
2.3
Related Work
The idea of automated media information retrieval has been around for several decades ,
since the 1980s when early PCs and mainframes were the predominant computing
plat-forms. The past three decades have seen tremendous technological progress in
compu-ting power and prevalence. Alongside the compucompu-ting power enabling more to be
CHAPTER 2:LITERATURE REVIEW AND BACKGROUND OF AUDIO CLASSIFICATION SYSTEM 38
(ASR), Music Information Retrieval (MIR), event sound recognition, and machine
au-dition of soundscapes have accumulated a large number of invaluable methods and
tools, and much know-how. A system integration approach to audio information mining
can be hypothetically built upon the successes in these fields to extract and obtain
in-formation of interest from soundtracks. Moreover, machine learning tools such as
sta-tistical and intelligent signal processing, soft computing, pattern recognition techniques
and data mining methods have all been developed to an even more mature and
sophis-ticated level. This section will present a review of the most of the relevant work and the
present state of the art of these enabling and related technologies.
2.3.1
Music Information Retrieval
Studies in MIR have seen similar progress in the development of machine audition tech-niques. Downie has defined MIR as “a multidisciplinary research endeavour that strives
to develop innovative content-based searching schemes, novel interfaces, and evolving
networked delivery mechanisms in an effort to make the world’s vast store of music accessible to all” (Downie, 2003). Downie has summarised the impediments against the
MIR system in three simple points “No standard collection of music, no standard tasks
of performance task and no standard metric”.
The International MIR Systems Evaluation Laboratory (IMIRSEL) by Downie (2007)
produced three projects to support the MIR area. These projects are Music Information
Retrieval Evaluation Exchange (known as MIREX), which holds an annual event to
evaluate the algorithms, techniques and music digital libraries in this field. Networked
Environment for Music Analysis, which is abbreviated as NEMA, has planned to build
an open web service framework to evaluate and investigate tools which are used in MIR
as well as other applications. Structural Analysis of Large Amounts of Music
CHAPTER 2:LITERATURE REVIEW AND BACKGROUND OF AUDIO CLASSIFICATION SYSTEM 39
which has generated a database containing 23,000 hours of analysed digital music.
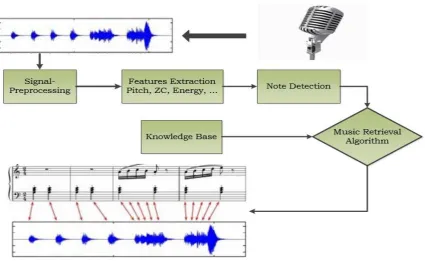
Figure 2-2 depicts a general MIR system. In general, all MIR systems share the
follow-ing objectives:
Automated music transcription.
Musical genre categorization.
[image:39.595.94.520.277.538.2] Mood and theme analysis
Figure 2-2 Music Information Retrieval MIR System
Table 2-2 illustrates the most prominent software and tools that have used in the field
CHAPTER 2:LITERATURE REVIEW AND BACKGROUND OF AUDIO CLASSIFICATION SYSTEM 40
Table 2-2 List including most prominent MIR software and Tools
Software Function Description
BeatRoot Analysis, Music Transcription JAVA-based beat annotation software (audio, MIDI) for beat tracking (Dixon, 2001). Essentia Analysis, Music Transcription C++ library for audio analysis and audio-based
music information retrieval (Bogdanov, 2013). Humdrum Toolkit Analysis Toolkit Tools intended to assist in music research at the
symbolic level (Huron, 1995).
jMIR Analysis Software/Java for automatic music classification and similarity analysis (McKay, 2010)
MIRtoolbox Features Extraction MIRtoolbox is a Matlab toolbox used for the computation of audio features (Lartillot, 2010) Sonic Visualiser Audio Analysing and features
extraction
An application for viewing and analysing the con-tents of music audio files (Cannam, 2010) MARSYAS Analysis Synthesis MARSYAS (Tzanetakis , 2009)
C++ Library for
Audio and Music C++ Programming Library
CLAM is a (C++ Library for Audio and Music) software framework for research and application development in the Audio and Music Domain (Bartkiewicz, 2013).
ChucK Programming Language Audio programming language (Peruse, 2015)
CLM Synthesis
Common Lisp Music is a music synthesis and signal processing package in the Music V family (Schottstaedt, 1986).
Nyquist Synthesis
Nyquist is a sound synthesis and composition lan-guage. Nyquist is a system based on functional programming (Chris, 1986).
SuperCollider
Environment and programming language for Features Extraction and Synthesis,
A real time audio synthesis programming language (McCartney ,1996)
MARSYAS is a widespread audio processing system with specific emphasis on MIR; it
has achieved the previously mentioned objectives with some limitations such as the
inability to classify non-exclusive (overlapped) soundtracks. For example, there is no
ability to detect speech when it is synchronised with the music. Therefore, there is no
speech transcription capability, which leads to the loss of important information.
CHAPTER 2:LITERATURE REVIEW AND BACKGROUND OF AUDIO CLASSIFICATION SYSTEM 41
music libraries and MIR algorithms. IMIRSEL employs this software for its ability to
provide a general, extensible and flexible architecture that allows easy experimentation
with algorithms and provides fast performance that is useful in developing real-time
audio analysis tools.
2.3.2
Automated Speech Recognition
In the formative years of ASR, speech recognition systems processed only one word at
the time. These elementary ASR systems based on template matching were effective in
recognising isolated words, but not running speech. Subsequently, recognising short
sentences without the need for the speaker to pause during the utterance became
possi-ble following the development of connected word detection (Noyes and Starr, 1996).
Later systems proposed in Arriola and Carrasco, (1990a), Arriola and Carrasco, (1990b)
applied the multi-layer perceptron and Hidden Markov Model classifiers to effectively
model and predict the probabilistic nature of running speech and support much more
reliable final decisions.
Khemiri et al. (2013) implemented a system of audio indexing to look for predetermined
advertisements through broadcast radio. The unit called Automatic Language
-Independ-ent Speech Processing (ALISP) is used. ALISP is based on temporal decomposition and
vector quantization. HMM is employed to model the system.
Commercial speech recognition systems in the last decade have developed from
speaker-dependent systems, where the systems are required to adapt to individual
talk-ers before use (Lu et al., 2002) to speaker-independent systems, which will recognise
more generally. There is currently a variety of software available for ASR. Examples
include Dragon, CMUSphinx, Kaldi, iATROS, VoxForge, MacSpeech, Scribe, iListen,
CHAPTER 2:LITERATURE REVIEW AND BACKGROUND OF AUDIO CLASSIFICATION SYSTEM 42
offers a set of free baseline algorithms for further development into bespoke
applica-tions ( Microsoft and Cambridge, Sept. 28, 2000).
The last three decades have seen a great deal of work taking place to address ASR
problems and thereby achieve much improvement in ASR systems. Nonetheless, there
are still major challenges ahead, especially the robustness issue of ASRs in diverse
ap-plication settings, such as language, pronunciation/intonation, signal-to-noise
condi-tions and other related factors. Figure 2-3 shows the conceptual processing of an ASR
system.
Figure 2-3 The General Architecture of Automated Speech Recognition system
2.4.3
Acoustic Event Detection
Event sounds and/or soundscapes could form a robust body of material, which might
provide supplementary information for audio information mining. The information,
comprising analysis of sound events, may yield a clear series consisting of a logically
connected scene or events, which provides an extra dimension of information in the
soundtracks.
The European Commission's integrated project by the name of CHIL ("Computers in
the Human Interaction Loop") is a three-year project to analyse human face to face
situations and extract knowledge in the office or lecture room (Waibel1 et al., 2004).
CHAPTER 2:LITERATURE REVIEW AND BACKGROUND OF AUDIO CLASSIFICATION SYSTEM 43
events analysis. These questions are of the type (‘who and where’, ‘what’ and ’why and how’).
Temko et al. (2006a) give an evaluation of three proposed systems for the analysis of
acoustic event detection and classification of events in the meeting room. Two of the
systems utilised HMM, and the other used SVM. In general, the systems classified
events into speech, CHIL events, and other events. The system based on SVM gave the
same results as the other two systems or better. Temko and Nadeu (2006b) also
classi-fied acoustic events in the smart meeting room “a room equipped with multiple cameras
and microphones in order to investigate the video and audio perception of the computer systems” (Temko et al., 2007, pp.132), using SVM and comparing this with GMM. The
SVM gave improved results over the GMM. The CHIL system is officially appraised in
many evaluation campaigns, and the system is ranked among the best. One of Tekmo’s thesis comments was “The biggest problem in real environment acoustic event detection
is overlapping – i.e. temporal intervals where the acoustic event of interest is overlapped
with speech and/or another acoustic event. It was found that the overlapping segments account for more than 70% of errors produced by every submitted system” (Temko and
Nadeu, 2007, p. 148).
2.3.3
Mixed Audio Classification
Classification is important in archive management, information mining from big data,
and many other applications. No previous study has been general enough to propose a
universal system that will maximise information retrieval for further information
mining. Although the impact of overlapping classes might decrease the information
re-trieval system performance, there has been little research done on addressing this
prob-lem. Some examples of this are Thambi et al. (2014), Kos et al. (2013), Mohri et al.
CHAPTER 2:LITERATURE REVIEW AND BACKGROUND OF AUDIO CLASSIFICATION SYSTEM 44
et al. (2000), Khonglah and Prasanna (2016), Khaldi et al. (2016). The detection of these
classes with the presence of overlap conditions or real-world audio detection has seldom
been studied. Zhang and Kuo (2001) presented an approach to segmentation and
anno-tation of audio-visual recordings into three main categories, namely, silence, and with
and without music components. Each of the last two categories were then further
sub-classified. Four kinds of audio features were used, namely, the short -time energy
func-tion, the short-time average zero-crossing rate, the short-time fundamental frequency
and the spectral peak tracks. The segmentation performance of the proposed method
when dealing with music, speech with background music, and sound effects with
back-ground music was up to 94.5%, 86%, and 87.5% respectively.
For the case of real-world audio classification, universal open architecture has been
proposed as a possible solution to the problem of non-exclusive classification (Duncan
et al., 2014). The proposed system has the ability to detect speech, music, and event
classes even where they overlap simultaneously and to label the input signal via a
timestamp. Some overlapped classes are complex in nature. Hence, they cannot be
straightforwardly detected by common features. Shokouhi et al. (2015) proposed an
overlapped speech detection algorithm with a presence of noise condition to estimate
the likelihood of overlapping speech. The spectral subtraction algorithm for speech
en-hancements is used to detect SNR from non-speech regions. The aim of the suggested
algorithm is to estimate the word-count of the input audio file. Finally, syllable rates
are estimated by dividing the total number of syllables by the segment length. Carrying
the idea forward, MARSYAS software has been combined with the spectral subtraction
algorithm, the output being plotted to the timestamp. This work was also an extension