International Journal of Emerging Technology and Advanced Engineering
Website: www.ijetae.com (ISSN 2250-2459,ISO 9001:2008 Certified Journal, Volume 5, Issue 1, January 2015)
189
Tracking Low Grade Attack Using Cisco Packet Tracer Netflow
Manish khule
1, Megha Singh
21,2Department of Computer Engineering, C.I.I.T, Indore, India Abstract—Detection and remediation of security incidents
is an increasingly important task of system administrators. Specifically, system administrators typically have to base their actions on observing the local traffic to and from their own networks as well as global security incident alerts from organizations software and hardware vendors. However, stealthy targeted attacks may slip below detection thresholds both in the local data alone or on the global scale. The approach uses Cisco packet tracer , a commonly available non-intrusive data source ,analyzes communication to/from the group, and alerts the group members when suspicious activity is detected. A group-based detection has the ability to detect incidents that would fall below local detection thresholds while maintaining the number of alerts at a manageable level for each day.
Keywords—Cisco Packet Trace ,Netflow, Network monitoring, Network Security, worms detection.
I. INTRODUCTION
Network monitoring approaches have been proposed and developed throughout the years, each of them serving a different purpose. They can generally be classified into two categories: active and passive. Active approaches, such as implemented by tools like Ping and Trace route, inject traffic into a network to perform different types of measurements. Passive approaches observe existing traffic as it passes by a measurement point and therefore observe traffic generated by users. One passive monitoring approach is packet capture. [1]This method generally provides most insight into the network traffic, as complete packets can be captured and further analysed . However, in
high-speed networks with line rates of up material.To 100
Gbps, packet capture requires expensive hardware and substantial infrastructure for storage and analysis. Another passive network monitoring approach that is more scalable for use in high-speed networks is flow export, in which packets are aggregated into flows and exported for storage and analysis. A flow is defined in as ―a set of IP packets passing an observation point in the network during a certain time interval, such that all packets belonging to a particular flow have a set of common properties‖. These common properties may include packet header fields, such as source and destination IP addresses and port numbers, packet contents, and meta-information.
Initial works on flow export date back to the nineties and became the basis for modern protocols, such as NetFlow and IP Flow Information export.
Targeted attacks might not leave a large traffic footprint in the targeted organization since one machine with access to the desired information or control system may be sufficient for the attacker to achieve their goals. It is often difficult to detect such low-footprint attacks based on local monitoring alone because it is often necessary to set local alerting thresholds high enough not to generate too many false positives and overwhelm the system administrators. But as a result, a stealthy attack or compromise may lay undetected. [2]Therefore, it is possible for an attacker to target many such organizations without being detected. For example, the attacker may want to maximize profit by attacking multiple financial organizations concurrently before the vulnerability used is detected and corrected. Similarly, terrorists may require the control of many companies to achieve their goal of large scale damage.
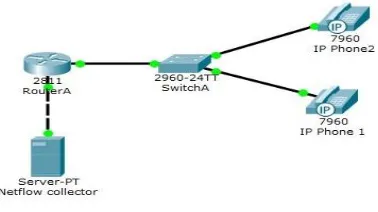
Fig 1.Netflow configuration using Cisco 2811 ISR routers
[image:1.612.346.535.425.531.2]International Journal of Emerging Technology and Advanced Engineering
Website: www.ijetae.com (ISSN 2250-2459,ISO 9001:2008 Certified Journal, Volume 5, Issue 1, January 2015)
190 II. APPROACH
A. Service vision
Our technique is based on the concept of group, in our case defined as a collection of (at least two) organizations.Fig1 A group can be specified based on any criteria relevant for attack detection.[3] For example, it could consists of businesses in a particular industry (e.g., banking, health care, insurance, etc), organizations within a country (e.g., businesses and government agencies in one country), or organizations with particular .Type of valuable information (e.g., industrial espionage or customer credit card information).[11] We detect stealthy security attacks by observing the communication to/from the member organizations of a group. The intuition being that within each organization only very few machines may be attacked or compromised and as a result an attack can be very hard to detect within each organization. However, by observing the communication behavior across multiple organizations in the group, such stealthy behavior may become visible. Given that we analyze communication in the Internet, each organization is defined by the list or range of IP addresses belonging to the organization. We consider Internet communication connections (reported by netflow, for example) within the groups and between groups and external IP addresses who do not belong to any group. For our analysis, all the IP addresses within an organization can be collapsed into one identifier representing the organization. Any communication between two IP addresses where neither belongs to one of our groups and neither has communicated with a group in the past can be ignored. Furthermore, communication with IP addresses belonging to commonly used Internet services (e.g., search, news, social media) can be white listed and removed from consideration. We construct a communication graph for each IP address that communicates with at least one organization in a group as illustrated in Figure 1. This figure shows the communication graph for an external IP address (i.e., some IP address outside any of the groups of interest). Indicates that A has sent messages to B. Although
not depicted in the figure
,
each edge may contain additionalinformation, such as the combinations of source and destination ports used. The weight of the edge is used to quantify the importance of the communication. [4]The importance can be based simply on the number of messages or bytes sent, or the number of contacted individual members in the targeted organization. However, some communication may be more important than others from security point of view.
For example, some port numbers are more often involved with malicious activity (e.g., based on CERT reports) and communication using such ports can be weighted more heavily. The weight is also used to limit the size of each graph. The size of the graph is determined by the number of nodes it contains. If the size exceeds a given threshold, we remove the weakest links until the threshold is reached. This is necessary because storing all communications would require too much space even for a single day. For example, in our data set consisting of heavily sampled netflow, a given weekday contains about 860 million entries. These 860 million recorded netflows originate in 28 million distinct IP addresses. Therefore, if we would not filter unimportant IP addresses, we would need to store 28 million graphs. Moreover, each of these 28 million IP addresses often connects with 1 to 2 million other IP addresses. Thus, if we did not limit the size of each graph, we would have some graphs that are too large to fit into memory. [11]The situation would be even more challenging if we analyzed the data for one month or a week instead of the current one day at a time. As already stated, we also consider communication within a group and across groups. With that, we are able to detect already compromised computers inside an organization when they try to attack further organizations as shown in Figure 2. [6]To reduce the number of false positives (many
organizations have frequent contact with other
International Journal of Emerging Technology and Advanced Engineering
Website: www.ijetae.com (ISSN 2250-2459,ISO 9001:2008 Certified Journal, Volume 5, Issue 1, January 2015)
191 The system administrators may want to react differently to these alternative scenarios. Therefore, for each IP address that has contacted a group member, our system keeps track of how many times it has communicated with IP addresses outside our groups of interest.
B. Input data
Our group-based alerting service uses netflow as its input data source (although other types of information could be utilized as well). Netflow is a standard data format collected and exported by most networking equipment, in
particular, network routers. [7]It provides summary
information about each network communication passing through the network equipment. Specifically, a network flow is defined as an unidirectional sequence of packets that share source and destination IP addresses, source and destination port numbers, and protocol (e.g., TCP or UDP). Each netflow record carries information about a network flow including the timestamp of the first
Packet received, duration, total number of packets and bytes, input and output interfaces, IP address of the next hop, source and destination IP masks, and cumulative TCP flags in the case of TCP flows. [8]Note, however, that the netflow record does not contain any information about the contents of the communication between the source and destination IP addresses.
The group-based alerting service requires access to netflow to/from each of the organizations in the group. Such data can be collected by each of the organizations in the group at their edge routers and then collected at a central location for processing. Alternatively, it can be provided by
An ISP that serves a number of the organizations in the group. Note that the netflow data may be sampled (to reduce the volume of the data) and the actual IP addresses of the computers within each organization can be obfuscated prior to the analysis (e.g., all IP addresses belonging to an organization can be collapsed into one address) if desired. Given the collected netflows and the IP address ranges
Belonging to each member organization in the group, our alerting service analyses the data (either real time or in daily or hourly batches) and generates alerts to the system administrators. [9]The analysis algorithm is described. A white list can be used to eliminate any legitimate communication destinations from consideration (e.g., search engines, CDNs, banking, on-line retailers, etc).
III. IMPLEMENTATION
A. Filtering
The filter is an essential part of our analysis and its role is to remove irrelevant flow records and to reduce the amount of data that needs to be processed by the graph
component. [12]For example, commonly used search,
news, social media, and entertainment web sites are used so frequently that they would appear with almost every group. Furthermore, any traffic that does not involve at least one group member is not relevant for the analysis and is filtered out. Other filtering actions can be chosen based on data volume and perceived threat vectors. For example, HTTP-traffic may be filtered to reduce data volume, but at the risk of missing attacks that use HTTP (port 80).
1: Example Filter algorithm
input : (src-IP, src-port, dst-IP, dst-port, transferred-bytes) output: The same as the input, if not filtered
//collapse IP addresses
src-IP, dst-IP = collapse(src-IP), collapse(dst-IP); //filter IPs of commonly used web sites
if src-IP E whitelist then return ;;
end
//filter web-accesses to group-members if dst-IP E group then
if src-IP € group then if src-port = 80 then return ;;
end end end
//only forward if one of the IPs is in the group if dst-IP E group OR src-IP E group then
return (src-IP, src-port, dst-IP, dst-port, transferred bytes); end
International Journal of Emerging Technology and Advanced Engineering
Website: www.ijetae.com (ISSN 2250-2459,ISO 9001:2008 Certified Journal, Volume 5, Issue 1, January 2015)
192
2: Suspicious IP detection (1)
input : IP, groups, s = State[IP] output: IP, if suspicious; ;, if not //blacklisted IPs are always suspicious if IP E blacklist then
return IP; end
//check if IP is in the groups if IP E groups then
//iterate over all of IP’s connections foreach conn E s.topk do
//iterate over all ports of one connection foreach p E s.topk[conn].port map do //check if src port and dst port are suspicious if is suspicious(src port, dst port) then return IP;
end end end
//no strange ports -¿ skip return ;;
end
//not in groups -¿ check return IP;
3: Suspicious IP detection (2)
input : IP, groups, min cnt, min part, s = State[IP] output: Alarm
//check if top-K connections of this IP are in the groups often enough
cnt = count groups(groups, s.topk); part = cnt / size(s.topk);
if IP € blacklist then
if cnt _ min cnt OR part _ min part then return false;
end end return true;
B. Generating Alarms
We showed above how the COI graph is constructed. Here, we provide two complementary algorithms to detect suspicious IP addresses. The first, shown in Algorithm 3, is used to pre-filter all IP addresses that belong to a group. However, if a computer inside the group is compromised, we still want it to be checked further. To this end, we iterate over all connections in the IP’s top-K and check each pair of ports. The pairs of ports, considered suspicious, are specified using a configuration file. We call Algorithm 3 for all IP addresses returned by Algorithm 2. It assures that (1) only those IP addresses that connected to at least min_cnt members of the group will be reported and that the connections to the group make at least min_part percent of all the connections of the current IP address.
The detection algorithm can be run either for all IP addresses at once or individually for each IP address. Therefore, it is possible to provide different detection latencies.[7] For example, to detect a suspicious IP address the earliest possible, the algorithm must be executed as soon as a message is received for its source-IP’s top-K. If this is not necessary, the algorithm can be run for all top-Ks in one graph process at any desired interval. The generated alarms can be emailed to the system administrators in the affected organizations or posted on a security dashboard. The reports contain the complete top-K for each suspicious
IP address, including the port mappings.
IV. EVALUATION
A. Input data and general setup
Our input data-set is heavily sampled netflow from an ISP. In the first step, we remove all unimportant fields, leaving only the source-IP, destination-IP, source-port, destination-port, and the number of transferred bytes. This sums up to roughly 43 GB of processed netflow per day. [20]The groups lists define a groups with the IP address ranges of all its members and each groups is stored in a separate file (the white list is simply a ―special‖ groups).If a company or institution has more than one IP address range assigned, we can simply add each range as a separate entry. Moreover, an entry in one groups is allowed to be a member in other groups as well.
B. Performance
Cisco Packet Tracer is a network simulation program that allows students to experiment with network behavior and ask ―what if‖ questions. As an integral part of the Networking Academy comprehensive learning experience, Packet Tracer provides simulation, visualization, authoring,
assessment, and collaboration capabilities and facilitates
International Journal of Emerging Technology and Advanced Engineering
Website: www.ijetae.com (ISSN 2250-2459,ISO 9001:2008 Certified Journal, Volume 5, Issue 1, January 2015)
193 The IP address and the destination UDP port of the NetFlow collector have to be configured on the sending device (router or l3 switch). The standard value is UDP port 2055, but other values like 9555 or 9995 can also be
used.
Netflow Network Components:
NetFlow components include the following:
Network devices that are configured for NetFlow.
NetFlow Collector, which receives NetFlow
information from network devices
Netflow Network components or devices collect IP traffic information on interfaces where [12]NetFlow is configured.Network devices then export this information as NetFlow records to a central server that runs NetFlow Collector software, which also performs traffic analysis. Information captured and exported by NetFlow is done independently on each internetworking device or component. NetFlow does not need to be configured on
each router in the network
.
In this lab we will use Cisco’s Packet Tracer to configure a small network consisting of few different devices. We will use this topology to demonstrate how to configure to configure NetFlow version 9 on a Cisco IOS.Configuring the protocol is relatively simple. First it is necessary to insure the Cisco Express Forwarding (CEF) is enabled, this is the default on most new cisco devices, but you should check if it is on the device you are using.
Router # show ip cef
To enable Cisco Express Forwarding (CEF) do the following:
Router # config t Router (config) # ip cef
Then the interface selected must be configured to monitor traffic. There are two methods; however only one of them is supported in Packet Tracer.[8] For example, if you want all incoming (ingress) and outbound (egress) traffic to be collected on the Fa0 / 0 interface, you would enter the following commands:
Router # config t
Router(config )# interface Fa0/0 Router(config-if) # ipflow ingress Router (config-if) # ipflow egress
Then configure the device so the data can be sent to the collector:
Router#config t
Router(config )# ipflow-export source Fa0 / 0 Router (config) # ip flow-export destination 192.168.100.100 9996
Router (config) # ip flow-export version 9
The Traffic can now be displayed on the selected computer using the NetFlow appliclation
Fig2. Shows Virtual Lab set up Using Cisco Packet tracer.
Fig2 show the virtual lab set up of cisco packet tracer consist of three router R1,R2,R3 and netflow server configuration of set up are shown below.
hostname R1 ip cef no ipv6 cef
interface GigabitEthernet0/0 ip flow egress
ip flow ingress
ip address 10.1.1.1 255.255.255.252 duplex auto
speed auto
interface GigabitEthernet0/1 ip flow egress
International Journal of Emerging Technology and Advanced Engineering
Website: www.ijetae.com (ISSN 2250-2459,ISO 9001:2008 Certified Journal, Volume 5, Issue 1, January 2015)
194
ip address 192.168.40.1 255.255.255.0 duplex auto
speed auto
interface GigabitEthernet0/2
ip address 192.168.100.1 255.255.255.0 duplex auto
speed auto
interface Serial0/0/0 ip flow egress ip flow ingress
ip address 10.2.2.1 255.255.255.252 clock rate 2000000
interface Serial0/0/1 ip flow egress ip flow ingress
ip address 10.3.3.1 255.255.255.252 clock rate 2000000
interface Vlan1 no ip address shutdown router rip network 10.0.0.0 network 192.168.40.0 network 192.168.100.0 ip classless
ip flow-export destination 192.168.100.100 9996 ip flow-export version 9
ip flow-export source GigabitEthernet0/2 snmp-server groups CCNA RW
logging 192.168.40.110 line con 0
line aux 0
line vty 0 4 login
ntp server 192.168.40.100 key 0 end
Fig3. Communication Log of Device using Netflow server.
A. Using Microsoft Visual Studio
Microsoft Visual Studio is an integrated development environment (IDE) from Microsoft. It is used to develop computer programs for Microsoft Windows, as well as web sites, web applications and web services. Fig3Visual Studio uses Microsoft software development platforms such as Windows API, Windows Forms, Windows Presentation Foundation, Windows Store and Microsoft Silverlight. It can produce both native code and managed code.
Microsoft Visual Studio is an integrated development environment[14] (IDE) from Microsoft. It is used to develop computer programs for Microsoft Windows, as well as web sites, web applications and web services.
Visual Studio uses Microsoft software development
platforms such as Windows API, Windows Forms, Windows Presentation Foundation, Windows Store and Microsoft Silverlight.Fig4 It can produce both native code and managed code.
International Journal of Emerging Technology and Advanced Engineering
Website: www.ijetae.com (ISSN 2250-2459,ISO 9001:2008 Certified Journal, Volume 5, Issue 1, January 2015)
195 Fig4. Record Given by Cisco Netflow.
Above record is given by Cisco Packet tracer by using netflow this record is evaluated by appliying algorithm.
Fig5.Final result obtain by evaluation of records.
Fig5.Above result shoes the final record of suspicious
activity from the networks
.
V. RELATED WORK
A number of tools and techniques have been developed to process and visualize netflow data(see for a survey). Netflow processing tools include OSU flow-tools , SiLK , and Nfdump 5. In addition to command line tools, numerous graphical user interfaces exist to visualize and query network activity, including NTOP 6 , Nfsen ,
NfSight , VisFlowConnect , FlowScan , NetPY , FloVis ,
VIAssist , and NFlowVis .While visualization tools allow
the users to view the netflow data from different perspectives to locate suspicious activity, our approach analyzes the data and produces small number of meaningful alarms each day.[4] Also, our focus on groups allows us to detect attacks and suspicious behavior that is focused on a potentially small groups, but would not show significantly on a global scale. Detection of similar communication behavior in multiple hosts has been used previously to raise suspicion that hosts with the correlated behavior may be members of the samebotnet.
For example, uses netflow data to identify sets ofsuspicious hosts and then uses host level information (collectedon each host by a local monitor) to confirm or reject the suspicions. However, detection of botnets is simplified by the fact that the bots typically act in unison (e.g., startspamming or DDoS attack against a target at the same time). Indeed, much of the work in this area (e.g., BotMiner ) specifically build detection mechanisms based on the assumptions of thecommunication behavior required for a botnet. Furthermore, to our knowledge, prior work is limited to detecting similar behavior within one organization. The concept of using a groups to help detect security events has been used in the past.[19] For example, the Ensemble system detects applications that have been hijacked by using the idea of a trusted groups of users contributing system-call level local profiles of an application to a common merging engine. The merging engine generates a global profile that can be used to detect or prevent anomalies in application behavior at each end-host in real time. A similar concept of collaborative learning for security is applied to automatically generate a patch to the problematic software without affecting application functionality. PeerPressure automatically
detects and troubleshoots misconfigurations by assuming
that most users in the groups have the correct configuration. Cooperative Bug Isolation leverages the groups to do statistical debugging based on the feedback data automatically generated by groups users. Vigilante apply the groups[17] concept for containment of Internet worms by groups members running detection engines on their machines, where the detection engines distribute attack signatures to other groups members when a machine
is infected
.
VI. CONCLUSIONS
International Journal of Emerging Technology and Advanced Engineering
Website: www.ijetae.com (ISSN 2250-2459,ISO 9001:2008 Certified Journal, Volume 5, Issue 1, January 2015)
196 REFERENCES
[1] B. Claise, B. Trammell, and P. Aitken, ―Specification of the IP Flow Information Export (IPFIX) Protocol for the Exchange of Flow Information,‖ RFC 7011 (Internet Standard), Internet Engineering Task Force, September 2013.[Online].Available: http://www:ietf:org/rfc/rfc7011:txt
[2] N. Brownlee, ―Flow-Based Measurement: IPFIX Development and Deployment,‖ IEICE Transactions on Communications, vol. 94, no. 8, pp. 2190–2198, 2011.
[3] J. Steinberger, L. Schehlmann, S. Abt, and H. Baier, ―Anomaly Detection and mitigation at Internet scale: A survey,‖ in Proceedings of the 7th International Conference on Autonomous Infrastructure, Management and Security, AIMS’13, ser. Lecture Notes in Computer Science, vol. 7943. Springer Berlin Heidelberg, 2013, pp. 49–60.
[4] European Parliament & Council, ―Directive 2006/24/EC of the European Parliament and of the Council of 15 March 2006 on the retention of data generated or processed in connection with the provision of publicly available electronic communications services or of public communications networks and amending Directive 2002/58/EC,‖ March 2006, accessed on 2 May 2014. [Online].Available:http://eurlex:europa:eu/LexUriServ/LexUriServ:d o?uri=OJ:L:2006:105:0054:0063:EN:PDF
[5] W. John, S. Tafvelin, and T. Olovsson, ―Passive Internet Measurement: Overview and Guidelines based on Experiences,‖ Computer Communications, vol. 33, no. 5, pp. 533–550, 2010. [6] C. Mills, D. Hirsh, and G. Ruth, ―Internet Accounting: Background,‖
RFC 1272, Internet Engineering Task Force, November1991.[Online].Available:
http://www:ietf:org/rfc/rfc1272:txt
[7] K. C. Claffy, H.-W. Braun, and G. C. Polyzos, ―A Parameterizable Methodology for Internet Traffic Flow Profiling,‖ IEEE Journal on Selected Areas in Communications, vol. 13, no. 8, pp. 1481–1494, 1995.
[8] http://freeccnalab.com/2014/09/25/packet-tracer-6-1-netflow [9] Cisco Systems, Inc., ―Cisco Catalyst 6500 Architecture White
Paper,‖ 2013, accessed on 2 May 2014. [Online].Available: http://www:cisco:com/en/US/prod/collateral/switches/ps5718/ps708/ prod white paper0900aecd80673385:html
[10] ——, ―Cisco IOS NetFlow and Security,‖ February2005, accessed on 2 May 2014. [Online].Available: http://www:cisco:com/en/US/prod/collateral/iosswrel/ps6537/ps6586 /ps6642/prod presentation0900aecd80311f49:pdf
[11] http://www.research.att.com/export/sites/att_labs/techdocs/TD_1006 52.pdf
[12] http://www.packettracernetwork.com/tutorials/packet-tracer-netflow.html
[13] J. Perkins, S. Kim, S. Larsen, S. Amarasinghe, J. Bachrach, M. Carbin, C. Pacheco, F. Sherwood, S. Sidiroglou, G. Sullivan, W.-F. Wong, Y. Zibin, M. Ernst, and M. Rinard. Self-defending software: Automatically patching security vulnerabilities. In Proceedings of the ACM Symposium on Operating Systems Principles (SOSP), 2009.
[14] http://en.wikipedia.org/wiki/Microsoft_Visual_Studio
[15] F. Qian, Z. Qian, Z. M. Mao, and A. Prakash. Ensemble: Groupsbased anomaly detection for popular applications. 5th International ICST Conference on Security and Privacy in Communication Networks, May 2009.
[16] S. Romig, M. Fullmer, and R. Luman. The OSU flow-tools package and CISCO NetFlow logs. In Proc. 14th USENIX LISA, pages 291– 304, 2000.
[17] C. So-In. A Survey of Network Traffic Monitoring and Analysis Tools. Cse 576m computer system analysis project, Washington University in St. Louis, 2009.
[18] T. Taylor, D. Paterson, J. Glanfield, C. Gates, S. Brooks, and J. McHugh. FloVis: Flow Visualization System. In Proc. Cybersecurity Applications and Technologies Conference for Homeland Security (CATCH), pages 186–198, 2009.
[19] H. Wang, J. Platt, Y. Chen, R. Zhang, and Y.-M. Wang. Automatic misconfiguration troubleshooting with peerpressure. In In OSDI, pages 245–258, 2004.
[20] W. Yurcik. VisFlowConnect-IP: a link-based visualization of Netflows for security monitoring. In 18th Annual FIRST Conf. on Computer Security Incident Handling, 2006.