comment
reviews
reports
deposited research
interactions
information
refereed research
Research
Improved analytical methods for microarray-based
genome-composition analysis
Charles C Kim, Elizabeth A Joyce, Kaman Chan and Stanley Falkow
Address: Department of Microbiology and Immunology, 299 Campus Drive, Stanford University Medical Center, Stanford, CA 94305, USA.
Correspondence: Charles C Kim. E-mail: [email protected]
Abstract
Background: Whereas genome sequencing has given us high-resolution pictures of many different species of bacteria, microarrays provide a means of obtaining information on genome composition for many strains of a given species. Genome-composition analysis using microarrays, or ‘genomotyping’, can be used to categorize genes into ‘present’ and ‘divergent’ categories based on the level of hybridization signal. This typically involves selecting a signal value that is used as a cutoff to discriminate present (high signal) and divergent (low signal) genes. Current methodology uses empirical determination of cutoffs for classification into these categories, but this methodology is subject to several problems that can result in the misclassification of many genes.
Results: We describe a method that depends on the shape of the signal-ratio distribution and does not require empirical determination of a cutoff. Moreover, the cutoff is determined on an array-to-array basis, accounting for variation in strain composition and hybridization quality. The algorithm also provides an estimate of the probability that any given gene is present, which provides a measure of confidence in the categorical assignments.
Conclusions: Many genes previously classified as present using static methods are in fact divergent on the basis of microarray signal; this is corrected by our algorithm. We have reassigned hundreds of genes from previous genomotyping studies of Helicobacter pylori and Campylobacter jejuni strains, and expect that the algorithm should be widely applicable to genomotyping data.
Published: 29 October 2002
GenomeBiology2002, 3(11):research0065.1–0065.17
The electronic version of this article is the complete one and can be found online at http://genomebiology.com/2002/3/11/research/0065 © 2002 Kim et al., licensee BioMed Central Ltd
(Print ISSN 1465-6906; Online ISSN 1465-6914)
Received: 25 June 2002 Revised: 9 September 2002 Accepted: 27 September 2002
Background
Categorization of bacteria on the basis of their genotypic characteristics is supplanting classification based on pheno-typic markers. Genopheno-typic information surpasses the resolu-tion achievable with phenotypic markers, giving deeper insights into evolutionary relationships between species that are indistinguishable on the basis of phenotypic traits. We are particularly interested in the use of genome-composition
information to identify factors that distinguish pathogenic bacteria from their non-pathogenic counterparts.
However, much of the interesting genome information that determines phenotypic traits, such as degree of virulence, is encoded in small differences between strains and serovars, rather than species. Although considerable time will elapse before enough strain-specific sequence information becomes available through genome sequencing projects to identify such traits, microarrays provide us with a tool to gain insight into genome composition at present.
A number of studies have investigated genome composition using spotted DNA microarrays [2-13], a technique that has been referred to as genomotyping [14]. The basic methodol-ogy is to hybridize the fluorescently labeled genomic DNA of the strain of interest to the microarray along with the fluo-rescently labeled genomic DNA of a reference strain, typi-cally the strain whose genome sequence the array was based on. By comparing the ratios of the signals obtained from the spots on the microarray, one can predict whether a given gene is present or divergent (the latter referring to either an absent gene or a gene that is divergent to the point of having poor hybridization properties) in the strain of interest. Current data-analysis methods typically use a constant ratio value as a cutoff for assignment into either the divergent or present categories. This cutoff is typically empirically deter-mined from a comparison of the reference strain to a similar strain that is known to be missing certain genetic elements. However, a strain with known deletions is not always avail-able for every organism, hindering empirical determination of a constant cutoff. This has led some researchers to adopt published cutoff values without empirical determination. This approach may be inappropriate, however, as variability in appropriate cutoffs will be inherent in the many variations of microarray technology and analysis methods, as well as in the strains being analyzed.
In addition to these limitations, we have observed that use of a constant cutoff leads to erroneous assignment of gene presence in many cases. First, using a constant cutoff demands that the microarrays exhibit high reproducibility. Each dataset must exhibit an almost identical distribution of ratio values in order for the chosen value to fall in the same relative location along the distribution. Variation in the width of the ratio distribution, which occurs as a result of variable array and hybridization quality, results in anom-alous categorization of genes. More problematically, strains which are highly divergent from the reference strain cannot be compared to the reference because of strain-specific inconsistencies in established normalization procedures (described in more detail below). For these reasons, we have developed a method for dynamic assignment of genes, where an independent cutoff is calculated for each hybridization dataset. Array-specific cutoff determination provides more flexibility in the hybridizations and strains that can be com-pared. The method is more accurate than using a constant-ratio cutoff for identification of divergent genes, and also allows extraction of data from lower-quality hybridizations
which would otherwise be discarded. We have implemented these methods in the genomotyping analysis program GACK.
Results
Constant cutoffs are not appropriate for varying distributions
One might expect that in comparing the genome composi-tion of a strain of interest to a reference (usually a sequenced) strain, the genes would either be present or absent. In examining such a strain on a microarray, the spots would either exhibit signal (corresponding to present genes) or be missing signal (corresponding to absent genes). This would manifest itself in a distribution of signal intensity ratios as a bimodal distribution representing present and absent genes. In practice, we observe a major peak (present genes) with a left-hand tail for every distribution we have examined, including several published datasets (see, for example, Figures 1, 2). We presume that the manifestation of the non-present genes as a left-side tail rather than a peak is due to a combination of divergence on the nucleotide-sequence level (see below), cross-hybridization and variabil-ity inherent in the calculation of ratios for small signal-intensity values. We refer to these genes as divergent rather than absent, as they may be present but too divergent in nucleotide sequence to show a good hybridization signal. Owing to the continuous nature of the ratio distribution rep-resenting both present and divergent genes (Figure 3), the selection of a cutoff ratio value to assign the genes into these classes is not straightforward.
Previously published work has empirically determined a cutoff value utilizing a strain known to be missing certain genetic elements [8,10,11]. The raw ratios are normalized to represent a linear ratio of 1, which assumes that most genes are present in both the comparison and reference strains. The constant-ratio cutoff is an arbitrarily chosen value that divides the known present and divergent genes (based on genome sequence) into their respective categories. However, small differences in selection of a constant-ratio cutoff can lead to improper assignment of hundreds of genes (Tables 1-3). We desired a more robust method of cutoff assignment that would address this problem. Furthermore, whereas the constant cutoff method may be reasonably accu-rate for strain comparisons in which closely related strains are compared, we discovered during the comparison of several Salmonella enterica serovars using our serovar Typhimurium microarray that this procedure is inaccurate for relatively divergent strains.
comment
reviews
reports
deposited research
interactions
information
refereed research
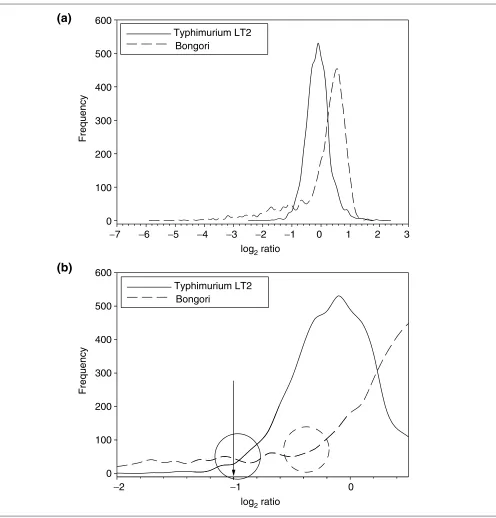
developed for the analysis of RNA expression data, in which the shape of the distribution of ratios is often consistent from hybridization to hybridization regardless of the condi-tions. In genomic DNA comparisons, however, the distribu-tions display more variation in their shape as a result of different numbers of divergent genes (Figures 1, 2, 3a). The distribution of ratios is generally skewed to the left, but the size of the left tail, as represented by the area under the tail, varies depending on the number of divergent genes (Figure 3). A larger tail results in the main peak being shifted further to the right during this type of normalization, as the main peak must balance the values of the tail. As the diver-gent genes presumably fall primarily within the left tail of the distribution and the main peak primarily consists of present genes, the ideal cutoff value to distinguish present and divergent genes is located near the base of the left side of the main peak.
As different types of analysis will require slightly different cutoffs (see below), we refer to the region near the left base
[image:3.609.55.557.87.430.2]of the main peak as the ‘transition region’, and to the precise cutoff value selected for a given analysis as the ‘transition point’ (Figure 3b). Owing to different proportions of diver-gent genes, the boundary values of the transition region change depending on the strain being analyzed, which results in different degrees of shifting of the main peak. In addition, variability in hybridization quality will influence the boundary values, as the main peaks of the distributions will vary in width and position. Using a constant-ratio cutoff for the transition point leads to the cutoff having a variable location along different distributions, rather than intersect-ing each distribution at an identical point. Ideally, the transi-tion point should fall at the same locatransi-tion along the distribution of ratios for every hybridization; that is, the transition point should always be located near the base of the left side of the main peak. Visual inspection of the inter-section of a constant cutoff ratio with a distribution with many divergent genes demonstrates first, that the constant transition point intersects different distributions at different locations along the curve (Figure 3b; see also Figures 1, 2),
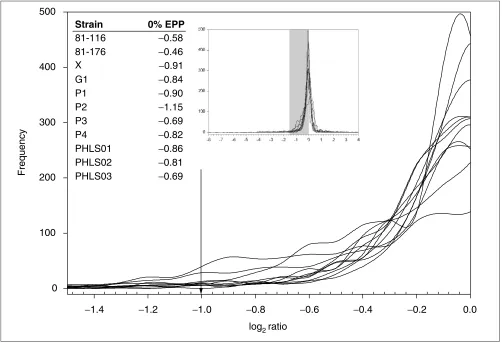
Figure 1
Magnified portion of the ratio distributions of all previously published C. jejunistrains. The arrow indicates the published constant cutoff. Inset graph: the full ratio distributions of C. jejuni. The shaded region indicates the region taken for magnification. Inset table: log ratio values of the 0% EPP transition points chosen by GACK in a strict analysis of divergent genes.
−1.4 −1.2 −1.0 −0.8 −0.6 −0.4 −0.2 0.0 0
100 200 300 400 500
log2 ratio
Frequency
Strain 0% EPP
81-116 −0.58 81-176
X
−0.46 −0.91
G1 −0.84
P1 −0.90
P2 −1.15
P3 −0.69
P4 −0.82
and second, that there are divergent genes in some hybridizations which would be inappropriately deemed present instead of divergent because the constant transition point falls far to the left of the transition region (Figure 3b,
Bongorihybridization).
Dynamic cutoff determination
One solution to the above problems is to choose a different cutoff for each hybridization dataset, which we refer to as dynamic cutoff determination. By calculating independent cutoff ratio values for each dataset, we can eliminate the problems of variability in the ratio distributions. Manual selection of cutoffs for each dataset is both tedious and inac-curate, so we desired an algorithm that would perform reproducible and consistent analyses. In order to select a cutoff dynamically, we first require an algorithm for identify-ing the transition region. This algorithm can either describe the left tail or the main peak; identification of one allows identification of the other by subtraction from the overall distribution. We initially employed what we refer to as posi-tive-side mirroring to describe the peak. In this algorithm,
the highest point of the main peak is identified, and the right half of the main peak of the distribution is mirrored over the maximum. This creates a symmetrical distribution in which the right half of the main peak is mirrored to the left side, creating a distribution which approximately resembles the distribution we would expect if all of the genes were present (for example, the reference strain hybridized to the reference strain). However, we found this algorithm was not very accu-rate for peaks that deviated from perfect symmetry around their maxima (data not shown). We subsequently turned to an algorithm that estimates the main peak using the normal probability density function, which we found to be more accurate in describing the shape of the main peak for datasets deviating from symmetry.
[image:4.609.56.556.85.423.2]The first step of the normal curve-mapping algorithm is to find the location and height of the maximum of the major peak. The sides of the distribution are then determined on the basis of the ratio values at half of the peak’s maximum height. A normal probability density function is fitted to the main peak on the basis of these three parameters (height of
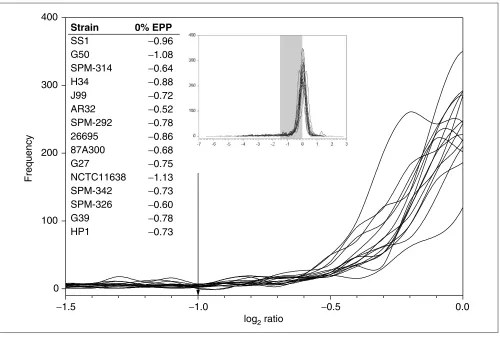
Figure 2
Magnified image of the ratio distributions of all previously published H. pyloristrains. The arrow indicates the published constant cutoff. Inset chart: the full ratio distributions of H. pylori. The shaded region indicates the magnified region. Inset table: the log ratio values of the 0% EPP transition points chosen by GACK in a strict analysis of divergent genes.
−
1.5
−
1.0
−
0.5
0.0
0
100
200
300
400
log
2ratio
Frequency
Strain
0% EPP
SS1
G50
SPM-314
H34
J99
AR32
SPM-292
26695
87A300
G27
NCTC11638
SPM-342
SPM-326
G39
HP1
−
0.96
−
1.08
−
0.64
−
0.88
−
0.72
−
0.52
−
0.78
−
0.86
−
0.68
−
0.75
−
1.13
−
0.73
−
0.60
−
0.78
peak + coordinates of two side points) (Figure 4a). This normal curve is used as an estimate of the peak represent-ing the present genes. We observe a left tail in the actual
ratio distribution, which deviates from the normal curve and represents the population of putatively divergent genes (shaded region, Figure 4a). We have thus established a
comment
reviews
reports
deposited research
interactions
information
[image:5.609.58.554.84.602.2]refereed research
Figure 3
Hybridizations of S. enterica serovar Typhimurium and S. bongori, each to a serovar Typhimurium reference on a Typhimurium LT2 array. (a)Distribution of log ratios for serovar Typhimurium and S. bongori. Serovar Typhimurium is expected to hybridize to all spots, whereas S. bongoriis expected to have divergent genes. Note the left tail in the S. bongoridistribution, which is absent in the serovar Typhimurium distribution (skewness = 0.322 for Typhimurium; skewness = -2.094 for Bongori). (b)Magnification of the region between -2.0 and 0.5. The circles represent the transition regions, where the main peak meets the left tail for each distribution. The arrow represents the constant cutoff which previous publications have used to distinguish present and divergent genes.
Typhimurium LT2
Bongori
−
2
−
1
0
log
2ratio
log
2ratio
Frequency
0
100
−
7
−
6
−
5
−
4
−
3
−
2
−
1
0
1
2
3
200
300
400
500
600
Frequency
0
100
200
300
400
500
600
Typhimurium LT2
Bongori
(a)
mathematical description of the main peak of the distribution, allowing us to identify the transition region, that is, the region at the left base of the mapped normal curve. This is the first step in allowing us to distinguish between present and divergent genes.
Estimated probability of presence
[image:6.609.312.556.117.421.2] [image:6.609.54.298.122.363.2]Most published genomotyping analyses have been limited to identification of divergent genes. However, this is only one type of analysis that can be accomplished with microarray data. One can also determine core sets of genes that are common to multiple strains, as in the case of Helicobacter pylori [11]. With the first step of describing the distribu-tions complete, the challenge becomes to select a precise transition point. Our genomotyping program GACK allows the user to carry out different types of analyses that require different transition-point cutoff values. For example, deter-mination of the set of genes that are divergent in a strain with a 0% false-discovery rate will require a different cutoff compared to determination of the set of core conserved genes within a set of strains with a 0% false-discovery rate. In other words, depending on the type of analysis and the confidence desired in the predictions, the cutoffs will need to be assigned either very close to or farther away from the
Table 1
Divergent genes of Campylobacter jejunistrains
Number of Number of divergent
divergent genes found Number of Difference genes found by our divergent genes between in the original constant-cutoff found by GACK GACK Strain publication [7] reanalysis trinary analysis and [7]
81-116 133 135 178 45
81-176 74 61 117 43
X 20 28 28 8
G1 17 17 37 20
P1 32 59 72 40
P2 63 68 38 -25
P3 91 108 140 49
P4 57 74 83 26
PHLS01 58 63 104 46
PHLS02 36 47 59 23
PHLS03 8 42 66 58
Mean 54 64 84 30
The reanalysis column in this and the other tables is our attempt to reproduce the published analysis.
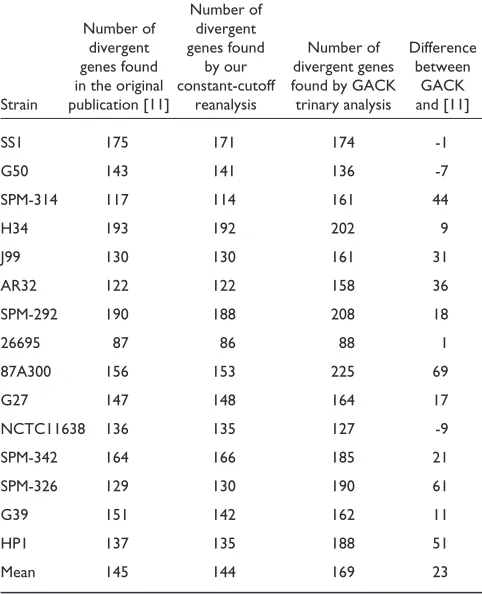
Table 2
Divergent genes of Helicobacter pyloristrains
Number of Number of divergent
divergent genes found Number of Difference genes found by our divergent genes between in the original constant-cutoff found by GACK GACK Strain publication [11] reanalysis trinary analysis and [11]
SS1 175 171 174 -1
G50 143 141 136 -7
SPM-314 117 114 161 44
H34 193 192 202 9
J99 130 130 161 31
AR32 122 122 158 36
SPM-292 190 188 208 18
26695 87 86 88 1
87A300 156 153 225 69
G27 147 148 164 17
NCTC11638 136 135 127 -9
SPM-342 164 166 185 21
SPM-326 129 130 190 61
G39 151 142 162 11
HP1 137 135 188 51
Mean 145 144 169 23
Table 3
Present genes of H. pyloristrains
Number of Number of present
present genes genes found Number of Difference found in by our present genes between the original constant-cutoff found by GACK GACK Strain publication [11] reanalysis trinary analysis and [11]
SS1 1,463 1,467 1,256 -207
G50 1,499 1,501 1,371 -128
SPM-314 1,526 1,529 1,289 -237
H34 1,449 1,450 1,249 -200
J99 1,511 1,511 1,309 -202
AR32 1,510 1,513 1,251 -259
SPM-292 1,453 1,455 1,242 -211
26695 1,556 1,557 1,398 -158
87A300 1,487 1,490 1,185 -302
G27 1,476 1,478 1,288 -188
NCTC11638 1,502 1,503 1,445 -57
SPM-342 1,477 1,475 1,302 -175
SPM-326 1,514 1,513 1,241 -273
G39 1,488 1,499 1,345 -143
HP1 1,506 1,508 1,284 -222
[image:6.609.55.296.445.742.2]base of the main peak. We have observed that the empirical determination of cutoff values generally tends to be conser-vative in the assignment of divergent genes (Figures 1, 2); that is, genes that fall to the left of a cutoff of -1.0 are likely
to be truly divergent. However, assigning all genes with signals larger than this cutoff value to the present category is not accurate, as many genes that are actually divergent will be assigned as present. A cutoff that is conservative
comment
reviews
reports
deposited research
interactions
information
[image:7.609.58.553.86.606.2]refereed research
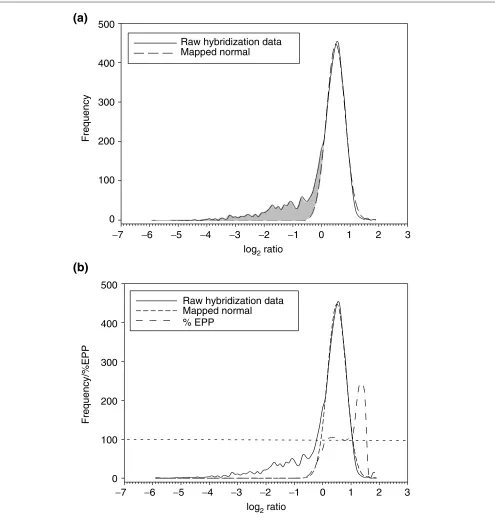
Figure 4
Distribution for S. bongori.(a)Distribution of log ratios for an S. bongorihybridization with a serovar Typhimurium reference. The mapped normal curve estimates the general shape of the main peak; the difference between this idealized curve and the observed data is indicated by the shaded region. (b)The EPP distribution is negligible in the left tail, but increases quickly to 100% as the estimated proportion of present genes increases in the transition region.
log
2ratio
Frequency
Frequency/%EPP
0
100
−
7
−
6
−
5
−
4
−
3
−
2
−
1
0
1
2
3
log
2ratio
−
7
−
6
−
5
−
4
−
3
−
2
−
1
0
1
2
3
200
300
400
500
0
100
200
300
400
500
(a)
(b)
Raw hybridization data
Mapped normal
Raw hybridization data
Mapped normal
for determination of divergent genes inappropriately over-estimates the number of present genes, and vice versa. To make these assignments more accurately, we invoke a simple method for estimating the probability that a gene with a given ratio value is present.
Estimated probability of presence (EPP) is calculated by dividing the mapped normal curve value, which is the expected value for a distribution in which all spots have signal present on the hybridized microarray, by the actual observed data distribution value for any given ratio.
%EPP = 100 x (expected normal value/observed value) By comparing the expected distribution for a hybridization with no absent genes (estimated by the mapped normal curve) to the actual observed distribution, it is possible to estimate the degree of divergence of the genome composi-tions based on the divergence of the distribucomposi-tions.
EPP values are calculated across the distribution in order to assess the probability of presence for any given ratio value (Figure 4b). In the left-hand tail of the observed data distrib-ution, the normal distribution approaches zero. This reflects the fact that in this region genes have a very low (close to 0%) chance of being present. As the EPP distribution approaches the main peak, it rapidly increases as the mapped normal distribution becomes substantial in relation to the observed hybridization data distribution, which reflects the increasing proportion of present genes. Eventu-ally, the EPP crosses 100%, at which point all genes with that particular ratio or higher are expected to be present.
After the point at which it crosses 100%, the shape of the EPP distribution for different hybridizations is variable and unpredictable. As a result, we only consider the left portion before the curve reaches 100% for the determination of EPP. Once the EPP distribution reaches 100%, all genes to the right are considered to be present. We therefore have a measure of the probability that a gene is present for every data point in the hybridization.
Categorical assignment based on EPP
The final problem is assignment into categories. The EPP gives us an estimate of how likely a gene is to be present. Genes with 0% or 100% EPP are easily assigned into the divergent and present categories, respectively. However, a significant number of genes have EPP values between 0% and 100%. These genes fall into the transition region, which is defined by the 0% and 100% EPP boundaries.
Typically, divergent and present are the primary categories of interest. However, if a gene is predicted to have a 50% chance of being present, the question arises as to how it should be assigned. Moreover, in a strict analysis of diver-gent genes, one would want to exclude even genes with a
10% chance of being present from the divergent category. It is clear that selection of a transition point within the transi-tion region is also a variable that should be specified by the user depending on the type of analysis. To provide flexibility in the types of analysis that can be carried out, we provide three categorization tools in the GACK software for assign-ment into various categories as well as parameters for con-trolling the stringency with which the genes are assigned to the categories.
The categorization options that are offered to the user are binary assignment (present and divergent), trinary assign-ment (present, slightly divergent, highly divergent), and an assignment scale that reflects the EPP for every data point (graded assignment). To date, most publications have used a binary assignment scale [3,5,7,8,11], whereas others have circumvented the problem of representation by reporting raw values [10] or only identifying divergent genes [4,9]. As noted above, the transition region contains the transition point, but the precise point must be user-specified depend-ing on the type of analysis. In binary assignment, a transi-tion point is selected on the basis of the percent EPP. In a strict divergent genes analysis, the user would specify 0% EPP as the cutoff, which would result in approximately 0% falsely assigned divergent genes. In contrast, a strict analysis of present genes should use a 100% EPP to minimize falsely assigned genes.
Although binary assignment is desirable in some cases as it gives an orderly appearance, this sort of assignment discards probability information that can serve as an indicator of con-fidence in the category assignments. Trinary assignment is identical to binary assignment, except that in addition to the divergent and present categories, a third category is added for data values that fall in the uncertain transition region. Two transition points are specified, resulting in three cate-gories. Only the genes with the most confident predictions are included in the absolute present and highly divergent categories, whereas a third category contains the genes that could not be assigned with high certainty. These uncertain genes represent the class of genes that are slightly divergent (see “Assessment of divergence” below). The precise EPP values to use as the cutoffs for trinary assignment are user-specified in the software, but we recommend using the most stringent values, 0% and 100%, for most analyses. Using these values, there is high confidence that genes assigned into the three categories are accurate.
being present. This graded scale will ultimately give the most accurate assessment of the data, as it preserves information about the location along the distribution for each gene. Analysis of published results
Only two published spotted microarray genomotyping analy-sis studies have made their raw datasets publicly available [7,11]. We reanalyzed these datasets to evaluate the perfor-mance of GACK.
Dorrell et al. [7] analyzed human isolates of Campylobacter jejuni using a microarray constructed from the library of clones used for genome sequencing of C. jejuni NCTC 11168. Using other published analyses as a basis, these researchers chose a linear constant cutoff of 0.5 (-1.0 in log2 space) to identify divergent genes. We conducted our own constant-cutoff analysis using the same parameters on the published raw data, and our results generally agree with the published analysis (Table 1, and Additional data files). However, we note that even following the methods of the original authors, we were unable to reproduce the analysis with 100% precision. We next analyzed the original raw dataset with our algorithm coded in the program GACK and used trinary categorization
for the output. Visual inspection of the frequency distributions of their hybridization data reveals that the cutoff was generally conservative (Figure 1). This was reflected in the EPP values; all except one of the 0% EPP values is greater than a log2ratio of -1.0 (Figure 1). The less conservative cutoff resulted in the larger number of highly divergent genes predicted by GACK (Table 1; median of 40 more highly divergent genes per strain). We conclude that as a result of GACK’s dynamic cutoff determination, less conservative transition points, which are still appropriate as judged by visual inspection of the ratio dis-tributions, can be used for gene categorization.
The overall genome compositions look fairly similar across the analyses (Figure 5), even though many additional diver-gent genes are predicted by GACK. Closer analysis of the loci analyzed in the original publication (restriction modification, lipo-oligosaccharide, and capsule biosynthesis) show that on the gene level, the analytical methods yield similar results (Figures 6-8). GACK, however, predicts additional divergent genes in these previously identified variable loci, suggesting that the level of divergence may be even greater than deter-mined by the original authors. Some of these additional loci are readily explainable: in the original publication, a single present locus is sometimes flanked by two regions of deleted
comment
reviews
reports
deposited research
interactions
information
[image:9.609.56.558.393.697.2]refereed research
Figure 5
Whole-genome depiction of present and divergent genes for C. jejuni. Blue denotes present genes, black denotes slightly divergent genes, and yellow denotes highly divergent genes.
Published divergent genes
Constant-cutoff analysis
GACK trinary output
genes. Our analysis finds that such loci often fall into the divergent category or into the transition region, indicating a low signal ratio. These genes are presumably divergent, but did not meet the constant-cutoff analysis criterion for a divergent gene because of a slightly higher signal. Using the combination of a less conservative cutoff and trinary output shows that such loci are not very likely to be highly con-served. Furthermore, sequencing of these loci has confirmed that many genes previously assigned to be present are in fact divergent, and that GACK is more accurate than constant-cutoff approaches in identifying these divergent loci (B. Wren, personal communication). A complete list of diver-gent genes is available from our website [15] and as addi-tional data files with the online version of this paper. Salama et al. [11] analyzed strains of Helicobacter pylori
using a spotted microarray based primarily on the strain 26695 genome sequence, with additional spots representing strain J99-specific genes. The array therefore contains sequences that are unique to J99 and others that are unique to 26695, which proved useful for empirically choosing a log2 cutoff of -1.0. As observed for the C. jejuni analysis, we observed that a log2cutoff of -1.0 was generally conservative
(Figure 2), and that many divergent genes were falsely assigned to the present category. We compared the trinary GACK output to published analyses of divergent and present genes. In some strains, more highly divergent genes are pre-dicted by GACK, but in other strains, fewer highly divergent genes are predicted (Table 2). In the case of present genes, fewer present genes are predicted by GACK for all strains (Table 3), which is due to the assignment of many of the genes to the slightly divergent category. In conclusion, whereas GACK analysis coupled with trinary output is gener-ally less conservative in predicting highly divergent genes, the predictions for present genes are more conservative (that is, they predict fewer present genes) as a result of assignment of
some of these genes to the slightly divergent category. From visual inspection of the position of the cutoff values along the ratio distributions we expect that these assignments more accurately reflect the true genome compositions.
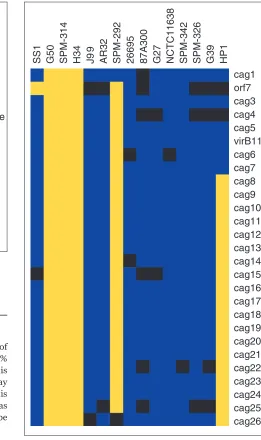
Viewing the whole genomes indicated that the major variable loci predicted in the original publication are preserved in the GACK analysis. No additional major contiguous regions of divergence are predicted. A full list of divergent loci predicted by GACK is available [15]. Analysis of the cagpathogenicity island reveals that whereas the major differences are con-served, some loci also display consistent weak signal across a portion of the strains (black regions, Figure 9). Examples of these loci are orf7, cag4, cag22 and cag25. Intriguingly, multiple alleles of orf7 are apparent across the strains (N. Salama, personal communication). The microarray con-tains the 26695 allele of orf7, which is confirmed to be present in strains G27, NCTC11638 and SPM-342 by PCR and sequencing, in agreement with GACK analysis. The locus is absent in strains SS1, G50, SPM-314, H34 and SPM-292, also in agreement with GACK analysis. In J99 and 87A300, orf7
contains an insertion in the coding sequence. These two strains exhibit weak hybridization signal, resulting in assign-ment of orf7to the slightly divergent category, presumably due to the presence of the insertion. The orf7alleles present in AR32, SPM-326, G39, and HP1 are uncharacterized, but our results would predict that these strains also contain the J99 allele or another allele that is divergent from the 26695 allele. This finding suggests that the preservation of ratio-intensity information in the trinary or graded output may be useful in identifying allelic differences in some genes. Assessment of divergence detection for H. pylori
microarrays
[image:10.609.56.556.87.257.2]The complete sequencing of a second H. pyloristrain, J99 [16,17], provides a convenient means for assessing how
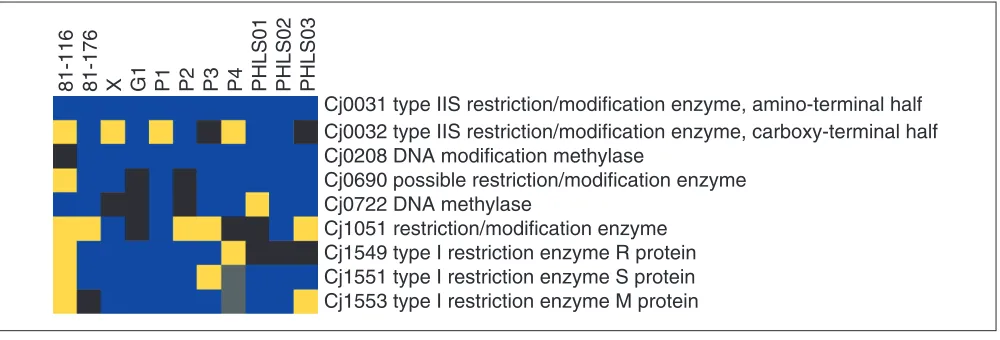
Figure 6
GACK trinary analysis of restriction/modification loci of C. jejuni. Blue denotes present genes, black denotes slightly divergent genes, yellow denotes highly divergent genes, and grey denotes missing data. The analysis corresponds to Table 2 of [7].
Cj0031 type IIS restriction/modification enzyme, amino-terminal half
Cj0032 type IIS restriction/modification enzyme, carboxy-terminal half
Cj0208 DNA modification methylase
Cj0690 possible restriction/modification enzyme
Cj0722 DNA methylase
Cj1051 restriction/modification enzyme
Cj1549 type I restriction enzyme R protein
Cj1551 type I restriction enzyme S protein
Cj1553 type I restriction enzyme M protein
divergence in sequence identity affects microarray signal, and therefore categorization. As the design of the micro-array was based on the 26695 sequence, the J99 hybridiza-tion products represent a spectrum of sequence identities between target and probe. We examined the correlation between signal intensities and percent sequence identity for a J99 hybridization dataset in order to assess the degree of sequence divergence that could be detected on the H. pylori
microarray. As expected, the hybridization signal decreases
with increasing sequence divergence (Figure 10a). For a constant-cutoff analysis using a log2 cutoff of -1.0, the identity level for categorization as divergent is approxi-mately 88%. For the trinary GACK analysis, the transition points were at -0.2 and -0.7, corresponding to approxi-mately 92% and 89% sequence identity. These trends are reflected in Figure 10b; approximately 50% of the genes with 88% sequence identity are categorized as present, and the other 50% are divergent for the constant-cutoff analysis.
comment
reviews
reports
deposited research
interactions
information
[image:11.609.58.567.87.575.2]refereed research
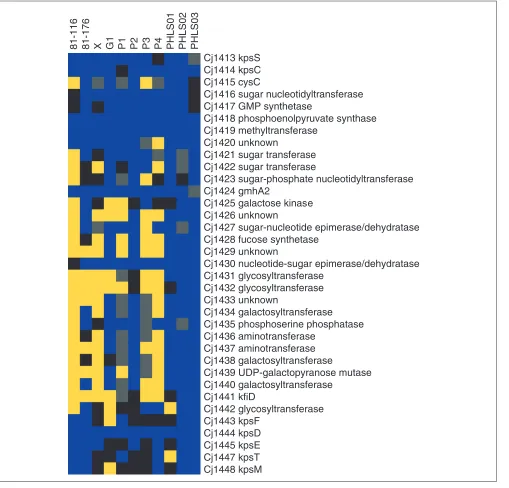
Figure 7
GACK trinary analysis of the capsule biosynthetic locus of C. jejuni. Blue denotes present genes, black denotes slightly divergent genes, yellow denotes highly divergent genes, and grey denotes missing data. The analysis corresponds to Table 3 of [7].
Cj1413 kpsS
Cj1414 kpsC
Cj1415 cysC
Cj1416 sugar nucleotidyltransferase
Cj1417 GMP synthetase
Cj1418 phosphoenolpyruvate synthase
Cj1419 methyltransferase
Cj1420 unknown
Cj1421 sugar transferase
Cj1422 sugar transferase
Cj1423 sugar-phosphate nucleotidyltransferase
Cj1424 gmhA2
Cj1425 galactose kinase
Cj1426 unknown
Cj1427 sugar-nucleotide epimerase/dehydratase
Cj1428 fucose synthetase
Cj1429 unknown
Cj1430 nucleotide-sugar epimerase/dehydratase
Cj1431 glycosyltransferase
Cj1432 glycosyltransferase
Cj1433 unknown
Cj1434 galactosyltransferase
Cj1435 phosphoserine phosphatase
Cj1436 aminotransferase
Cj1437 aminotransferase
Cj1438 galactosyltransferase
Cj1439 UDP-galactopyranose mutase
Cj1440 galactosyltransferase
Cj1441 kfiD
Cj1442 glycosyltransferase
Cj1443 kpsF
Cj1444 kpsD
Cj1445 kpsE
Cj1447 kpsT
Cj1448 kpsM
Similarly, the GACK analysis assigns approximately 50% of the genes with 89% identity to divergent, and close to 100% of the genes with greater than 92% identity as present. This suggests that the detection limit of the H. pylorimicroarray is approximately 88% sequence identity, and that this detection limit results in classification of certain genes as divergent in spite of the fact that sequence identity may be relatively high (80-85%).
We observe, however, that the majority of PCR products on the array are approximately 93-97% identical to J99 (Figure 11a), and that the distribution of percent sequence identity bears a striking resemblance to the shape of the dis-tribution of the array data (Figure 11b). This implies that the shape of the array data distribution may largely be a function of the genome content, in addition to the hybridization quality and parameters, and that the limits of detection for the H. pylorimicroarray may be considerably lower than the apparent value. The consequence for interpretation of genomotyping data is that divergence is always relative to the main peak of present genes. This main peak will repre-sent differing degrees of sequence identity for different organisms and strains, limiting our ability to make precise predictions about the absolute degree of divergence for any given gene. Furthermore, the predictions are likely to be affected by the hybridization conditions. Nevertheless, it is evident that the microarray data contain a fairly high level of
sequence identity resolution, and that binary representation unnecessarily overlooks this information.
Validation of GACK predictions
Sequencing of the C. jejuni capsule biosynthetic locus from several strains has indicated that some regions which were incorrectly predicted to be present by constant-cutoff methods are correctly predicted to be divergent by GACK (B. Wren, personal communication). To further validate the algorithm, we attempted to PCR-amplify and sequence 40 genes representing a spectrum of array intensities from the
[image:12.609.289.550.86.526.2]H. pyloristrain G27. We successfully amplified 21 regions
Figure 8
GACK trinary analysis of the lipo-oligosaccharide biosynthetic locus of C. jejuni. Blue denotes present genes, black denotes slightly divergent genes, yellow denotes highly divergent genes, and grey denotes missing data. The analysis corresponds to Table 4 of [7].
Cj1131 galE
Cj1132 unknown
Cj1133 waaC
Cj1134 htrB
Cj1135 glycosyltransferase
Cj1136 glycosyltransferase
Cj1137 unknown
Cj1138 galactosyltransferase
Cj1139 wlaN
Cj1140 cst
Cj1141 neuBI
Cj1142 neuCI
Cj1143 neuAI
Cj1144 unknown
Cj1145 unknown
Cj1146 waaV
Cj1148 waaF
Cj1149 gmhA
Cj1150 rfaE
Cj1151 rfaD
Cj1152 phosphatase
[image:12.609.54.305.88.339.2]81-116
81-176
X
G1
P1
P2
P3
P4
PHLS01
PHLS02
PHLS03
Figure 9
The cagpathogenicity island of H. pylori. Trinary GACK output was directly visualized in Treeview [22]. Blue denotes present genes, black slightly divergent genes, and yellow highly divergent genes.
cag1
orf7
cag3
cag4
cag5
virB11
cag6
cag7
cag8
cag9
cag10
cag11
cag12
cag13
cag14
cag15
cag16
cag17
cag18
cag19
cag20
cag21
cag22
cag23
cag24
cag25
cag26
SS1
G50
SPM-314
H34
J9
9
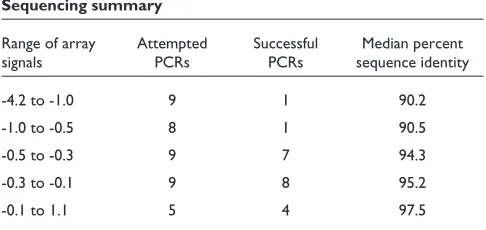
for subsequent sequencing. Many of the genes predicted to be highly divergent by GACK did not amplify, presumably because of their divergence. However, in the cases where amplification and sequencing were successful for the highly divergent genes, we observed approximately 90% sequence identity between G27 and the amplified sequence present on the array (26695 or J99) (Table 4). All genes that were pre-dicted to be slightly divergent by GACK (array ratio of -0.6 to -0.2) were 91-96% identical with sequences on the H. pylori
array, with a median of 94%. Genes with stronger array intensities were predicted to be present by GACK, and, not surprisingly, corresponded to higher sequence identities. On the basis of a linear regression of the sequencing results, we predict that the majority of genes of G27 share approxi-mately 96% identity with the sequences on the array (pri-marily 26695). These data, taken together with our analyses of the J99 hybridizations, indicate that microarrays do not just predict presence or divergence, but can resolve variation in sequence identity between target and probe. Furthermore, GACK is able to correctly categorize these genes.
Discussion
Microarrays are increasingly used as a tool for genome-com-position analysis, or genomotyping [14,18]. Current methods of microarray data analysis are primarily designed for expres-sion (mRNA) studies, in which the distribution of signals is assumed to remain relatively similar across conditions. For microarray-based comparative genome analyses, the signal distributions may show significant variation between species or strains. Furthermore, normalization procedures in which distributions are centered to zero on a log2 scale are not
appropriate for strain comparisons, as the majority of the dis-tributions are skewed. This skew manifests itself as the main peak of the ratio distribution, representing the present genes, being shifted to different degrees for different strains. The peak’s position is also dependent on the length of, and number of genes present in, the left tail (area under the left tail). Because of the varying position of the ratio distribu-tions, a constant-cutoff analysis results in selection of a dif-ferent location on each distribution as the transition point for category assignment. Other normalization procedures can be
used that will not be subject to such problems, but are more complicated to implement and require some prior knowledge of genome composition [19]. We hypothesized that a more accurate approach to creating these assignments is to select a mathematically identical point on each distribution being analyzed as the transition point. We subsequently developed an algorithm to reproducibly identify such a point.
The algorithm assumes that a hybridization in which all spots have signal present are distributed normally. This assumption proves to be fairly accurate, as is observed in the mapping of normal curves to the hybridization distributions (for example, Figure 4). Slight deviations are seen in the tails of the distributions, suggesting that better estimates of the distributions may exist. The observation that percent sequence identity is at least crudely resolved on the micro-arrays suggests that a multinormal model may be more accu-rate. Nonetheless, the normal curve mapping consistently gives good overlap with the main peak of the ratio distribu-tions in our analyses. Furthermore, normalization of the dataset does not impact on analysis with GACK because the algorithm depends on the shape of the distribution. The genes are determined to be present or divergent on the basis of their relative position in the distribution, rather than an absolute signal intensity ratio. We observed that the algo-rithm works as well on un-normalized datasets as it does on normalized datasets (data not shown), circumventing the need to implement more complex normalization procedures for genomotyping data. However, while GACK is able to account for minor variations in a set of replicate hybridiza-tions, we emphasize that hybridizations of poor quality yield irreproducible results regardless of the analysis method. We originally considered using the left side of the normal curve map as a transition point for binary analysis. This point effectively represents a 0% EPP cutoff, which we believe is appropriate and accurate for a strict divergent genes analysis. However, we realized that genomotyping data embodies information that can be analyzed in many other ways, and therefore chose to implement multiple flexible assignment systems in the software. The choice of the transition point(s) and the output format depend closely on one another; regard-less of this, the algorithm selects points that are consistent in their location on each distribution for any given analysis. This method, coupled with our estimates of probability that a gene is present (EPP values), should give more accurate assign-ments across hybridizations and strains.
We developed GACK to improve analysis of genomotyping data generated in our laboratory. In an effort to both deter-mine if the algorithm would be broadly applicable to other genomotyping datasets generated from different micro-arrays and by other laboratories, we tested all of the publicly available datasets with GACK. It should be noted that at present only two datasets are available, both of which were generated using spotted DNA microarrays, and therefore the
comment
reviews
reports
deposited research
interactions
information
[image:13.609.55.298.626.741.2]refereed research
Table 4
Sequencing summary
Range of array Attempted Successful Median percent
signals PCRs PCRs sequence identity
-4.2 to -1.0 9 1 90.2
-1.0 to -0.5 8 1 90.5
-0.5 to -0.3 9 7 94.3
-0.3 to -0.1 9 8 95.2
Figure 10
Microarray results as a function of sequence identity for H. pyloriJ99. (a)H. pylori J99 sequences show varying degrees of divergence from the 26695 sequences present on the microarray, which is reflected in the microarray signal. Median signal ratios were calculated from J99 spots grouped by predicted degree of local sequence identity greater than 50 nucleotides in length with 26695. (b)The proportion of present genes for J99 spots grouped by sequence identity with 26695 was tabulated for constant cutoff and GACK analyses.
Percent sequence identity
Median signal ratio
Percent present
Percent sequence identity
0
20
40
60
80
100
Constant cutoff
GACK
100%
99%
98%
97%
96%
95%
94%
93%
92%
91%
90%
89%
88%
87%
86%
85%
84%
83%
81%
Less
Less
100%
99%
98%
97%
96%
95%
94%
93%
92%
91%
90%
89%
88%
87%
86%
85%
84%
83%
81%
0.5
0.0
0.5
−
1.0
−
1.5
−
2.0
−
2.5
−
3.0
1.0
1.5
(a)
comment
reviews
reports
deposited research
interactions
information
[image:15.609.57.555.83.685.2]refereed research
Figure 11
Comparison of sequence identity and microarray hybridization distributions for J99. (a)Percent local sequence identity shared between the amplicons present on the H. pylorimicroarray and J99. The majority of J99 genes share 93-97% identity with the array sequences, which are based on 26695. A peak of 93 genes with 100% identity is mostly comprised of J99-specific sequences that were added to the array. (b)J99 hybridization distribution. Note the presence of a small peak to the right of the main peak, similar to above.
Percent sequence identity
log
2ratio
Frequency
Frequency
93
358
286
173
259
137
76
45
24
15
10
7
6
6
2
2
0
1
92
37
12
−
5
−
4
−
3
−
2
−
1
0
1
2
Less
81%
82%
83%
84%
85%
86%
87%
88%
89%
90%
91%
92%
93%
94%
95%
96%
97%
98%
99%
100%
400
300
250
200
150
100
50
0
300
200
100
0
(a)
applicability of GACK to data generated from oligo-based arrays remains to be tested. Nonetheless, our analyses gen-erally correspond well with the published analyses of
C. jejuniand H. pyloristrains. Categorical assignments were based on a constant log2cutoff of -1.0 in these publications, which, from visual inspection of the distributions, appear to be conservative for divergent gene identification. Accord-ingly, GACK predicted transition-point values that were gen-erally higher than -1.0. As these publications primarily focused on divergent genes, conservatism in the predictions was appropriate, but resulted in lower sensitivity of detec-tion. Our analyses have recategorized several hundred genes based on 0% and 100% EPP values. Although many genes have been reclassified as highly divergent, many also fall into the slightly divergent category. In creating this additional category, we make a relatively conservative prediction of both highly divergent and present genes, which results in more confidence in our assignments.
We found that the published analyses of H. pylori strains were also conservative in their predictions of divergent genes, although less so than the C. jejuni analysis. In con-trast, the published predictions for present genes were less conservative, as genes that lie within the tail of the ratio dis-tribution but have a ratio of greater than -1.0 were classified as present (Figure 2). This is a limitation of binary represen-tation of the information. This limirepresen-tation, coupled with our observations that sequence-identity information is present in the array data, indicate to us that more sophisticated and detailed representation systems are necessary. We believe that at present, trinary and graded output are the best options, as they preserve more information than binary output, but more work is needed in this area.
Closer analysis of the cagpathogenicity island revealed that the predictions were for the most part identical to the previ-ously published predictions. Intriguingly, some loci, such as
orf7, consistently show hybridization, but with relatively low strength. This is particularly interesting because there are multiple allelic forms of orf7 in different H. pylori strains (N. Salama, personal communication). This indicates that preservation of ratio information, such as in the output of trinary or graded analyses, can result in detection of relevant biological differences and should be done for most analyses. Analysis of the degree of sequence identity required for detection on the H. pylori microarray revealed that sequences with less than 88% identity resulted in dramati-cally reduced signal on the microarray. Genes with this degree of identity or lower were typically classified as highly divergent, regardless of the method of analysis. In contrast to the hybridization results, loci with greater than 80% sequence identity are generally considered to be likely homologs by in silicocomparison. This is a limitation of the microarray technology that should be considered when referring to a particular locus as divergent.
We attempted to validate the GACK predictions by PCR amplifying and sequencing loci of the different classes. Not surprisingly, many of the highly divergent genes did not amplify, limiting our ability to draw any conclusions about the precise degree of sequence identity that results in a gene being classified as divergent. Nevertheless, the observed PCR success/failure rate and percent sequence identities are consistent with the GACK predictions. True validation of this analysis method, and of microarray genomic comparison and analysis methods in general, will be achieved through a combination of more strain comparison work and accom-panying sequence information in the form of genome sequencing projects and the sequencing of particular loci by individual laboratories. Multiple strain and species genomes are available, or will be soon, for a number of organisms, providing a wealth of information for direct comparative genomic analysis and the groundwork for further establish-ing microarray-based genomic comparisons as a viable means of assessing genetic differences in strains of interest. Our findings offer improved methods for analysis of microarray-based genome-composition data. Analysis of genomotyping datasets of S. enterica serovars has demon-strated that dynamic cutoff selection is more reliable and reproducible than constant cutoffs [20]. We have also described two additional systems for representation, which preserve more of the raw information than a binary analysis. Most importantly, we have identified shortcomings in cur-rently available analytical methods. Most of the tools for microarray data analysis have been developed for use with expression data, but even simple manipulations such as nor-malization of the datasets are not necessarily appropriate in the case of genomic comparisons. We hope and anticipate that identification of these problems will facilitate that development of even more sophisticated analysis methods.
Materials and methods
GACK programming
GACK was written in Perl. Testing was conducted on a Windows 2000 system with ActivePerl 5.6.1 build 631. The script requires Perl/Tk for the user interface. A stand-alone executable for Windows was created using Perlapp (Activestate Perl Developer’s Kit 4.0).
Reconstruction of datasets
We found that we could not precisely reproduce the results of two previously published works [7,11]. We therefore detail here the reconstruction of the raw datasets that we generated for our analyses, as well as make available our datasets [15].
C. jejuni dataset
1,730), which could not be converted to log2and were sub-sequently discarded from the dataset. The triplicates were averaged, and these data served as the raw dataset for our analyses. The published present/divergent genes category sizes were tabulated from the lists of divergent genes avail-able at [15].
H. pylori dataset
Raw values were downloaded from the Stanford Microarray Database [21]. The data for the AR32 and H34 strains were absent in the Published Data section, and were obtained directly from the authors. The data were filtered to include the same genes as the previously published dataset [11]. Numbers describing the size of the present and divergent genes categories were obtained directly from the publication.
PCRs and sequencing
Genes were selected for sequencing using various criteria, including array signal intensity, variance in the replicates and amplicon length. Primers were selected that were identi-cal to those used to construct the H. pylori array. Sequenc-ing was from both ends of the PCR products and was carried out by Sequetech (Mountain View, CA). H. pylori G27 genomic DNA was a gift from Douglas Scott Merrell.
Additional data files
The Perl source code for GACK, a Windows-executable version of the program, and a manual in PDF format are freely available at our website [15] and as additional data files with the online version of this paper. A complete list of divergent genes, raw ratio values and trinary outputs are also available for C. jejuniand H. pylori. A tool for constant-cutoff analysis, CCACK, can also be downloaded at our website [15].
Acknowledgements
We are grateful to Nick Dorrell for assistance in recreating the C. jejuni datasets and providing detailed information regarding their analysis methods, and to Nina Salama for assistance in recreating the H. pylori datasets, sharing information before publication, and for a critical reading of this manuscript. We also thank Gavin Sherlock and Lucinda Thompson for a critical reading of this manuscript. C.C.K. is supported by an HHMI Predoctoral Fellowship and Stanford Graduate Fellowship. E.A.J. is sup-ported by NRSA grant 1F32 A151859-01. K.C. is supsup-ported by an NSF Graduate Research Fellowship.
References
1. Fleischmann RD, Adams MD, White O, Clayton RA, Kirkness EF, Kerlavage AR, Bult CJ, Tomb JF, Dougherty BA, Merrick JM,et al.: Whole-genome random sequencing and assembly of
Haemophilus influenzaeRd.Science 1995, 269:496-512.
2. Israel DA, Salama N, Krishna U, Rieger UM, Atherton JC, Falkow S, Peek RM, Jr: Helicobacter pylori genetic diversity within the
gastric niche of a single human host.Proc Natl Acad Sci USA
2001, 98:14625-14630.
3. Israel DA, Salama N, Arnold CN, Moss SF, Ando T, Wirth HP, Tham KT, Camorlinga M, Blaser MJ, Falkow S,et al.: Helicobacter pylori strain-specific differences in genetic content, identified by
microarray, influence host inflammatory responses. J Clin
Invest 2001, 107:611-620.
4. Behr MA, Wilson MA, Gill WP, Salamon H, Schoolnik GK, Rane S, Small PM: Comparative genomics of BCG vaccines by
whole-genome DNA microarray. Science 1999, 284:1520-1523.
5. Bjorkholm B, Lundin A, Sillen A, Guillemin K, Salama N, Rubio C, Gordon JI, Falk P, Engstrand L: Comparison of genetic diver-gence and fitness between two subclones of Helicobacter
pylori.Infect Immun 2001, 69:7832-7838.
6. Cho JC, Tiedje JM: Bacterial species determination from DNA-DNA hybridization by using genome fragments and
DNA microarrays.Appl Environ Microbiol 2001, 67:3677-3682.
7. Dorrell N, Mangan JA, Laing KG, Hinds J, Linton D, Al-Ghusein H, Barrell BG, Parkhill J, Stoker NG, Karlyshev AV, et al.: Whole
genome comparison of Campylobacter jejunihuman isolates
using a low-cost microarray reveals extensive genetic
diver-sity.Genome Res 2001, 11:1706-1715.
8. Dziejman M, Balon E, Boyd D, Fraser CM, Heidelberg JF, Mekalanos
JJ: Comparative genomic analysis of Vibrio cholerae: genes
that correlate with cholera endemic and pandemic disease.
Proc Natl Acad Sci USA 2002, 99:1556-1561.
9. Fitzgerald JR, Sturdevant DE, Mackie SM, Gill SR, Musser JM: Evolu-tionary genomics of Staphylococcus aureus: insights into the origin of methicillin-resistant strains and the toxic shock
syndrome epidemic.Proc Natl Acad Sci USA 2001, 98:8821-8826.
10. Murray AE, Lies D, Li G, Nealson K, Zhou J, Tiedje JM: DNA/DNA hybridization to microarrays reveals gene-specific
differ-ences between closely related microbial genomes.Proc Natl
Acad Sci USA 2001, 98:9853-9858.
11. Salama N, Guillemin K, McDaniel TK, Sherlock G, Tompkins L, Falkow S: A whole-genome microarray reveals genetic
diver-sity among Helicobacter pylori strains. Proc Natl Acad Sci USA
2000, 97:14668-14673.
12. Smoot JC, Barbian KD, Van Gompel JJ, Smoot LM, Chaussee MS, Sylva GL, Sturdevant DE, Ricklefs SM, Porcella SF, Parkins LD,et al.: Genome sequence and comparative microarray analysis of
serotype M18 group A Streptococcusstrains associated with
acute rheumatic fever outbreaks.Proc Natl Acad Sci USA 2002,
99:4668-4673.
13. Wu L, Thompson DK, Li G, Hurt RA, Tiedje JM, Zhou J: Develop-ment and evaluation of functional gene arrays for detection
of selected genes in the environment. Appl Environ Microbiol
2001, 67:5780-5790.
14. Lucchini S, Thompson A, Hinton JC: Microarrays for
microbiolo-gists. Microbiology 2001, 147:1403-1414.
15. Falkow lab website[http://falkow.stanford.edu]
16. Tomb JF, White O, Kerlavage AR, Clayton RA, Sutton GG, Fleischmann RD, Ketchum KA, Klenk HP, Gill S, Dougherty BA,et al.: The com-plete genome sequence of the gastric pathogen Helicobacter
pylori.Nature 1997, 388:539-547.
17. Alm RA, Ling LS, Moir DT, King BL, Brown ED, Doig PC, Smith DR, Noonan B, Guild BC, deJonge BL,et al.: Genomic-sequence com-parison of two unrelated isolates of the human gastric
pathogen Helicobacter pylori.Nature 1999, 397:176-180.
18. Joyce EA, Chan K, Salama NR, Falkow S: Redefining bacterial
populations: a post-genomic reformation.Nat Rev Genet 2002,
3:462-473.
19. Hoffmann R, Seidl T, Dugas M: Profound effect of normalization on detection of differentially expressed genes in
oligonu-cleotide microarray data analysis. Genome Biol 2002,
3:research0033.1-0033.11.
20. Chan K, Baker S, Kim CC, Detweiler CS, Dougan G, Falkow S:
Genomic comparison of Salmonella enterica serovars and
Salmonella bongori using a Typhimurium DNA microarray.
J Bacteriol, in press.
21. Sherlock G, Hernandez-Boussard T, Kasarskis A, Binkley G, Matese JC, Dwight SS, Kaloper M, Weng S, Jin H, Ball CA,et al.: The
Stan-ford Microarray Database.Nucleic Acids Res 2001, 29:152-155.
22. Eisen MB, Spellman PT, Brown PO, Botstein D: Cluster analysis
and display of genome-wide expression patterns. Proc Natl
Acad Sci USA 1998, 95:14863-14868.