COMPUTATIONAL INTELLIGENCE BASED TECHNIQUE IN
MULTIPLE FACTS DEVICES INSTALLATION FOR POWER
SYSTEM SECURITY
1S.A. JUMAAT, 2I. MUSIRIN, 3M. M. OTHMAN, 4H. MOKLIS
1
Faculty of Electrical and Electronics Engineering, Universiti Tun Hussein Onn Malaysia (UTHM) 86400 Parit Raja, Batu Pahat, Johor, Malaysia
2Assoc. Prof., Faculty of Electrical Engineering, Universiti Teknologi MARA Malaysia
40450 Shah Alam, Malaysia
3Faculty of Electrical Engineering, Universiti Teknologi MARA Malaysia
40450 Shah Alam, Malaysia 4
Department of Electrical Engineering, Faculty of Engineering University of Malaya, 50603 Kuala Lumpur, Malaysia
E-mail: [email protected], [email protected]
ABSTRACT
This paper presents a study on optimal location and sizing of multiple FACTS devices based on Particle Swarm Optimization (PSO) for minimization of transmission losses, and voltage profile improvement, which takes into account the cost of installation. In this study, Static Var Compensator (SVC) and Thyristor Controlled Series Compensator (TCSC) are chosen as the compensating device for the purposes of maintaining security in power system. Simulations for various loading conditions at several load buses have been conducted in order to evaluate its robustness and feasibility for broad implementation. In addition, installation of several FACTS devices into the system has been also conducted in the attempt to evaluate their impact to the system in terms of loss reduction and voltage profile improvement. Validation through the application on the IEEE 30-bus system indicated that PSO is feasible to achieve the task. Results from the study are compared with those obtained from Evolutionary Programming (EP) method in the attempt to highlight its merit.
Keywords: Flexible AC Transmission System (FACTS) device, optimal location (OL), optimal sizing (OS), power system security (PSS), particle swarm optimization (PSO).
NOMENCLATURE
l ji P l ij
P + The transmission loss of line l,
l ji
P Active power flow from bus i to bus j of
line
l ji
P Active power flow from bus j to bus i of
line l
NL Number of transmission line.
IC Cost of installation of FACTS device (US$)
C Cost of FACTS device (US$/KVar)
S The operating range of the FACTS device (MVar)
CS, CT (US$/kVar)
Q1 Reactive power flow through the branch
before FACTS device installation.
Q2 Reactive power flow through the branch
after FACTS device installation. XLine The reactance of the transmission line rtcsc The coefficient which represents the
degree of compensation by TCSC
vi k+1
Velocity of particle i at iterations.
w Weight function.
c1,c2 Weight coefficient
rand1, rand2 Random number between 0 and 1 si k Current position of particle i at iteration k Pbesti Best position of particle i th up to the
current iteration
Gbesti Best overall position found by the particles
up to the current iteration.
wmin Minimum weight equal to 0.4
itermax Maximum iteration number
iter Current iteration number
1. INTRODUCTION
Electric utilities are forced to manage the systems close to their thermal and stability limits due to major hurdles such as environmental, right-of-way and cost problems for the power transmission network expansion. Hence, there is an interest in better utilization of available capacities by installing Flexible AC Transmission Systems (FACTS) Devices such as static var compensator, thyristor controlled series compensator, thyristor controlled phase angle regulators and unified power flow controller. FACTS device by supervising the power flow in the network, can help to decrease the flows in heavily loaded lines, resulting in raised loadability, low system loss, improved stability of the network, reduced the cost of production and fulfilled contractual requirement. They can enable lines to flow the power near its nominal rating and maintain its voltage within the desired level while enhancing power system security during contingencies [1-5]. For a meshed network, an optimal location of FACTS device allows to control its power flow and also to improve the system loadability and the security [1]. The effect of FACTS device on power system security, realiability and loadability has been studied according to proper control objectives as reported in [4], [6-9]. Researchers have tried to find suitable location for FACTS device to improve power system security and loadability in [10-13].
The security of power system can be defined as its ability to withstand a set of severe but credible contingencies and to survive transition to an acceptable new steady state condition as reported in [14]. Security of a power system also refers to the degree of risk in its ability to survive imminent disturbances (contingencies) without interruption to customer service. It relates to robustness of the system to imminent disturbances and, hence, depends on the system operating condition as well as the contingent probability of disturbances as highlighted in [15].
This paper mainly focuses on the determination of optimal locations and sizings of multiple FACTS device using Particle Swarm Optimization (PSO), and Evolutionary Programming (EP) algorithm. The
installation of FACTS device into the busdata or linedata system which directly affects the power flow solution in a system has been investigated. Tests were performed on the IEEE-30 bus system to realize the effectiveness of the proposed technique, while verification was conducted through comparative studies with EP.
2. POWER SYSTEM SECURITY
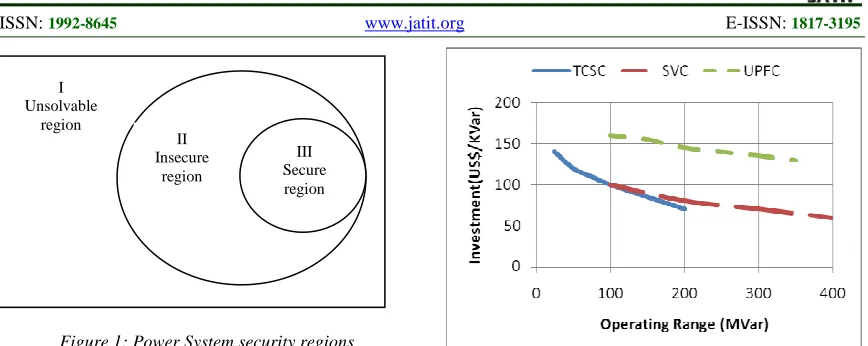
The power system networks have become more heavily loaded due to increase in load and larger interconnection, there will be a rise in the number of situation where power flow equations have either no real solution (unsolvable limits) or solution with violating operating limits such as voltage limits; especially, in contingency analysis and planning applications. The solution of the power flow problem has received much consideration over the last several decades. This is expected to its fundamental importance to power system analysis. Nevertheless, little attention has been focused on how to pick up situation where power flow equations have no real solutions and any attempt to operate the system there, probably results in the system instability and voltage collapse.
The non-convergence of any power flow method is usually not guaranteed as an unsolvable case. This situation cloud is due to either a poor initial guess or a case where no real solution exists. The later cases will be referred as unsolvable rather than no contingent to emphasize that be a problem is not just that a power flow did not converge, but rather than no solution exists.
Figure 1: Power System security regions
3. PROBLEM FORMULATION
This section describes the problem formulation of single objective function using PSO and EP under loading conditions at several load buses in the system.
3.1 Objective Function
The objective function is in term of the transmission loss. Mathematically, it is formulated as follows:
(1)
3.2 Cost Function of FACTS Device.
Optimal placement and sizing of FACTS device considering the cost of installation of FACTS device has been mathematically formulated and is given by equation (2):
1000 S C
IC= × × (2)
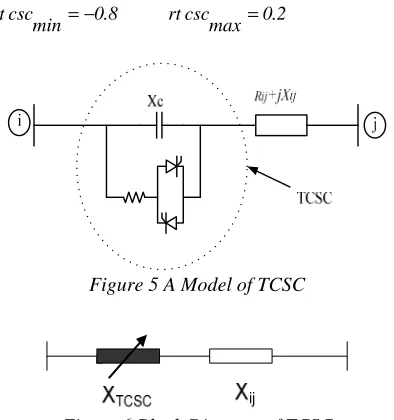
Using database of [16], cost function for SVC and TCSC are shown in Figure 2 and modeled as follows:
For SVC:
38 . 127 S 3051 . 0 2 S 0003 . 0 S
C = − + (3)
For TCSC:
7 . 153 S 7130 . 0 2 S 0015 . 0 T
C = − + (4)
1 Q 2 Q |
S= −
(5)
Figure 2 Cost Function of the FACTS devices: SVC, TCSC and UPFC.
4. MODELING OF FACTS DEVICE
In this research, two different FACTS devices have been selected to be installed at the suitable location. The optimal sizing is meant to reduce the transmission loss of the system. These devices are: SVC (Static Var Compensator) and TCSC (Thyristor Controlled Series Compensator). Power flow through the transmission line i-j namely Pij which depends on the line reactance, Xij,
the bus voltage magnitudes Vi, and Vj, and phase
angle between sending and receiving buses δi and δj, is expressed by (6).
( )
sin i X
V V P
j i j
j i
ij = δ −δ (6)
TCSC can change line reactance and SVC can be used to control the bus voltage. Power flow can be controlled and optimized by changing power system parameter using FACTS devices. Therefore, optimal device, allocation and sizing of FACTS device can result in suitable utilization of power system [17].
In this paper, steady state model of FACTS device are developed for power flow studies. SVC is modeled using the power injection model. TCSC is modeled simply to just modify the reactance of transmission line.
4.1 Static Var Compensator (SVC)
SVC can be used for the both inductive and capacitive compensation. In this research, SVC is modeled as an ideal reactive power injection at bus
i as shown in Figure 3 and Figure 4. The SVC
consists of a combination of a fixed capacitors and reactors. Thyristor switched capacitors and thyristor controlled reactors (TCR) in parallel with the power system. From an operational point of view, the SVC behaves like a shunt connected variable
I Unsolvable
region
II Insecure
region
reactance, which either generates or absorbs reactive power in order to regulate the voltage magnitude at the point of connection to the AC network. It is used extensively to provide fast reactive power and voltage regulation support. The TCR is reactive impedance, XL, with a bidirectional
thyristor valves. The controllable reactance of the TCR part is XV, which is defined by (7).
) 2 sin( 2 2 L X X
V π α α
π + −
= (7)
where α is the firing angle of the thyristor.
The SVC equivalent susceptance is [18],
(
)
(
)
L X C X ) 2 sin( 2 C X L X B SVC α α ππ − +
−
= (8)
and the reactive power equation is
SVC B 2 i V SVC i
Q =− (9)
Figure 3 Model of SVC
Figure 4 Block diagram of SVC
4.2 Thyristor Controlled Series Compensator (TCSC)
The model of the network with TCSC is shown in Figure 5 and Figure 6. The TCSC consists of a capacitor bank and a thyristor controlled inductive branch connected in parallel and series connected to the transmission line. The controllable reactance,
XTCSC, is directly used as the control variable that
can be determined by:
(
)
[
2 sin(2αi]
XX X X X L C L C TCSC − + − = α π π (10)
The power flow equation of the branch can be derived as follows [17]:
)] j δ i δ sin( ij b ) j δ i δ cos( ij g [ j V i -V ij g 2 i V ij
P= − + − (11)
)] j δ i δ cos( ij b ) j δ i δ sin( ij g [ j V i -V ij b 2 i V ij
Q =− − − − (12)
where
(
)
2 TCSC X ij x 2 ij r ij r ij g + + = ,(
)
2 TCSC X ij x 2 ij r TCSC X ij x ij b + + + − =The rating of TCSC depends on the reactance of the transmission line where the TCSC is located:
, TCSC X Line X X
ij = +
, line X csc rt TCSC
X = ⋅ (13)
To avoid overcompensation, the working range of the TCSC is chosen between -0.8XLine and 0.2XLine
[17, 18]. 8 . 0 min csc
rt =− 0.2
max csc
[image:4.612.107.526.58.723.2]rt =
Figure 5 A Model of TCSC
[image:4.612.319.516.498.708.2]5. OPTIMIZATION TECHNIQUES
In this section, the fundamental of PSO and EP algorithms and the ways how to relate FACTS device variables with PSO, and EP parameters will be explained briefly. The new category of computational intelligence tools has emerged to cope with some the conventional methods algorithms shortcomings. The modern techniques include genetic algorithms (GA), evolutionary programming (EP), artificial neural network (ANN), simulated annealing (SA), ant colony optimization (ACO), particle swarm optimization (PSO) and artificial immune system (AIS). These techniques have been successfully applied to a wide range of optimization problems in which global solutions are more preferred than local ones. Also, they are known for their capabilities of fast search of large solution spaces and ability to account for uncertainty in some parts of the power system networks [19].
5.1 Particle Swarm optimization (PSO)
PSO algorithm was originally developed by Kennedy and Eberhant based on the social behaviors of animal warms. PSO is developed through simulation of bird flocking or fish schooling in two-dimensional space. The position of each particle is represented by its x, y axis position and also its velocity is expressed by v (the velocity of x axis) and vy (the velocity of y axis). Modification of the particle position is realized by the position and velocity information. Bird flocking optimizes a certain objective function. Each particle has known its value as Pbest and its x, y position.
This information is an analogy of the personal experience of each particle. In addition, each particle knows the best value in the group is Gbest
among Pbest. This information is an analogy of the
knowledge of how the other particles around them have performed. Each particle tried to modify its position using the following information: the current position (x, y), the current velocities (vx,
vy), the distance between the current position and Pbest, and the distance between the current position
and Gbest [20]. The main advantage of swarm
intelligence techniques is that they are impressively resistant to the local optimal problem. Also, PSO is employed mostly because it is simple in concept, easy to implement, efficient and a flexible mechanism to enhance global and local exploration abilities. From [21], the main merits of PSO are simplicity in concept implementation, computationally efficient, and robustness to control parameters. The step by step algorithm for the
proposed optimal location and sizing of FACTS device is given below:
Step 1: Set the loads condition, Qload at weak bus
before FACTS devices installation (base case value). Set the loss and voltage constraints, i.e loss1
≤ loss_0 and voltage1≥ voltage_0. This is to ensure
that all the generated initial populations satisfy all the equality and inequality constraints.
Step 2: Initialize the related parameters, such as the population size, the size of particle, the maximum number of iteration, and the power flow data included linedata and busdata system.
Step 3: An initial population is randomly generated to consider the variable that should be optimized (the locations, and the sizings of multiple FACTS devices). The random numbers, x as a control variables of multiple FACTS devices (x1, x2, … x nm)
where x1, … x5 are the locations of multiple FACTS
device and x6, … x10 are the sizings of multiple
FACTS devices. 11
= nm x 2 n x 1 n x m 1 x 12 x x ] at X [ L M M M M L (14)where: n is population size
Step 4: Calculate fitness I. Fitness is computed for each particle. Determine the Pbest old and Gbest old
value and it is stored in ascending order to the purpose of minimization of loss. Pbest_old = min(x1, …x10)_old and Fitness 1= Lossmin_old
Step 5: Update the velocity and position of the particle according the equations (15), (16) and (17). Velocity of each particle can be modified by using (15) [22-24]:
k) i s i best G ( 2 rand 2 c ) k i s i best P ( 1 rand 1 c v w 1 k i v − × × + − × × + × = + (15)
Weight function is given by (16) [25], [22-23], [26-28]: iter iter w w w w max min max max × − −
= (16)
The new position can be modified using (17):
1 k i v k i s 1 k i
Step 6: Calculate the fitness 2 and determine the
Pbest_new and Gbest_new value and it is stored. Pbest_new = min(x1,…x10)_new and fitness 2=Lossmin_new.
Step 7: Convergence criterion. The convergence criterion determined by Lossmin_new<<Lossmin_old. If
not, repeat Steps 5 – 7 until stopping criterion, as such sufficiently excellent Lossmin fitness or a
maximum numbers of iteration is met.
Step 8: Calculate the cost of installation multiple FACTS devices using the equations (2) – (5).
Step 9: End the PSO process.
5.2 Evolutionary Programming (EP)
The EP is one of the artificial intelligence techniques which were aspired from natural selection process to find the global optimum of complex problem [29]. Its evolutionary algorithms are based on computational models of fundamental evolutionary processes such as initialization, mutation, selection and reproduction. This method has been thoroughly discussed since its introduction by Fogel in 1960 [30]. In [31], proposed EP to determine the optimal location of FACTS devices for maximizing the total transfer capability (TTC) of power transaction between source and sink area in deregulated power system. EP simultaneously searches for FACTS locations, FACTS parameters, and real power generations, real power loads in sink area and generation bus voltages. In [32], proposed algorithm for solving security constrained optimal power flow problem through the application of EP. In this work, the implemented EP technique can be described as follows:
Step 1: Set the loads condition, Qload at weak bus
before FACTS installation. Set the loss and voltage constraints, i.e loss1 ≤ loss_0 and voltage1≥ voltage_0. This is to certify that all the generated
initial populations satisfy all the equality and inequality constraints.
Step 2: Initialize the related parameters, such as the population size, the maximum number of iteration, and the power flow data included busdata and linedata system.
Step 3: An initial population is randomly generated to consider the variable that should be optimized (the location and the sizing of multiple FACTS device) such as equation (14). The variable, t indicates is population size from a set of random
distributions ranging from min
tn
x
to max
tn
x … to max
9 tn x min 9 tn
x + + .
Step 4: Calculate the fitness I by running ac load flow program to evaluate transmission loss values. Determine minimum loss and maximum loss for statistical evaluation. Fitness for each variable in the population is evaluated. In this research, the objective function would not be a single mathematical equation but rather a subroutine which was executed accordingly in the EP main program. Eventually, evaluation of maximum, and minimum, of fitness is carried out, which will be utilized in the mutation process.
Step 5: Mutate the parent and generate offsprings. During mutation, the Gaussian mutation operator is performed to generate new population (offspring) to the selected individual, xi,j randomly by using a
standard deviation, where γ which is the square root of the variance. The mutation process was implemented based on the following equation
) ,
2 2
−
=
+ = + max 1 min j max jf
f
)
x
x
(
β
0 ( N i,j x j , m i xγ
γ
(18)The β value can be manually adjusted to achieve better convergence. The lower value of β, convergence of EP is expected to occur more quickly vice versa. Also, it is represented in the following detail:
= nm 2 n 1 n m 1 12 11 ] at [λ
λ
λ
λ
λ
λ
λL
M
L
M
M
L
(19)Step 6: Recalculate the fitness II using the offsprings. Calculate the fitness II by running ac load flow program to evaluate transmission loss values. Resolve minimum loss and maximum loss for statistical evaluation.
[ ]
=
at at
x
λ
Γ
(20)Thus:
=
nm 2
n 1 n
m 1 12
11
nm 2
n 1 n
m 1 12
11
x
x
x
x
x
x
λ
λ
λ
λ
λ
λ
Γ
L
M
M
M
M
L
L
M
M
M
M
L
]
[ (21)
Matrix size = [2t × 2]
Step 8: Perform selection by a tournament process. EP employs a selection through the tournament scheme as to choose the survivals to the next generation. This selection is used to identify the candidates that can be transcribed into the next generation, and the others will be removed from the pools. The process continues until the solution converges.
Step 9: Convergence test is important to determine the stopping criteria of the evolution. The pre-determined accuracy is normally dependent on the problem orientation. The convergence criterion is defined as the difference between the maximum and minimum fitness of the objective function. The optimal solution is achieved when there is no significant changed between the new generation and the last generation. The fitnessmax and fitnessmin
represent the maximum and minimum values of the objective function inside a given parent generation. The mathematical equation is given as follows:
0.01 ≤ −
min fitness max
fitness (22)
Step 10: Calculate the cost of installation for multiple FACTS device using equations (2) – (5)
Step 11: End the EP process.
6. RESULTS AND DISCUSSIONS
In order to realize the effectiveness of the proposed PSO and EP technique, the IEEE 30-Bus System was tested to determine the placement and sizing of multiple FACTS device. The busdata and linedata of the IEEE 30-Bus System are given in [20]. The parameters of the optimization algorithm are listed in Table I [26,] [33], [22], [23]. The FACTS device installations in the power system the for the transmission loss minimization in the system
have been conducted at several load conditions subjected to bus 26 and bus 29.
Table 1: Parameters of Optimization Techniques
Parameters PSO
Population Size 20
Inertial Weight, w 0.4 until 0.9
c1 3
c2 3
Number of iteration 100
rand1 0 to 1
rand2 1 to 1
6.1 Case 1: Installation of Multiple SVCs with Load Variation at Bus 26
6.2 Case 2: Installation of Multiple TCSCs with Load Variation at Bus 26
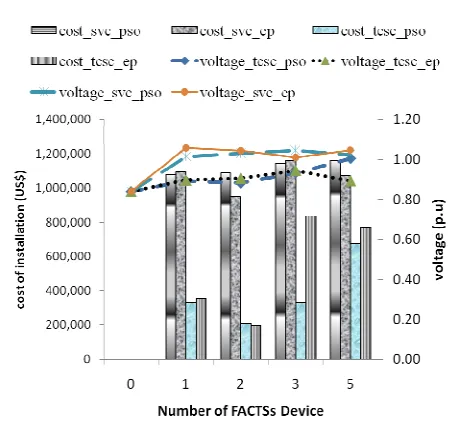
Result for transmission loss reduction when bus 26 is subjected to load variation until 20MVar are tabulated in Table IV and Table V. The location and sizing of TCSCs to achieve loss reduction at 20MVar can be referred to the same table. The results for numbers, locations, and sizings of TCSCs to minimize transmission loss with 20MVar at bus 26 using PSO technique are tabulated in Table IV. For instance, the transmission loss reduced to 19.6910MW when five units of TCSCs are installed in the system. In order to achieve this value, the locations of TCSCs are line-5, line-34, line-17, line-26, line-34 and line-26 which the sizing for TCSCs are 0.3649p.u, 0.1033p.u, -0.1224p.u, -0.3383p.u., and -0.0787p.u. Besides that; at the same loading condition, the EP technique can only manage to reduce the
transmission loss to 19.9687MW when three units of TCSCs are installed as tabulated in Table V. In order to achieve this value, the location of TCSCs are line-39, line-34 and line-36 with the TCSCs sizing of 0.0435p.u., -0.2205p.u, and -0.4090p.u. From Table II until Table V: installation of SVCs at load bus is found to be the most suitable to achieve the best performance in transmission loss reduction optimized using PSO. Figure 7 shows the results of cost of installation for FACTS devices and voltage profile at to 20MVar load subjected to bus 26. From the graph it is shown that with the installation of TCSCs at load bus the cost less than SVC installation. However, with the SVC installation at load bus system the voltage profile improvement is better with TCSCs installation. With the SVCs installation, the voltage profile increases greater
than 1.00p.u.
Table II: Results of Location and Sizing of SVCs when Qd26 = 20MVar Using PSO Technique.
LOSS (MW) Qty SVCs LOCATION (Bus) SVCs SIZING (MVar)
20.3393 0
17.5543 1 27 19.6377
17.6641 2 26 25 16.9737 14.0775
17.5009 3 24 26 26 13.1069 97.1346 22.3052
17.4727 5 24 26 18 26 11 13.7442 19.4690 90.4474 18.6605 5.0615
Table III: Results of Location and Sizing of SVCs when Qd26 = 20MVar Using EP Technique.
LOSS (MW) Qty SVCs LOCATION (Bus) SVCs SIZING (MVar)
20.3393 0
17.6154 1 26 15.9568
17.6882 2 26 26 44.1012 15.1048
17.5542 3 26 29 29 8.2638 89.4036 6.0064
17.6097 5 25 26 26 26 20 6.7310 46.2952 49.1343 11.5493 12.4869
Table IV: Results of Location and Sizing of TCSCs when Qd26 = 20MVar Using PSO Technique.
LOSS
(MW) unit TCSC locations (line) TCSCs SIZING (p.u)
20.3393 0
19.8915 1 35 -0.5474
20.0914 2 36 5 -0.3608 -0.0645
20.0755 3 25 21 34 -0.4006 -0.0875 -0.0768
[image:8.612.81.524.633.704.2]19.6910 5 34 17 26 34 26 -0.3649 0.1033 -0.1224 -0.3383 -0.0787
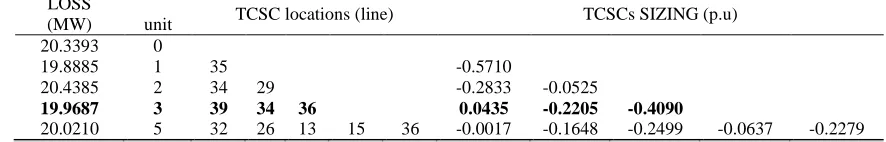
Table V: Results of Location and Sizing of TCSCs when Qd26 = 20MVar Using EP Technique.
LOSS
(MW) unit TCSC locations (line) TCSCs SIZING (p.u)
20.3393 0
19.8885 1 35 -0.5710
20.4385 2 34 29 -0.2833 -0.0525
19.9687 3 39 34 36 0.0435 -0.2205 -0.4090
Figure 7 Results of Cost of Installation FACTS Device and Voltage Profile Improvement at Qd26=20MVar
6.3 Case 3: Installation of Multiple SVCs with Loading Variation at Bus 29
Result for transmission loss reduction when bus 29 is subjected to load variation until 20MVar are tabulated in Table VI and Table VII. The number, location and sizing of SVCs to achieve loss reduction at 20MVar can be referred to the same table. The results for number, location, and sizing of SVCs to minimize transmission loss with 20MVar at bus 29 using PSO technique are tabulated in Table VI. For instance, the transmission loss reduced to 17.4928MW when three units of SVCs are installed in the system. In order to achieve this value, the locations of SVCs are bus 29, bus 22, and bus 29, with SVCs sizing of are 57.4949MVar, 13.4347MVar and 24.12MVar. Besides that; at the same loading condition, the EP technique can minimize the transmission loss to 17.4910MW when three units of SVCs are installed as tabulated in Table VII. In order to achieve this value, the locations of SVCs are bus 29, and bus 21 with SVCs sizing of 21.2509MVar, 63.0519MVar and 13.5685MVar.
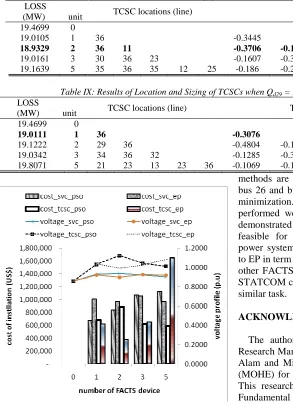
[image:9.612.73.300.90.302.2]and sizing of TCSCs to achieve loss reduction at 20MVar can be referred to the same table. The results for number, location, and sizing of TCSCs to minimize transmission loss with 20MVar at bus 29 using PSO technique are tabulated in Table VIII. For instance, the transmission loss reduced to 18.9329MW with two units of TCSCs being installed at the transmission line in the power system. In order to achieve this value, the locations of TCSCs are line-36 and line-11 with TCSCs sizing of -0.3706p.u, and -0.1538p.u. Besides that; at the same loading condition, the EP technique can minimize the transmission loss to 19.0111MW with one unit of TCSC is installed as tabulated in Table IX. In order to achieve this value, the location of TCSC is line-36 which the sizing of TCSC is -0.3076p.u. From Table VI until Table IX: installation the SVCs at load bus system is found to be the most suitable to achieve the best performance in transmission loss reduction optimized using EP. Figure 8 shows the results of cost of installation of FACTS device and voltage profile when the load increases to 20 MVar at bus 29. Similar phenomenon is observed as those for bus 26. From the graph it is shown that with installation of TCSCs at load bus the cost is less than SVC installation. However, with the SVC installation at load bus system the voltage profile improvement is better with TCSCs installation. With the SVCs installation, the voltage profile increases greater than 1.00p.u.
Table VI: Results of Location and Sizing of SVCs When Qd29 = 20MVar Using PSO Technique
LOSS
(MW) unit SVCs LOCATION (Bus) SVCs SIZING (MVar)
19.4699 0
17.5578 1 30 23.5453
17.9635 2 27 29 33.4985 23.5477
17.4928 3 29 22 29 57.4949 13.4347 24.1200
[image:9.612.99.516.650.730.2]Table VII: Results of Location and Sizing of SVCs when Qd29 = 20MVar Using EP Technique.
LOSS (MW) unit SVCs LOCATION (Bus) SVCs SIZING (MVar)
19.4699 0
17.5620 1 29 24.6541
17.6229 2 29 21 16.2199 7.1064
17.4910 3 29 21 21 21.2509 63.0519 13.5685
[image:10.612.75.368.213.616.2]18.2336 5 29 22 27 26 28 17.7123 36.7862 10.6258 12.9039 18.7038
Table VIII: Results of Location and Sizing of TCSCs when Qd29 = 20MVar Using PSO Technique.
LOSS
(MW) unit TCSC locations (line) TCSCs SIZING (p.u)
19.4699 0
19.0105 1 36 -0.3445
18.9329 2 36 11 -0.3706 -0.1538
19.0161 3 30 36 23 -0.1607 -0.3096 -0.2670
19.1639 5 35 36 35 12 25 -0.186 -0.2024 0.0304 -0.1071 -0.1730
Table IX: Results of Location and Sizing of TCSCs when Qd29 = 20MVar Using EP Technique.
LOSS
(MW) unit TCSC locations (line) TCSCs SIZING (p.u)
19.4699 0
19.0111 1 36 -0.3076
19.1222 2 29 36 -0.4804 -0.1932
19.0342 3 34 36 32 -0.1285 -0.3215 -0.4329
19.8071 5 21 23 13 23 36 -0.1069 -0.1380 0.0862 -0.5638 -0.3944
Fig 8 Results of Cost of Installation FACTS Device and Voltage Profile Improvement at Qd29=20MVar
7. CONCLUSION
This paper has presented the application of particle swarm optimization and evolutionary programming techniques for loss minimization, voltage profile improvement and multiple FACTS devices installation cost. In this study, PSO, and EP
methods are applied when loads are subjected to bus 26 and bus 30 of IEEE 30-Bus system for the minimization. Both the PSO and EP techniques performed well in most cases. Simulation results demonstrated that the proposed PSO technique is feasible for loss minimization scheme in other power system network. However, PSO is superior to EP in term of loss minimization. For future work, other FACTS devices such as UPFC, TCPAR and STATCOM can be incorporated together to achieve similar task.
ACKNOWLEDGEMENT
The authors would like to acknowledge The Research Management Institute (RMI) UiTM, Shah Alam and Ministry of Higher Education Malaysia (MOHE) for the financial support of this research. This research is supported by MOHE under the Fundamental Research Grant Scheme (FRGS) with project code: 600-RMI/ST/FRGS 5/3/Fst (163/2010).
REFERENCES
[2] M.Noroozian, L.Angquist, M.Ghandhari, G.Anderson, Improving Power System Dynamics by Series-connected FACTS Devices, IEEE. Trans. on Power Delivery, Vol. 12, No.4, October 1997.
[3] M.Noroozian, L.Angquist, M.Ghandhari, Ghderson, Use of UPFC for Optimal Power Flow Control, IEEE Trans. on
Power Delivery,Vo 1.12, No.4, October
1997.
[4] Saleh Aboreshaid, Impact of Unified Power Flow Controllers on Power System Reliability, IEEE Trum. on Power Systems
Vol. 15, No. 1, February 2000.
[5] Roy Billinton, Mahmud Fotuhi-Firuzabad, Sherif Omar Faried, James A. Momoh, Jizhong 2. Zhu, Garfled D. Boswell, Stephen Hoffman, Power System Security Enhancement by OPF with Phase Shifter,
IEEE Truns. on Power Systems, Vol. 16,
No.2, May 2001.
[6] Sung-Hwan Song; Jung-Uk Lim; Seung-Il Moon, FACTS operationscheme for enhancement of power system security,
Power Tech Conference Proceedings, 2003 IEEE Bologna Volume 3, 23-26 June
2003 Page(s):36 - 41 Vol.3
[7] Singh, J.G. Singh, S. N.Srivastava, S.C, Placement of FACTS controllers for enhancing power system loadability,
Power India Conference, 2006 IEEE
10-12 April 2006 pp. 7.
[8] Thukaram, D. Jenkins, L.Visakha, K, Improvement of system security with unified-power-flow controller at suitable locations under network contingencies of interconnected systems, Generation,
Transmission and Distribution, IEE
Proceeding Volume 152, Issue 5, 9 Sept.
2005 pp.682 – 690.
[9] Baghaee, H.R, Vahidi, B, Jazebi, S, Gharehpetian, G.B, Kashefi, A, Power System Security Improvement by Using Different Evolution Algorithm Based FACTS Allocation, International
Conference on Power System Technology and IEEE Power India Conference, 2008.
POWERCON 2008. pp. 1 – 6.
[10]F.D.Galiana, K.Almeida, M.Toussaint, J.Griffin and D.Atanackovic, Assessment and Control of the Impact of FACTS Devices on Power System Performance,
IEEE Trans. Power Systems, Vol. 11, No.
4, Nov 1996.
[11]Thukaram, D.; Jenkins, L.; Visakha, K, Improvement of system security with unified-power-flow controller at suitable locations under network contingencies of interconnected systems, Generation,
Transmission and Distribution, IEE
Proceeding Volume 152, Issue 5, 9 Sept.
2005 Page(s):682 – 690.
[12]K.S. Verma, S.N.Singh, and H.O. Gupta, Location of Unified Power Flow Controller for Congestion Management,
Electric Power System Research, Vol. 58,
pp 89-96, 2001.
[13]S.Gerbex, R. Chekaoui, A.J.Germond, Optimal Location of Multi-type FACTS Devices in a Power System be Means of Genetic Algorithm, IEEE Trans, Power
Systems, Vol. 16, pp. 537-544, August.
2001.
[14]S.N.Singh, Location of FACTS Devices for Enhancing Power Systems’ Security,
Conference on Power Engineering, 2001.
LESCOPE '01. 2001 Large
Engineering Systems, pp. 162 – 166.
[15]Kundur, P, Paserba, J. Vitet, S, Overview on Definition and Classification of Power System Stability, CIGRE/IEEE PES
International Symposium
Quality and Security of Electric Power Del ivery Systems (CIGRE/PES) 2003, pp. 1 -
4.
[16]Allen J. Wood, Bruce F. Wollenberg,
Power Generation, Operation, and
Control, John Wiley & Sons, Inc., pp
430-432, 1996.
[17]Biansoongnern. S, Chusanapiputt. S,
Phoomvuthisarn, S,
Optimal SVC and TCSC Placement for Mi nimization of Transmission Losses, International Conference on Power System
Technology, PowerCon 2006. 2006, pp. 1
– 5.
[18]L.J.Cai, I.Erlich, Optimal Choice and Allocation of FACTS devices in Deregulated Electricity Market using Genetic Algorithms, IEEE PES Power Systems Conference and Exposition, 2004, 10-13 Oct. 2004, pp. 201 - 207 vol.1 [19]M.R. Al Rashid, M.E. El-Hawary,
Applications of computational intelligence techniques for solving the revived optimal power flow problem, Electric Power
Systems Research 79(2009) 694-702.
[20]Kwang Y. Lee, Mohamed A. El-Sharkawi,
Techniques, (Institute of Electrical and
Electronics Engineers, Inc. 2008). [21]S. Gerbex, R. Cherkaoui, and A. J.
Germond, "Optimal location of multi-type FACTS devices in a power system by means of genetic algorithms, IEEE Trans.
Power Systems, vol. 16, pp. 537-544,
August. 2001.
[22]Saravanan. M, Slochanal. S.M.R, Venkatesh. P, Abraham, P.S, Applications of PSO Technique for Optimal Location of FACTS Devices Considering System Loadability and Cost of Installation, the 7th
International Power Engineering
Conference (IPEC). Pp. 716 - 721 Vol. 2
2005.
[23]G.I.Rashed, H.I.Shaheen, S.J.Cheng, Optimal Locations and Parameters Settings of Multiple TSCSs for Increasing Power System Loadability Based on GA and PSO techniques, The Third IEEE
International Conference on Natural Computation (ICNC 2007), 2007.
[24]Sundareswaran. K, Hariharan. B, Parasseri. F.P, Antony. D.S and Subair. B, Optimal Placement of Static VAr Compensators (SVC’s) Using Particle Swarm Optimization, International Conference on Power, Control and Embedded Systems (ICPCES), 2010 , pp. 1
– 4, 2010.
[25]Phashant Kumar Towari, and Tog Raj Sood, Optimal Location of FACTS Devices in Power System Using Genetic Algorithm, IEEE World Congress on
Nature and Biologically Inspired
Computing (NaBIC 2009), 2009.
[26]Nor Rul Hasma Abdullah, Ismail Musirin, Muhammad Murtadha Othman, Static VAR Compensator for Minimizing Transmission Loss and Installation Cost Calculation, Australian Journal of Basic
and Applied Sciences, 4(4): 646-657,
2010.
[27]T. T. Lie, and W. Deng, Optimal Flexible AC Transmission System (FACTS) devices Allocation, Electrical power &
Energy System, vol. 19, No. 2, pp.
125-134, 1997.
[28]S. Auchariyamet, and S.Sirismrannukul, Optimal Reactive Power Planning with FACTS Devices by Particle Swarm Optimization, 8th International conference on Advances in Power System Control,
Operation and Management (APSCOM 2009), 2009, pp. 1 – 6. 2009.
[29]G. B. Fogel and D.B. Fogel, Continuous Evolutionary Programming: Analysis and Experiments, an International Journal of
Cybernetics and Systems, Vol. 26, 1995,
pp. 79-90.
[30]G. Wei, Comparison Study of Genetic
Algorithm and Evolutionary
Programming, The Third International
Conference on Machine Learning and Cybernetics, Vol. 1, No. 1, 2004, pp.
204-209.
[31]W. Ongsakul, and P. Jirapong, Optimal allocations of FACTS devices to enhance total transfer capability using evolutionary programming, International Symposium on
Circuits and Systems, Japan, 23-26 May
vol. 5 pp. 4175-4178, 2005.
[32]Ismail Musirin, Nur D. M. Radzi, Muhammad M. Othman, Mohamad K.Idris and Titik K.A Rahman, Voltage Profile Improvement Using Unified Power Flow Controller via Artificial Immune System, WSEAS TRANSACTION on POWER SYSTEMS, Issue 4, Volume 3, April 2008.
[33]R. Mohamad Idris, A. Khairuddin, M.W.Mustafa, A.Kalam, Optimal Allocation of Multi-Type FACTS Devices Using BEE Algorithms for ATC Enhancement in Deregulated Power System, International Review of Electrical
Engineering (IREE), vol.5 n. 2, April 2010.
[34]Jumaat.S.A, Musirin. I, Murtadha. O.M., Mokhlis. H, PSO Based Technique for Loss Minimization Considering Voltage Profile and Cost Function, The 5th
International Conference Power
Engineering and Optimization (PEOCO),
2011, pp. 36 – 4.
[35]Jumaat. S.A., Musirin. I., Othman. M.M., Mokhlis. H. “Transmission Loss Minimization Using SVC Based on Particle Swarm Optimization”, The IEEE
Symposium Industrial Electronics and Applications (ISIEA 2011), 2011. pp: 419
– 424.
Conference Kuching, Sarawak, Malaysia (ENCON 2011), 2011.
[37]Jumaat. S.A., Musirin. I., Othman. M.M., Mokhlis. H, Optimal Location and Sizing of SVC Using Particle Swarm Optimization Technique, The 1st International Conference Informatics and Computational Intelligence (ICI 2011),
2011 , pp: 312 – 317
[38]N.R.H. Abdullah, I. Musirin, M.M. Othman, Transmission Loss Minimization Using Evolutionary Programming Considering UPFC Installation Cost,
International Review of Electrical
Engineering (IREE), vol.5 n. 3, May-June 2010.
[39]M.Eslami, H.Shareef, A.Mohamed, Applications of PSS and FACTS Devices for Intensification of Power System Stability, International Review of Electrical Engineering (IREE), vol.5 n. 2, April 2010
[40]M.K. Rahmat, S. Jovanovic, K.L. Lo, Reliability and Availability Modelling of Uninterruptible Power Supply Systems Using Monte-Carlo Simulation,
International Review of Electrical
Engineering (IREE), vol. 1 n. 3, August