2018 2nd International Conference on Applied Mathematics, Modeling and Simulation (AMMS 2018) ISBN: 978-1-60595-580-3
Integration Optimization of Timetable and EMU Schedule for
High Speed Railway
Shu-shan WANG
1,*, Lei-shan ZHOU
1and Han-xiao ZHOU
11School of Traffic and Transportation, Beijing Jiaotong University, Beijing 100044, China
*Corresponding author
Keywords: High-speed railway, Train diagram, Integration, EMU schedule, Optimization.
Abstract. Based on the analysis of the existing optimization model of train diagram and EMU schedule, combined with the theory and method of integration optimization, the integrated optimization model of high-speed train diagram and EMU schedule was constructed in this thesis, of which the objective function is to build the largest number of running lines between its zones. An EMU schedule plan which better satisfied the given traction plan was obtained in this thesis, using GAMS to solve the model. To test the effectiveness of the model as well as the method, the train diagram and EMU schedule scheme of Beijing-Tianjin Intercity Train was optimized and solved. The optimization results showed that for the EMU schedule of the Beijing-Tianjin line, the number of EMU trains could satisfy the actual operation of high-speed railways, while 6 more trains could be operated at the same time. This solution could provide support of high-speed railway train diagram and EMU schedule scheme for the Beijing-Tianjin line.
Introduction
Train operation diagram and EMU schedule are two basic plans of high speed railway transportation organization. The train operation diagram stipulates the specific arrival time of each train at each station in its operating section. The EMU routing plan is one of the important components of the EMU schedule. It stipulates the relationship between the train bottom turnover and the first level maintenance arrangement.
In view of the related problems of these two plans, there are large number of research results. For the compilation or optimization of train diagram, it is difficult to solve complex problems. Thus, the operation diagram is regarded as a known input condition.
Shi et al. (2011) and others considered the time interval and mileage interval of daily maintenance and first order maintenance, established an integrated optimization model of EMU application plan and maintenance plan, and designed the solution method of simulated annealing algorithm [1]. They combined the EMU connection with the station arrival and departure line operation, which designed the EMU schedule with the minimum waiting time of EMUs as the objective function [2]. In order to better describe the problems of EMU Operation Planning and maintenance planning, Wang et al. (2015) have added the main constraints to use the routing and maintenance procedures of the EMU, and they use the simulated annealing algorithm to solve the problems of EMU schedule and maintenance planning [3]. Li et al. put forward a model to solve the least target function of EMU schedule, which divide the model into two stages. Each stage is optimized only for one target, thus reducing the difficulty of solving the problem [4]. Taking the single line as the research goal, Arianna Alfieri (2006) set up a model of EMU turnover plan [5].
Statement of the Problem
optimization of train diagram and the optimization of EMU operation. The application track of the EMU vehicle bottom in the EMU utilization plan is used as the compiling plan of the train diagram.
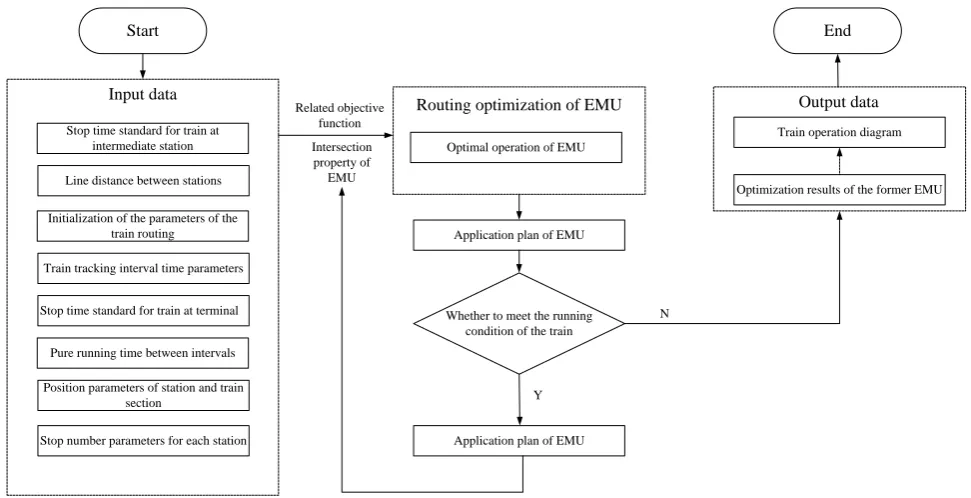
This article should solve the problem of how to arrange as many trains as possible in the train diagram under the condition of a certain number of EMU. First, we need to make decisions on the train diagram. In the case of the determination of the number of use of the EMU, the train diagram can make the overall optimal decision in the possible range by reference to the routing plan of the EMU and the performance effect of the train. The framework for its overall decision making is shown in Fig. 1.
Related objective function Intersection property of EMU
N
Y Position parameters of station and train
section
Pure running time between intervals Stop time standard for train at terminal Line distance between stations Stop time standard for train at
intermediate station
Stop number parameters for each station Train tracking interval time parameters Initialization of the parameters of the
train routing
Input data Start
Application plan of EMU Optimal operation of EMU
Optimization results of the former EMU Train operation diagram
Routing optimization of EMU
Whether to meet the running condition of the train
End
Output data
[image:2.595.54.540.184.433.2]Application plan of EMU
Figure 1. Framework map of integrated optimization.
Integrated Optimization Model of High-speed Railway Train Diagram and EMUs Operation
Symbolic Description
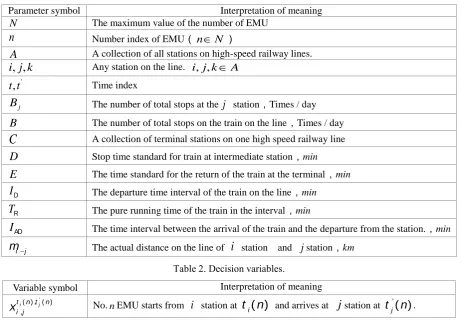
Table 1. Symbolic parameters.
Parameter symbol Interpretation of meaning
N The maximum value of the number of EMU n Number index of EMU(nN)
A A collection of all stations on high-speed railway lines.
, ,
i j k Any station on the line. i j k, , A
' ,
t t Time index
j
B The number of total stops at the j station,Times / day
B The number of total stops on the train on the line,Times / day
C
A collection of terminal stations on one high speed railway lineD Stop time standard for train at intermediate station,min
E The time standard for the return of the train at the terminal,min ID The departure time interval of the train on the line,min
TR The pure running time of the train in the interval,min
IAD The time interval between the arrival of the train and the departure from the station.,min
i j
[image:3.595.68.530.84.406.2]m The actual distance on the line of i station and jstation,km
Table 2. Decision variables.
Variable symbol Interpretation of meaning
'
( ) , ( ) , i j
t n t n i j
x No.nEMU starts from i station at ti( )n and arrives at jstation at tj'( )n .
Integrated Optimization Model of High-speed Railway Train Diagram and EMUs Operation
The first task of motor vehicle operation is to complete a given traction task. Under the premise of satisfying the condition, the more the number of interval running lines, the better the integration of high-speed railway train diagram and train operation. Therefore, in the integrated optimization model, the maximum number of interval lines is usually the target. We calculate the total interval lines Z in the following way:
' ( ), ( ) , 0
max i j
N
t n t n
i j n
Z x
, where i j, and i j, A (1)Where
𝑥𝑖,𝑗𝑡𝑖(𝑛)𝑡𝑗′(𝑛)——No. n EMU whether starts from i station at 𝑡
𝑖(𝑛) and arrives at j station at 𝑡𝑗′(𝑛).
The following method can be taken for value:
' ( ), ( ) ,
1,
, 0
i j
t n t n
i j
the construction EMU set off f
when rom i stat
otherwis
ion x
e
Subject to:
'( ), ( )
, 0
i j
N
t n t n
i j j
n
x B
, where i j, and i j, A (2)'( ), ( )
, 0
i j
j A N
t n t n
i j
j n
x B
'
'
( ) ( ) ,
( ) ( ) ,
j j j
j j j
t n t n y E when j C
t n t n y D otherwise
(4)
Where
j
y
—Whether or not the bullet train stops at the j station. The following method can be taken for value:
1
0
j
the train stops a
when t j sta
othe
tion y
rwise
( ) ( 1)
( 1) ( )
i i
i i
t n t n I
t n t n I
D
D (5)
' ,
( ), ( ) '
, ,
( )= ( ) ( ) i j
i j A
t n t n
j i i j
i j
T n t n t n x
R
where nN,i j, and i j, A (6)
'( ), ( ) '
,
( )= ( ) ( ) j j
j A
t n t n
j j j j j
j
I n t n t n x y
AD
w h e r e n (7) N
( )+ AD( ) 48 60
T n I n
R
w h e r e n (8) N' ,
( ), ( )
, ,
,
( ) i j 4000
i j A
t n t n
i j i j
i j
m n x
where nN,i j, and i j, A (9)
6 : 00
24 : 00
Earliest departure time Arrival time at the latest
(10)
The constraint condition (2) indicates that the total number of stops at all stations is not greater than the parameters 𝐵𝑗. The parameters 𝐵𝑗 vary with the j station. Constraint condition (3) indicates that the total number of stops of all trains at all stations is not greater than that of parameters B. The parameter B varies with the station set. The constraint condition (4) indicates the stopping time of the train at the j station, including four cases, that is, whether the train is reentrant at the terminal (the reentrant time standard is E) and whether the train stops at the middle station (the stop time standard is D), and the E is changed as the station is different. The constraint condition (5) indicates that the station interval time of avoiding train is less than the minimum interval time, that is, when the time and space path of the train passes through a point, the adjacent points which are not satisfied with the interval time of the point can’t be arranged by the other train space-time path. The constraint condition (6) indicates the sum of the pure running time of No. n EMU between stations. The constraint condition (7) indicates the sum of the stopping time of No. n EMU. The constraint condition (8) indicates that the total running time of No. n EMU can’t exceed 48 hours, that is, 2880min. The constraint condition (9) indicates that the total number of kilometers of No. n EMU is no more than 4000km. The constraint condition (10) indicates that the EMU's online journey time is 6:00-24:00.
Application and Analysis of Examples
Solution Tool
Basic Data
Beijing-Tianjin intercity rail has a total length of 120 km with 5 stations, which is including Beijingnan station, Yizhuang station (not yet opened), Yongle station (not yet opened), Wuqing station and Tianjin station. Beijingnan Station has Beijing EMU section, Tianjin Railway Station has the Tianjin Cao Zhuang motor vehicle operating station.
We can simplify Beijing-Tianjin intercity rail. The simplified line is shown in Fig. 2.
: The station of the EMU section : Common station
Beijingnan Wuqing Tianjin
84km 36km
Figure 2. The simplified line of Beijing-Tianjin intercity rail.
Example Illustration
There is a total of 152 trains running on this line. They stopped at the middle station for 45 times, Beijingnan Railway Station stops 77 times, Tianjin Railway Station stops 75 times. The stopping time of EMU at Wuqing Railway Station (intermediate station) is 1 min, and the shortest departure time of EMU is 5 min.
Therefore, considering the above conditions, we can simplify the solution of the model by assuming that the train departure time is chosen to be 12min. According to the actual situation, the paper designs the stop time standard of the EMU in the intermediate station is 1min, and the stopping time standard of the EMU at the terminal is 15min. The pure running time 𝑇𝑅 between
trains. Because of the night skylight time of the train, the trains have to stop at the Beijing section of the Beijingnan Station and the Tianjin Cao Zhuang train near Tianjin Station as well as the train stations and Tianjin Station so that the train can start at the same time in the south of Beijing and at the same time. After considering the actual departure condition of the train, we assume Beijingnan station is station 1, Wuqing Station is station 2, and Tianjin station is station 3. The first train emits from Beijingnan Station at 6:01. Thus, we set t1(1)=6:01. The first train from Tianjin Station starts
at 6:18. Thus, we set t3(1)=6:18. Considering the daily skylight, therefore, taking 6:00-24:00 time
section as an example, the train timetable of Beijing-Tianjin intercity rail is solved by GAMS.
The Result and Analysis of the Solution
We write GAMS program code, and run it in GAMS software, then you can find the result. By summarizing the above data, we can see that when the number of EMU is 9 groups, there are 80,48,78 trains sent in Beijingnan, Wuqing and Tianjin. When the number of EMU is reduced to 8 groups, there are 76,45,78 trains sent in Beijingnan, Wuqing and Tianjin. The plan can’t satisfy the actual situation of the 77 trains sent by Tianjin.
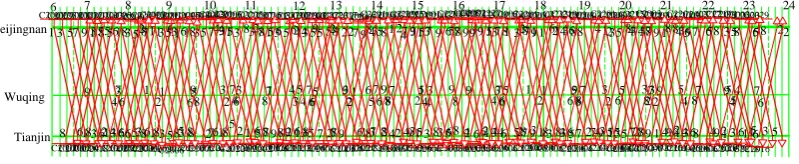
Thus, we can output the data for the set of EMUs is 9. And we get the train schedule of Beijing-Tianjin Intercity rail when the number of EMU is 9. When we draw the Beijing Tianjin Intercity EMU turnover plan (Fig. 3) to the running map, we can get the EMU road map (Fig. 4) when the EMU is used in 9 groups.
Beijingnan
Wuqing
Tianjin
6 7 8 9 10 11 12 13 14 15 16 17 18 19 20 21 22 23 C2001 1 6 24 C2004 1 6 C2002 8 3 C2201 8 3 4 C2003 1 6 C2202 1 5 6 C2006 1 6 C2203 1 5 6 2 C2204 2 3 7 8 C2205 3 7 8 4 C2206 4 5 9 C2207 5 9 6 C2208 6 7 1 2 C2209 7 1 2 8 C2210 8 9 3 4 C2211 9 3 4 C2212 1 5 6 C2213 1 5 6 2 C2214 2 3 7 8 C2215 3 7 8 4 C2216 4 5 9 C2217 5 9 6 C2218 6 7 1 2 C2005 1 6 C2220 6 7 1 2 C2007 7 2 C2222 6 7 1 2 C2223 7 1 2 8 C2224 8 9 3 C2225 9 3 4 4 C2008 5 C2227 1 5 6 2 C2010 7 2 C2219 3 7 8 4 C2012 9 4 C2221 5 9 6 C2014 1 6 C2219 4 5 1 C2016 6 2 C2009 3 8 C2018 3 8 C2011 3 8 C2020 3 8 C2013 3 8 C2022 8 C2015 1 6 C2024 3 8 C2017 2 7 C2006 8 3 C2019 1 6 C2006 5 C2003 3 8 C2006 9 4 C2003 8 3 C2006 1 4 C2003 7 2 C2006 3 8 C2001 5 C2231 5 9 6 C2202 6 7 1 2 C2201 7 1 2 8 C2202 8 9 3 4 C2201 9 3 4 C2202 1 5 6 C2201 1 5 6 2 C2202 2 3 7 8 C2201 3 7 8 4 C2202 4 5 9 C2201 5 9 6 C2202 6 7 1 2 C2201 7 1 2 8 C2202 8 9 3 4 C2201 1 5 6 2 C2202 2 3 7 8 C2201 3 7 8 4 C2202 4 5 9 C2029 5 C2006 5 C2003 5 3 C2006 8 3 C2003 5 5 C2006 5 C2003 3 8 C2006 5 C2003 7 2 C2006 5 C2001 3 8 C2002 2 7 C2003 8 3 C2006 1 6 C2003 5 C2006 3 8 C2003 9 4 C2006 8 3 C2003 8 3 C2001 7 2 C2002 3 8 C2003 5 C2006 8 3 C2003 1 6 C2006 7 2 C2003 3 8 C2006 9 4 C2003 8 3 C2006 1 6 C2003 7 2 C2006 3 8 C2003 9 4 C2006 5 C2003 3 8 C2006 9 4 C2003 5 C2006 1 6 C2002 5 C2003 5 C2006 5 C2003 7 2 C2006 1 6 C2003 5 C2006 7 2 C2003 9 4 C2006 2 7 C2003 9 4 C2006 6 1 C2003 3 8 C2006 3 8 C2003 5 C2006 5 C2003 1 6 C2006 5 C2003 5 C2001 9 4 C2002 6 1 C2003 3 8 C2006 5 C2003 3 8 C2006 9 4 C2003 5 C2006 5 C2003 5 C2006 3 8 C2003 9 4 C2006 6 1 C2003 1 6 C2006 7 2 C2003 5 C2006 1 6 C2003 7 2 C2006 3 8 C2001 1 6 C2002 6 1 C2001 5 C2202 3 4 8 9 C2001 5 C2202 5 6 1 C2001 9 4 C2202 2 3 7 8
Figure 3. The application scheme of the Beijing Tianjin Intercity EMU with 9 EMU groups.
Beijingnan
Wuqing
Tianjin
6 7 8 9 10 11 12 13 14 15 16 17 18 19 20 21 22 23
[image:6.595.100.500.75.157.2]C2001 1 6 24 C2004 1 6 C2002 8 3 C2201 8 3 4 C2003 1 6 C2202 1 5 6 C2006 1 6 C2203 1 5 6 2 C2204 2 3 7 8 C2205 3 7 8 4 C2206 4 5 9 C2207 5 9 6 C2208 6 7 1 2 C2209 7 1 2 8 C2210 8 9 3 4 C2211 9 3 4 C2212 1 5 6 C2213 1 5 6 2 C2214 2 3 7 8 C2215 3 7 8 4 C2216 4 5 9 C2217 5 9 6 C2218 6 7 1 2 C2005 1 6 C2220 6 7 1 2 C2007 7 2 C2222 6 7 1 2 C2223 7 1 2 8 C2224 8 9 3 C2225 9 3 4 4 C2008 5 C2227 1 5 6 2 C2010 7 2 C2219 3 7 8 4 C2012 9 4 C2221 5 9 6 C2014 1 6 C2219 4 5 1 C2016 6 2 C2009 3 8 C2018 3 8 C2011 3 8 C2020 3 8 C2013 3 8 C2022 8 C2015 1 6 C2024 3 8 C2017 2 7 C2006 8 3 C2019 1 6 C2006 5 C2003 3 8 C2006 9 4 C2003 8 3 C2006 1 4 C2003 7 2 C2006 3 8 C2001 5 C2231 5 9 6 C2202 6 7 1 2 C2201 7 1 2 8 C2202 8 9 3 4 C2201 9 3 4 C2202 1 5 6 C2201 1 5 6 2 C2202 2 3 7 8 C2201 3 7 8 4 C2202 4 5 9 C2201 5 9 6 C2202 6 7 1 2 C2201 7 1 2 8 C2202 8 9 3 4 C2201 1 5 6 2 C2202 2 3 7 8 C2201 3 7 8 4 C2202 4 5 9 C2029 5 C2006 5 C2003 5 3 C2006 8 3 C2003 5 5 C2006 5 C2003 3 8 C2006 5 C2003 7 2 C2006 5 C2001 3 8 C2002 2 7 C2003 8 3 C2006 1 6 C2003 5 C2006 3 8 C2003 9 4 C2006 8 3 C2003 8 3 C2001 7 2 C2002 3 8 C2003 5 C2006 8 3 C2003 1 6 C2006 7 2 C2003 3 8 C2006 9 4 C2003 8 3 C2006 1 6 C2003 7 2 C2006 3 8 C2003 9 4 C2006 5 C2003 3 8 C2006 9 4 C2003 5 C2006 1 6 C2002 5 C2003 5 C2006 5 C2003 7 2 C2006 1 6 C2003 5 C2006 7 2 C2003 9 4 C2006 2 7 C2003 9 4 C2006 6 1 C2003 3 8 C2006 3 8 C2003 5 C2006 5 C2003 1 6 C2006 5 C2003 5 C2001 9 4 C2002 6 1 C2003 3 8 C2006 5 C2003 3 8 C2006 9 4 C2003 5 C2006 5 C2003 5 C2006 3 8 C2003 9 4 C2006 6 1 C2003 1 6 C2006 7 2 C2003 5 C2006 1 6 C2003 7 2 C2006 3 8 C2001 1 6 C2002 6 1 C2001 5 C2202 3 4 8 9 C2001 5 C2202 5 6 1 C2001 9 4 C2202 2 3 7 8
Figure 4. Operation chart of Beijing Tianjin Intercity Train with 9 EMU groups.
Under the premise of using the same number of EMU, the integrated optimization scheme can send more than 6 trains. This scheme can appropriately alleviate the current density of high-speed railway traffic density and the speed limit of high-speed trains.
Conclusion
This paper constructs an integrated optimization model of train diagram and motor vehicle operation. In this paper, the integrated optimization model of high-speed railway train diagram and EMU operation is transformed into a single objective model which can be solved by GAMS software. This is convenient for the next instance to verify the feasibility of the model further.
Acknowledgement
This work is financially supported by Railway Ministry Science and Technology Projects (Grant 2016X005-D) and the Fundamental Research Funds for the Central Universities (Grant 2017JBZ001) and the Fundamental Research Funds for the Central Universities (Grant 2016YJS073).
References
[1] Shi Feng, Zhou Wenliang, Yu Yuwei, Qing Li. Optimization model and algorithm of passenger train operation plan for passenger dedicated line. Paper presented at Journal of Railway. (2011).
[2] Shi Feng, Wei Tangjian, Zhou Wenliang, Luo Xiang. Optimization method of train operation diagram for high-speed railway considering EMU turnover and arrival and departure lines. Paper presented at China Railway Science. (2012).
[3] Wang Zhongkai, Shi Tian Yun, Zhang Weijiao, Wang Hui. Integrated model and algorithm for EMU working plan and maintenance plan. Paper presented at China Railway Science. (2012).
[4] Li Hua, Han Baoming, Li Dewei, sun Baoce. EMU using the optimization method of network connection. Paper presented at Railway Transport and Economy. (2015).