0095-1137/08/$08.00⫹0 doi:10.1128/JCM.01252-07
Copyright © 2008, American Society for Microbiology. All Rights Reserved.
Multicenter Comparison of Different Real-Time PCR Assays for
Quantitative Detection of Epstein-Barr Virus
䌤
R. T. Hayden,
1K. M. Hokanson,
2S. B. Pounds,
3M. J Bankowski,
4S. W. Belzer,
5J. Carr,
1D. Diorio,
6M. S. Forman,
7Y. Joshi,
8D. Hillyard,
9R. L. Hodinka,
8M. N. Nikiforova,
6C. A. Romain,
10J. Stevenson,
11A. Valsamakis,
7and H. H. Balfour, Jr.,
2* for the U.S. EBV Working Group
Departments of Pathology1and Biostatistics,3St. Jude Children’s Research Hospital, Memphis, Tennessee; University of Minnesota Medical Center, Minneapolis, Minnesota2; Department of Microbiology, Diagnostic Laboratory Services, Inc., and the Queens and
Kuakini Health Systems, Honolulu, Hawaii4; Viromed (LabCorp) Laboratories Minnetonka, Minnesota5; Department of Pathology, Cincinnati Children’s Hospital Medical Center, Cincinnati, Ohio6; Department of Pathology, Johns Hopkins Medicine, Baltimore,
Maryland7; Departments of Pediatrics and Pathology, Children’s Hospital of Philadelphia and University of Pennsylvania School of Medicine, Philadelphia, Pennsylvania8; University of Utah School of Medicine, Salt Lake City, Utah9; University of
Minnesota Medical Center, Fairview, Minneapolis, Minnesota10; and ARUP Institute for Clinical & Experimental Pathology, Salt Lake City, Utah11
Received 21 June 2007/Returned for modification 7 September 2007/Accepted 25 October 2007
Quantification of Epstein-Barr virus (EBV) in peripheral blood is important for the diagnosis and man-agement of serious EBV diseases, including posttransplant lymphoproliferative disorder. A variety of PCR-based methods are currently in use; however, there is little information on their comparability. This study assessed the relative performance of different quantitative assays. A multicenter comparative study was performed at eight sites using three panels consisting of serial dilutions of quantified EBV DNA and extracts from a total of 19 whole-blood specimens. Samples were distributed and tested blindly. Instrumentation, probe chemistries, amplification targets, and other test-related aspects varied considerably between laboratories. Each laboratory’s calibration curve indicated strong evidence of a consistent log-linear relationship between viral load and cycle threshold, suggesting that intralaboratory tracking of a given patient would yield similar relative quantitative trends among the participating test sites. There was strong concordance among labora-tories with respect to qualitative test results; however, marked quantitative discordance was seen. For most samples, the across-laboratory interquartile range of the reported viral load (in copies/l) was roughly 0.6 log-units, and for one sample the overall range was approximately 4.2 log-units. While intralaboratory tracking of patients may yield similar results, these data indicate a need for caution when attempting to compare clinical results obtained at different institutions and suggest the potential value to be gained by more standardized testing methodology.
Epstein-Barr virus (EBV), like all members of the human herpesvirus family, persists in the host after primary infection and may reactivate at any time. EBV causes substantial mor-bidity especially among immunocompromised patients (2). Since EBV may replicate without causing apparent harm, it is important to be able to distinguish asymptomatic infection from impending or established EBV disease. Because of this, quantitative methods for measuring EBV are now widely uti-lized for the diagnosis, monitoring, and treatment of EBV-related diseases, particularly in the case of posttransplant lym-phoproliferative disorder (1, 9). In addition, studies have indicated that preemptive treatment for EBV and reduction in immunosuppressive therapy can reduce the incidence of posttransplant lymphoproliferative disorder in immunocom-promised patients (1, 7).
While the utility of molecular testing for EBV (most com-monly PCR) is well accepted (16), and many have imple-mented it on a routine basis, there is a lack of uniformity and consistency among the currently available assays. The lack of
standardized methods extends to all aspects of testing, includ-ing selection of specimen type, specimen collection methods, initial processing, nucleic acid extraction, molecular amplifica-tion, result interpretaamplifica-tion, and reporting. Within the area of assay design, relevant issues include probe chemistry, target selection, cycling conditions, internal control (selection of tar-get and mode of use), thermocycling platform, and quantitative calibration methods. Although many have moved to real-time methodologies, the implementation of these assays is by no means uniform or universal. Furthermore, and perhaps of greatest impact, there is no universally accepted quantitative standard for EBV, as has been adopted for other viruses (5, 12–14). All of these issues have grown in importance with the increased use of EBV quantitative analysis in patient manage-ment, which has become the standard-of-care in some clinical settings.
The relative effect of the different variables noted above on assay results and their impact on clinical utilization of test results when viewed over time within a given institution and when viewed across institutions have not been well defined. The optimal interpretation of studies performed at different centers using different test methodologies and the ability to monitor patients who transfer their care between different institutions becomes increasing dependent on a better under-* Corresponding author. Mailing address: MMC 437, University of
Minnesota Medical School, Minneapolis, MN 55455-0392. Phone: (612) 625-3998. Fax: (612) 625-5468. E-mail: [email protected].
䌤Published ahead of print on 7 November 2007.
157
on May 16, 2020 by guest
http://jcm.asm.org/
standing of these variables. Evaluating the sources of test vari-ability should improve our vari-ability to interpret such results and may also help establish a more uniform standard for perform-ing these tests. This multicenter study is the first published evaluation of the variability of quantitative real-time PCR for EBV across a wide variety of institutions, testing platforms, and methodologies. Whole blood was chosen over other pe-ripheral blood components for this analysis, based on data showing a higher degree of sensitivity in cellular compartments (whole blood or peripheral blood mononuclear cells) pared to plasma (3, 18). Also, whole blood was the most com-monly used specimen type for this assay among participating laboratories.
(The results of this study were presented in part 30 April to 3 May 2006 at the 22nd annual meeting of the Pan American Society for Clinical Virology, Clearwater Beach, FL.)
MATERIALS AND METHODS
Study design.Eight independent laboratories comprised the Working Group, each utilizing a different quantitative EBV PCR assay. Specimen preparation, including nucleic acid extraction, was performed prior to distribution, eliminat-ing these factors as variables in the analysis. Prior to testeliminat-ing, each laboratory provided details of its respective testing procedure(s) for comparative evalua-tion; variation was seen in all aspects of assay methodology (Table 1). Three coded panels, consisting of serially diluted, commercially prepared EBV DNA calibrators and 19 whole-blood patient specimens, were prepared, nucleic acid was extracted, and extracts were distributed among the participating laborato-ries. Each site performed quantitative EBV testing on all panels using their own protocols, reagents, controls, and instrumentation. The composition of each panel, the quantitative calibrators used, and the number of replicate test runs performed are indicated in Table 2. The data were analyzed to determine both intra- and interlaboratory variability, concordance of quantitative values achieved, and evidence of a consistent quantitative relationship among
labora-tories using both common and differing quantitative calibrators. Variability in patient results was assessed independently and in relation to variability of linear regression calibration curves and calibrators. All human samples used in the study were assigned arbitrary identification designations prior to use. This re-search complied with relevant federal guidelines and institutional policies.
Control EBV DNA.Two commercial lot numbers of fluorimetrically quantified EBV B95-8 DNA (Advanced Biotechnologies, Inc., Columbia, MA) were used to
create a six-point tenfold serial dilution series, ranging from 2.62 copies/l to
2.62⫻106copies/l to be used as quantitative calibrators. A separate dilution
was prepared for each of the three test panels that were distributed. Lot 1 was
used for panel 1; the serial dilution was centrally prepared in 0.1⫻Tris-EDTA
buffer (TE) and shipped to participants at 4°C. Lot 2 of EBV DNA was used for both panels 2 and 3. For these panels, a single known concentration of EBV DNA was prepared in reagent-grade water, lyophilized at a concentration of
2.62⫻106copies/l, and distributed to each test site for reconstitution and serial
dilution.
Patient samples.Nineteen de-identified whole blood specimens (totals of 4, 6, and 9 for the first, second, and third test panels, respectively) were studied.
Nucleic acid was extracted from multiple 200-l aliquots of each sample using a
QIAamp DNA blood minikit (Qiagen, Inc., Valencia, CA), with elution into 100
l of 10 mM Tris-Cl–0.5 mM EDTA buffer (pH 9.0). All eluates from each
sample were subsequently pooled and divided again into aliquots prior to dis-tribution to ensure the uniformity of the samples among participant laboratories. All samples were centrally prepared, de-identified, coded, and then stored at
⫺80°C until distribution and testing.
Test panel instructions and result reporting.Each laboratory was instructed to test samples using their usual standard operating procedures, reagents, and instrumentation. All samples were tested blindly, with each laboratory testing their usual number of replicates (one to three sample replicates and two to three
calibrator replicates). The results were reported in “copies EBV perl of input
DNA” and submitted to an independent facility for tabulation prior to
unblind-ing. Additional assay run data, such as cycle threshold (CT) values and calibration
[image:2.585.43.543.81.227.2]curve equations, were solicited for all panels, as were key facets of each site’s EBV quantification protocols. To assess inter-run variability, sites performed three independent runs with panel 3. All testing was performed within a 3-day time window in order to limit the effects of specimen stability on interlaboratory result variability.
TABLE 1. Comparison of selected assay and procedural characteristics among different test sites
Lab Platform
DNA input
(l)
Reaction
vol (l) Target
Target length (bp) Probe type/fluorescence EBV calibration
curve type Dynamic range/vol (l)
No. of patients/ calibration curve
A ABI 7900 10 50 BNRF1 83 FAM/NFQ Plasmid 1⫻10 to 1⫻106/10 6
B LightCycler 1.0
5 20 EBNA1 251 Fluor/Red 640 Quantified viral DNA
1⫻10 to 1⫻105/10 5
C ABI 7500 10 50 BNRF1 74 FAM/TAMRA Plasmid 8⫻102to 4⫻108/10 5
D1a ABI 7700 10 50 BNRF1 74 FAM/TAMRA Plasmid 6.6⫻10 to 6.6⫻107/10 7
D2
b ABI 7700 20 50 EBNA1 97 FAM/None Cloned target
region
2⫻102to 1⫻107/10 4
E ABI 7900 8 50 BALF5 90 FAM/TAMRA Plasmid 1.25⫻106to 2.5⫻106/10 8
F ABI 7000 5 25 EBNA1 71 FAM/TAMRA Plasmid 2⫻10 to 2⫻106/10 6
G ABI 7700 5 25 EBNA1 71 FAM/TAMRA Plasmid 2⫻10 to 2⫻106/10 6
H LightCycler 1.0
5 20 EBER 319 SYBR green Plasmid 1⫻10 to 5⫻106/5 4–5
aMethod D1 was used only for panel 1 testing.
bMethod D2 was used for testing of all panels.
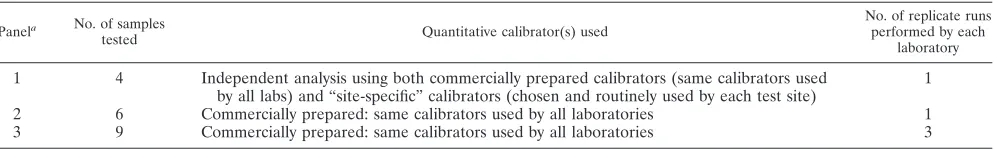
TABLE 2. Test panel characteristics
Panela No. of samples
tested Quantitative calibrator(s) used
No. of replicate runs performed by each
laboratory
1 4 Independent analysis using both commercially prepared calibrators (same calibrators used by all labs) and “site-specific” calibrators (chosen and routinely used by each test site)
1
2 6 Commercially prepared: same calibrators used by all laboratories 1
3 9 Commercially prepared: same calibrators used by all laboratories 3
aSerially diluted commercial DNA preparation; panels 2 and 3 were prepared from the same DNA lot.
on May 16, 2020 by guest
http://jcm.asm.org/
[image:2.585.45.542.641.716.2]Statistical methods and data analysis.Classical least-squares regression with
CTas theyvariable and log10copies/l as thexvariable was used to obtain each
standard curve. The root mean square error (RMSE) was used to summarize the
deviation of the calibratorCTvalues from the fitted line. The reported viral load
result for each unknown sample was determined by averaging theCTvalues
across replicates and mapping the result against the calibration curve. For each unknown sample, the range and interquartile range were used to summarize the variability of reported results across laboratories.
To statistically compare the interlaboratory deviation of regression parameter estimates (slope, intercept, or RMSE) of one panel to those of another panel, the absolute deviation of each lab’s regression estimate from the across-lab mean for
that parameter was determined. Next, for each lab, the difference between the two panels’ estimates was computed, and the Wilcoxon signed-rank test was applied to the set of differences. Pagano and Gauvreau (10) describe all of these statistical methods. No adjustments for multiple testing were performed. S-Plus software (Insightful Corp, Seattle, WA) was used to perform all analyses.
RESULTS
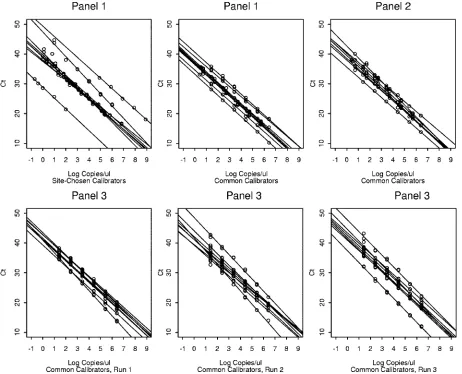
[image:3.585.44.546.81.185.2]Calibration curves. All calibration curves showed strong consistent linear relationships between viral load and cycle
[image:3.585.63.525.340.714.2]FIG. 1. Comparison of calibration curves for all test panel runs. TABLE 3. Interlaboratory summaries of calibration regression estimates
Panela
Regression estimate
Intercept (CT) Slope RMSE
Mean Median SD Min Max Range Mean Median SD Min Max Range Mean Median SD Min Max Range
1* 39.91 39.10 5.91 28.84 49.36 20.53 –3.56 –3.50 0.31 ⫺4.14 ⫺3.08 1.06 0.42 0.32 0.24 0.13 0.82 0.69 1† 36.93 37.00 2.19 33.20 40.58 7.38 –3.51 –3.52 0.08 ⫺3.60 ⫺3.35 0.24 0.28 0.22 0.13 0.09 0.45 0.36 2† 39.32 39.49 2.07 35.60 42.68 7.08 –3.57 –3.59 0.20 ⫺3.95 ⫺3.30 0.64 0.42 0.45 0.27 0.10 0.86 0.76 3.1† 41.61 41.37 1.33 39.29 43.43 4.14 –3.66 –3.58 0.25 ⫺4.23 ⫺3.45 0.78 0.34 0.31 0.08 0.25 0.47 0.22 3.2† 42.16 41.41 2.99 39.24 48.52 9.28 –3.67 –3.53 0.43 ⫺4.44 ⫺3.12 1.32 0.49 0.35 0.42 0.14 1.34 1.20 3.3† 42.48 42.28 3.00 37.39 47.75 10.36 –3.75 –3.71 0.20 ⫺4.00 ⫺3.51 0.49 0.41 0.38 0.15 0.16 0.60 0.44
a*, site-specific calibrators were used; †, for all remaining panels common calibrators were used. Min, minimum; Max, maximum.
on May 16, 2020 by guest
http://jcm.asm.org/
threshold (CT). However, differences were noted both between
and within testing sites with respect to slope, intercept, and RMSE. Panel 1 results reflected nine assays conducted at eight sites (one site tested twice, using two distinct methods). Panels 2 and 3 were each tested using eight quantification methods (one method per test site).
Calibration curves for panel 1 were generated using both site-specific calibrators (site-specific calibrator curves) and us-ing calibrators common to all testus-ing sites (common calibrator curves). Summary statistics showing calibration curve variabil-ity for both calibrator types are shown in Table 3. The intercept estimates, slope estimates, and RMSE values showed less
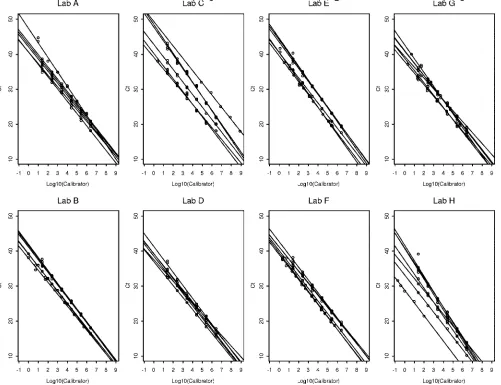
[image:4.585.45.542.80.203.2]vari-FIG. 2. Comparison of calibration curves by laboratory, comparing all test panel runs. TABLE 4. Calibration curve parameter estimates summarized across panels for each lab
Laboratory
Regression estimatea
Intercept Slope RMSE
Mean Median SD Min Max Range Mean Median SD Min Max Range Mean Median SD Min Max Range
A 42.80 42.41 2.51 40.58 47.37 6.79 ⫺3.57 ⫺3.49 0.29 ⫺4.14 ⫺3.30 0.84 0.36 0.33 0.20 0.16 0.70 0.54 B 39.73 40.11 2.14 36.70 41.91 5.21 ⫺3.57 ⫺3.59 0.11 ⫺3.72 ⫺3.41 0.31 0.28 0.33 0.12 0.09 0.39 0.30 C 44.62 45.27 4.49 39.09 49.36 10.27 ⫺3.69 ⫺3.60 0.29 ⫺4.11 ⫺3.35 0.76 0.42 0.41 0.14 0.27 0.60 0.33 D 38.83 38.90 1.53 37.00 41.33 4.33 ⫺3.46 ⫺3.49 0.21 ⫺3.71 ⫺3.08 0.62 0.39 0.30 0.27 0.13 0.86 0.73 E 41.53 41.94 2.94 37.19 44.53 7.34 ⫺3.79 ⫺3.78 0.14 ⫺3.97 ⫺3.60 0.38 0.32 0.23 0.24 0.10 0.67 0.57 F 40.16 40.30 1.82 37.61 42.64 5.03 ⫺3.54 ⫺3.58 0.10 ⫺3.64 ⫺3.39 0.25 0.39 0.40 0.13 0.22 0.55 0.33 G 39.72 40.17 2.30 36.39 42.68 6.29 ⫺3.50 ⫺3.52 0.28 ⫺3.95 ⫺3.12 0.83 0.51 0.44 0.21 0.32 0.88 0.55 H 36.27 36.49 4.84 28.84 41.70 12.86 ⫺3.88 ⫺3.82 0.41 ⫺4.44 ⫺3.40 1.04 0.42 0.27 0.45 0.14 0.34 1.20
aMin, minimum; Max, maximum.
on May 16, 2020 by guest
http://jcm.asm.org/
[image:4.585.46.547.329.714.2]ability across laboratories when common calibrators were used than when site-chosen calibrators were used (P⫽0.0742,P⫽
0.0273, andP⫽0.0039). For instance, the intercept estimates across laboratories ranged from 28.84 to 49.36 with a standard deviation of 5.91 when site-chosen calibrators were used; but when common calibrators were used, the intercept estimates ranged from 33.2 to 40.6 with a standard deviation of only 2.19. Regression curves generated using common calibrators also demonstrated improved interlaboratory consistency compared to those generated with site-specific reagents (Fig. 1, panel 1 plots).
The finding of improved quantitative consistency with the use of common calibration standards was reproduced with a second panel of EBV DNA. Calibration curve characteristics for panel 2 were analyzed using a single set of common cali-brators. Calibration curve characteristics for panel 2 were com-pared to those of panel 1 generated from common and site specific calibrators (Table 3 and Fig. 1). The interlaboratory variability of intercept estimates, slope estimates, and the RMSE of panel 2 did not differ significantly from those of
panel 1 using common calibrators (P⫽1.00,P⫽0.25, andP⫽
0.1093, respectively). The interlaboratory variability of the in-tercept and slope of panel 2 did not differ significantly from those of panel 1 with site-chosen calibrators (P⫽0.1953 and
P⫽0.1484, respectively). However, panel 2 had significantly less interlaboratory variation of the RMSE than did panel 1 using site-chosen calibrators (P⫽0.0078).
Panel 3 was analyzed using a single set of common calibra-tors but differed from panels 1 and 2 in that each laboratory ran the panel (calibrators and patient samples) on three sep-arate occasions. Intralaboratory variability of calibration curve slope,y intercept, and RMSE differed markedly among the eight test sites (data not shown). There was further evidence of this variability when cross-panel comparisons were performed. For example, the intercept estimates for one laboratory ranged from 37.00 to 41.33 across panels, while the intercept estimates for another laboratory ranged from 28.84 to 41.70 across pan-els (Table 4). While expected discrepancies were seen between calibration curves generated from the site-specific and com-mon calibrators curves in panel 1, calibration curve plots gen-FIG. 3. Variation in viral load values for patient samples. Each point gives the result from a specific laboratory for the indicated panel and sample number. The horizontal line aty⫽1 corresponds to the threshold used to qualitatively interpret the findings as positive or negative. The numbers at the bottom of each plot indicate the number of laboratories that did not report aCTvalue and interpreted the result as negative (zeroes are not shown).
on May 16, 2020 by guest
http://jcm.asm.org/
erated by some laboratories were more widely splayed than others, when all runs from all panels (Fig. 2, laboratories C and H) or when replicates from panel 3 test runs were compared (data not shown).
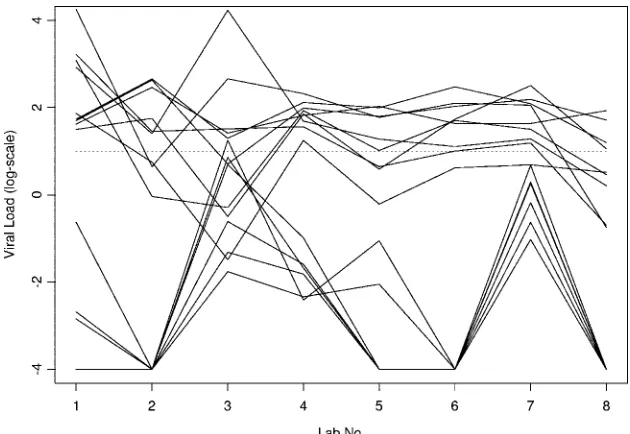
Patient sample results.As shown in Fig. 3, the interlabora-tory variability of quantitative results for individual samples was tremendous. The range of viral load results exceeded 1 log-unit in most cases; in one case the range was almost 5 log-units. The lowest interlaboratory range was 0.54 log-units (Fig. 3, sample 4, bottom-center plot). The plots include quan-titative results for samples that had a reportedCTvalue;
sam-ples yielding results of less than 1 on the log-scale were gen-erally interpreted as negative results by the laboratories. Based on the latter criterion, there was complete agreement among all participants for all negative samples in all three panels when common calibrators were used (Fig. 3, samples 3, 1, and 3 in panels 1, 2, and 3, respectively). Using its own calibrators, one laboratory would report a positive result with a low viral load for sample 3 in panel 1 (Fig. 3). In a few cases, some labs would report negative results, while most labs would report positive results (Fig. 3). Interpreting viral loads less than 2 on the log-scale as negative findings would introduce substantially greater disagreement in interpretation across laboratories for some samples with lower viral loads (Fig. 3). The lowest and highest viral loads were reported by the same labs for many negative or low-viral-load samples (Fig. 4).
DISCUSSION
Quantitative data showed substantial differences both be-tween and within laboratory test sites; it is likely that even greater variability would have been seen if different nucleic acid extraction methods been included in the study. This vari-ability was apparent in linear regression calibration curves, as shown by differences in slope,yintercept, and RMSE.
Differ-ences were similarly reflected in results from patient samples. Although the use of common calibration materials had sub-stantial benefit in reducing variability across test sites, marked inter- and intralaboratory discrepancies remained.
Standardized calibration materials have been developed for a number of commonly tested analytes (5, 6, 11–15). These international standards, combined with assay improvements, including broadly available commercial reagents and auto-mated systems for specimen preparation/processing, have played important roles in the development of quantitative tests and have greatly facilitated their broad implementation (8, 17). In addition, for some analytes, the availability of international standards and test systems with excellent reproducibility has allowed the development of international consensus guidelines on quantitative thresholds to guide patient management (4). Finally, standardized diagnostics with excellent reproducibility can be critical for the management of individual patients across geographical boundaries and in the accurate interpretation of data generated at various sites.
The data presented here suggest that similar improvements in quantitative precision can be achieved for EBV PCR using real-time methods. The generation of internationally agreed upon calibration standards would be a first step toward such a goal. However, these data also show substantial remaining variability. That variability can be ascribed to differences in assay design and laboratory technique. The latter aspect of test performance likely explains much of the intralaboratory vari-ation seen here. Although such run-to-run changes may be mitigated somewhat by increased training or experience, it is likely that automated technologies will be more effective in reducing interlaboratory variability.
[image:6.585.134.449.67.284.2]The present study was not designed to assess the relative contributions of various assay characteristics to result variabil-ity. Nor could certain variables such as the effects of transpor-tation on test panel samples be totally obviated. However, the FIG. 4. Consistency of results for negative and low viral load samples. Each solid line shows the results of a negative or low viral sample for one panel across labs. The plot includes all instances with a mean viral load less than or equal to 2 on the log-scale. The results deemed negative by the lab are shown as⫺4 on this plot. A dashed horizontal line aty⫽1 is included for purposes of qualitative interpretation.
on May 16, 2020 by guest
http://jcm.asm.org/
distribution of lyophilized material for common calibrators, the use of a single extraction method, and in panel 3 the specification of testing dates and procedures for storing and thawing specimens were all measures intended to minimize the effects of specimen handling on interlaboratory variability.
It is hoped that our findings will stimulate efforts to further standardize quantitative assays for EBV and other viruses. The problems demonstrated here exemplify the challenges in this still-developing diagnostic field. The implementation of a rep-licable paradigm for developing quantitative viral controls or calibration standards is clearly an unmet need. Furthermore, the availability of commercially produced and marketed assays and the introduction of automation and reagents produced using good manufacturing practices should contribute to assay precision and should allow more widespread implementation of quantitative testing.
ACKNOWLEDGMENTS
The EBV Working Group thank C.-H. Webb (University of Min-nesota, Minneapolis, MN), B. Lembke (Labcorp, ViroMed Laborato-ries, Minnetonka, MN), and S. Verma (St. Jude Children’s Research Hospital, Memphis, TN) for assistance with this work.
This study was supported in part by the American Lebanese Syrian Associated Charities, the Minnesota Medical Foundation, and the University of Minnesota International Center for Antiviral Research and Epidemiology.
REFERENCES
1.Bakker, N. A., E. A. Verschuuren, M. E. Erasmus, B. G. Hepkema, N. J. Veeger, C. G. Kallenberg, and W. van der Bij.2007. Epstein-Barr virus-DNA load monitoring late after lung transplantation: a surrogate marker of the degree of immunosuppression and a safe guide to reduce
immunosuppres-sion. Transplantation83:433–438.
2.Cohen, J. I.2005. Clinical aspects of Epstein-Barr virus infection, p. 35–54.
InE. Robertson (ed.), Epstein-Barr virus. Caister Academic Press, Norfolk,
England.
3.Hakim, H., C. Gibson, J. Pan, K. Srivastava, Z. Gu, M. J. Bankowski, and R. T. Hayden.2007. Comparison of various blood compartments and report-ing units for the detection and quantification of Epstein-Barr virus in
pe-ripheral blood. J. Clin. Microbiol.45:2151–2155.
4.Hammer, S. M., M. S. Saag, M. Schechter, J. S. Montaner, R. T. Schooley, D. M. Jacobsen, M. A. Thompson, C. C. Carpenter, M. A. Fischl, B. G. Gazzard, J. M. Gatell, M. S. Hirsch, D. A. Katzenstein, D. D. Richman, S. Vella, P. G. Yeni, and P. A. Volberding.2006. Treatment for adult HIV infection: 2006 recommendations of the International AIDS Society–USA
panel. Top. HIV Med.14:827–843.
5.Holmes, H., C. Davis, A. Heath, I. Hewlett, and N. Lelie.2001. An interna-tional collaborative study to establish the first internainterna-tional standard for HIV-1 RNA for use in nucleic acid-based techniques. J. Virol. Methods
92:141–150.
6.Jorgensen, P. A., and P. D. Neuwald.2001. Standardized hepatitis C virus
RNA panels for nucleic acid testing assays. J. Clin. Virol.20:35–40.
7.Lee, T. C., B. Savoldo, C. M. Rooney, H. E. Heslop, A. P. Gee, Y. Caldwell, N. R. Barshes, J. D. Scott, L. J. Bristow, C. A. O’Mahony, and J. A. Goss.
2005. Quantitative EBV viral loads and immunosuppression alterations can decrease PTLD incidence in pediatric liver transplant recipients. Am. J.
Transplant.5:2222–2228.
8.Mackay, I. M., K. E. Arden, and A. Nitsche.2002. Real-time PCR in virology.
Nucleic Acids Res.30:1292–1305.
9.Maeda, A., H. Wakiguchi, W. Yokoyama, H. Hisakawa, T. Tomoda, and T. Kurashige.1999. Persistently high Epstein-Barr virus (EBV) loads in pe-ripheral blood lymphocytes from patients with chronic active EBV infection.
J. Infect. Dis.179:1012–1015.
10.Pagano, M., and K. Gauvreau.2000. Principles of biostatistics. Duxbury, Pacific Grove, CA.
11.Robertson, J. S.1998. International standardization of gene amplification
technology. Biologicals26:111–113.
12.Saldanha, J., W. Gerlich, N. Lelie, P. Dawson, K. Heermann, and A. Heath.
2001. An international collaborative study to establish a World Health Or-ganization international standard for hepatitis B virus DNA nucleic acid
amplification techniques. Vox Sang80:63–71.
13.Saldanha, J., A. Heath, N. Lelie, G. Pisani, and M. Y. Yu.2005. A World Health Organization International standard for hepatitis A virus RNA
nu-cleic acid amplification technology assays. Vox Sang89:52–58.
14.Saldanha, J., N. Lelie, A. Heath, et al.1999. Establishment of the first international standard for nucleic acid amplification technology (NAT)
as-says for HCV RNA. Vox Sang76:149–158.
15.Saldanha, J., N. Lelie, M. W. Yu, and A. Heath.2002. Establishment of the first World Health Organization International standard for human
parvovi-rus B19 DNA nucleic acid amplification techniques. Vox Sang82:24–31.
16.Stevens, S. J., E. A. Verschuuren, S. A. Verkuujlen, A. J. Van Den Brule, C. J. Meijer, and J. M. Middeldorp.2002. Role of Epstein-Barr virus DNA load monitoring in prevention and early detection of post-transplant
lymphopro-liferative disease. Leuk. Lymphoma43:831–840.
17.Vernet, G.2004. Molecular diagnostics in virology. J. Clin. Virol.31:239–247. 18.Wadowsky, R. M., S. Laus, M. Green, S. A. Webber, and D. Rowe.2003. Measurement of Epstein-Barr virus DNA loads in whole blood and plasma by TaqMan PCR and in peripheral blood lymphocytes by competitive PCR.
J. Clin. Microbiol.41:5245–5249.