446 Ma et al.: Interpretation of Wauelrt Analysis and its Application in Partial Discharge Deteclion
Interpretation of Wavelet Analysis and Its Application in
Partial Discharge Detection
X. Ma, C. Zhou
andI.
J. Kemp
School of Engineering, Science and Design Glaqgow Caledonian University, Cowcadden Road, Glasgow, G4 OBA. UK
ABSTRACT
T h e objective of t h e paper is to discuss a tool which is proving extremely efficient in partial discharge measurement studies. Though t h e technique itself is not new, its application t o partial discharge studies is. I t will he demonstrated in this paper t h a t i t h a s tremendous power a n d this accounts for its rapid growth a s a n applica- tion in this field. The paper begins with t h e description of t h e fundamentals of wavelet analysis, wavelet categories a n d t h e properties of t h e associated wavelet transforms. P D pulses a s acquired from detectors composed of different detection circuits a r e investigated a n d numerically simulated, a n d a method
on
how t o select optimally t h e wavelet corresponding t o t h e representative forms ofI'D
pulse is then presented. Finally, applications of wavelet analysis t o partial discharge studies a r e explored. The paper demonstrates t h a t t h e wavelet based denoising method pro- posed in t h e p a p e r can he employed in 'separating I'D pulses from electrical noise successfully a n d can be used in pulse propagation studies of partial discharge in distributed impedance plant to provide enhanced information a n d f u r t h e r infer the original site of the I'D pulse.1
INTRODUCTION
AILURE of the solid insulating systems of HV equip-
F
ment (rotating machines, transformers, bushings etc.) can lead to catastrophic failure of the equipment with se- rious health and safety, environmental and economic con- sequences. It is therefore imperative that degradation insuch'systems be detected and quantified at an early stage in its development so that appropriate replacement/refur- bishment can he arranged at a convenient time. When degradation occurs in such systems, irrespective of the causative mechanism, it generally results in partial dis- charges being generated (small electrical sparks within the insulation). Once prevalent, partial discharges then repre- sent the dominant mechanism of degradation. For this reason, it can be appreciated why the detection and char- acterization of partial discharge activity is a key approach in insulation system condition monitoring [l].
Partial discharge (PD) detection involves the capture, storage and processing of P D signals, which occur in the form of individual or series of electrical pulses. By acquir- ing the data at a convenient, non-intrusive location,
usu-
ally the phase or neutral terminals of the power equip- ment under test, statistical quantities such as the PD-pulse magnitude, phase distribution (over the ac power cycle) and their variation with time a n he obtained [Z]. Further- more, based on these quantities, the mechanisms of PDactivity can be categorized, and the nature, form and the extent of degradation can be inferred.
Traditionally, the techniques used for signal processing are realized in either the time o r frequency domain to analyze and extract P D events. In the case of the fre- quency domain, for instance, the Fourier transform as- sumes that any signal could he decomposed into a series of sine and cosine waveforms and then summarized by these basis functions. Although the signal under analysis can be localized arbitrarily throughout the frequency do- main following the Fourier transform, information in time is, however, lost. With regard to the P D pulse structure, there always exist non-periodic and fast transient features in the PD signals detected, which tend to be ignored and cannot bc revealed efficiently and explicitly by this kind of
conventional transform. For these reasons, when the Fourier transform is applied to partial dischargc analysis, it has serious limitations.
Despite the advances achieved during past decades in measuring instrumentation, partial discharge detection circuits, e.g., the ultra wide-band detectors coupled to real-time oscilloscopes of very wide bandwidth (up to 4 GHz),
a
sophisticated analytical tool of similar power to pre-process P D data has yet to he realized.IEEE Transactions on DielecIrics and Electrical Insulation Vol. 9, No. 3, June 2002 447
analysis and signal processing, the wavelet and its associ- ated transforms r3-51 have been increasingly recognized by researchers and engineers and utilized to solve many engineering problems. This paper describes the use of the wavelet transform to obtain two-dimensional information
on P D pulses in both the time and frequency domain, and
to extract features of PD pulses in the measurement data. The paper ccnters on the following questions:
(1) What is the wavelet, its categories and the associ- ated transforms?
(2) How is the wavelet, most suitable for analysis of PD
measurement data, acquired in different detectors?
( 3 ) How can the specific wavelet “pattern”fol1owing the wavelet transform (WT) be used to differentiate PD from other signals such as noise?
(4) How successfully can the WT be utilized in prac- tice?
2
WAVELET
METHODOLOGY
A wavelet, as its name implies, can he interpreted as a small wave that has a limited duration and a zero mean value. It oscillates in amplitude and decays to zero quickly
on both sides of the central position
of
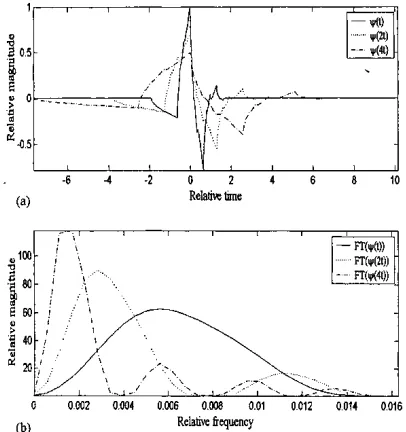
the waveform. Compared to sine and cosine waves, the hasis functions of the Fourier transform, which extend from minus to plus infinity, wavelets usually tend to he irregular and asym- metric in terms of wave shape. An example wavelet + ( t ) is shown in Figure la.From a mathematical viewpoint, if a wavelet is defined as
$([I,
it has.the property of equation (1) and has to satisfy the admissibility condition C,(O<
C, <m) in equa-Re& hqwncy
[image:2.612.75.278.492.708.2](b)
Figure 1. Comparisons between scaled wavelets in the time domain and in the frequency domain. a, scaled wavelets in the time domain; b, their results following the Fourier transform.
tion
(2)
so that a signal can he decomposed and then re- constructed perfectly through the wavelet transform.where
4
is the form of the Fourier transform of + ( t ) , and R the set of real numbers. In wavelet terms, +(f) is referred to as the mother wavelet. The family of scaled wavelets associated with$(/I
can be described as/
$ ( a t ) = a - ’ f l + ( - ) , l7 ( a = 1 , 2 , 3
, _ _ _ )
(3)where the scaling variable a determines the amplitude and the duration of + ( a / ) . More precisely, the amplitude of
+ ( a / ) is inversely proportional to the value of the square root
of
a, whereas its duration is linearly proportional to a, thus ensuring that each scaled wavelet has the equiva- lent energy of the mother wavelet, as can he seen from Figure la.Also as can he observed in Figure lb, the scaled wavelets
of
+(af) have different central frequencies w and band- width rangesA W ,
high values of a corresponding to low values of w and A w , whereas low values of a yielding high values of o and A w . If f in expression (3) is re- placed by / - h, the wavelet is shifted by b on the time axis. Therefore, localization propertiesin
,both the timc and frequency can be achieved simultaneously when the signals under analysis are examined using such wavelets.There are several families of wavelets already proven to
he especially useful in practice 161. In terms of wavelet expressions, some are given explicitly by their time defini- tion, including the Gaussian wevclct, the Mcxicdn hat wavelet and the Morlet wavelet, and some by their fre- quency definition such as the Mcyer wavelet. Others are constructed by their finite impulse response (FIR) filter pair that exist a special mirror relationship between fil- ters, also known as quadrature mirror filters (QMFs), typ-
ical examples of which are Daubechies wavelets, Symlet wavelets, Coiflet wavelets and Lemarie wavelets. The Dauhechies wavelets constituted from 4 and 14 coeffi- cients in QMFs are shown in Figures 2a, and 2h respec- tively; the former is defined as db2, the latter as db7. Among the wavelets available, the Daubechies wavelet family has almost all of the required properties such as compactness, limited duration, orthogonality and asym- metry for analysis of fast transient, irregular pulses.’ It is for this reason that the Ddubechies wavelet can be ap- plied effectively in partial discharge studies.
448 Ma et al.: Interpretation
of
Wavelet Analysis and its Application in Partial Discharge DetectionR&b+ be (b)
Figure 2. Examples of the shape of wavelets. a, db2 wavelet; b, db7 wavelet.
signal can be disassembled into a series of scaled and time shifted forms of mother wavelet producing a time-scale view of a signal from which the original signal can he re- covered. The continuous wavelet transform (CWT) of a
s: original
signal
Level
1
Level
2
8
3
0
Level 3
Approximation
3
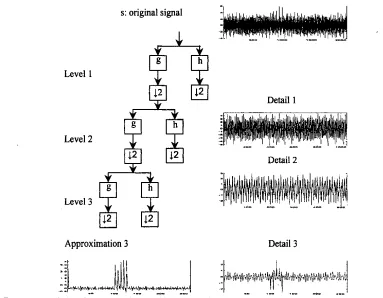
Figure 3. Tree structure of three level FDWT decomposition of a signal.
time-dependent signal f(t) is described as
The CWT calculates the wavelet coefficients at every possible scale and along every time instant. The value of
W,f(a,
b) represents the similarity extent between the ex-amined section of f(t) and the scaled and shifted wavelets. T h e greater t h e
W,f(a,b),
t h e more energetic theW+f(a,b),
and the greater the similarity between the wavelets and the original signal.T h e discrete wavelet transform (DWT) is realized by
characterizing thc scale variable a
in
a = 2”’ and assum- ing the time variable b as b = n2” at a given scale m (m,n being integer values), thus avoiding time consumed in coefficient calculation and eliminating wavelet coeffi- cient redundancy. The practical fast discrete wavelet transform (FDWT) is implemented basedon
the filtering scheme of QMF pairs g, h at different scales as illus- trated in Figure 3. When a signal is fed through a pair of low-pass filterg
and high-pass filter h respectively, the WT yields the low frequency content and the high fre- quency contentof
the signal respectively, the former be- ing known as the signal’s “approximations” and the latter known as its “details”.The signal can be perfectly reconstructed using the in- verse discrete wavelet transform (IDWT) by starting from
Detail 1
Detail 2
[image:3.612.87.294.72.316.2] [image:3.612.111.494.430.728.2]IEEE Transactions on Dielectrics and Electrical Insuhtion
the bottom components and moving to the root compo- nent rattier than employing the top to bottom approach of
the FDWT. At each synthesis level, both the coarser ap- proximations and details are firstly up-sampled by the fac- tor of 2 and then convoluted with synthesis filters
g,
A,
producing a finer approximation signal. The coefficients in synthesis filters
g,
are identical with those in decom- position filters g, h, but are inverse in the time arrange- ment.3
PULSE SHAPE OF PARTIAL
DISCHARGES
The selection of a suitable wavelet and its associated analysis algorithm is application dependent. For example, time-defined wavelets such as the Gaussian wavelet, the Mexican hat wavelet and their CWT have often been used for pattern recognition [7], and the Morlet wavelet for high-impedance fault detection [81 and the analysis of dis- turbances within power systems [91. Dyadic orthogonal wavelets such as the Daubechies wavelet have found ap- plications in data compression and signal demising [lo-131.
Prior to discussing wavelet selection with respect to partial discharge studies, it is important to discuss PD pulse shape. For solid or fluid dielectrics, partial dis- charge phenomena are mainly caused hy voids or bubbles within o r at the surface of insulating materials. The charge displacement in the system produces current flowing in the leads to the object, which can be detected by a cou- pling capacitor in parallel, or by an impedance in series, with the test sample. Normally discharge pulses are recog- nized as having a very steep wave-front and short dura- tion. The rise time of the discharge pulse is as low as a few ns (perhaps even faster) whereas its duration is
in
the order of 10 ns. The pulse shape of the discharge current is determined by the cavity dimension, such as its radius and height, and the external measuring circuit, whereas the number of almost simultaneously occurring discharges is determined by the cavity shape. For instance, spherical cavities cause onc individual discharge at a time, whereas flat cavities yield many discharges at a time [14].In relation to detection methods, both narrow-band and ultra wide-band (UWB) detecting circuits have been adopted. Narrow-band detection can give an erroneous quantification and information loss due to quasi-integra- tion adopted
or
when multiple overlapped pulses exist. The characteristic parameters, which describe the shapeof an individual discharge pulse, cannot be described ex- plicitly in narrow-band detection. With ultra wide-band (UWB) detection techniques [14,151 coupled to fast oscil- loscope acquisition, the true P D pulse shape can be recorded and the shape of the individual PD pulse can be obsemed. Compared to the phase-resolved measurement primarily related to narrow-band detection, UWB detec-
Vol. 9, No. 3, June 2002 449
-
1
, .
+*-
(d -ITime ins)
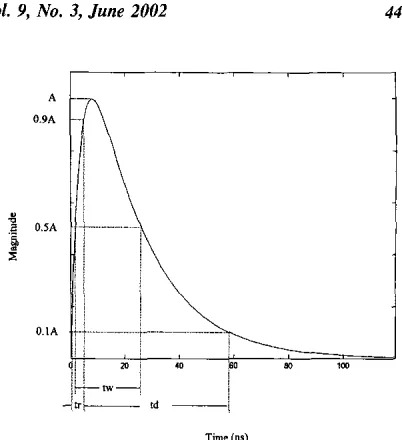
Figure 4. Typical time parameters describing the shape of a PD
current PUlSC.
tion is primarily associated with time-resolved measure- ments.
Figure 4 demonstrates a typical P D current pulse, which could be characterized by a series of discharge parameters including A (pulse peak value), f, (pulse rise time from 10% to 90% levels), t , (pulse width between 50% levels) and f d (pulse decay time from 90% to 10% levels) [11,14]. In practical measurements, discharge voltage signals are captured by feeding the discharge current through a de- tection circuit. O n this basis, detected voltage signals are likely to have different pulse shapes, depending on the configuration of the detection circuit. As far as the detec- tion circuit [161 is concerned, it is realized in either a R C impedance circuit or a RLC impedance circuit, as shown in Figures %a) and 5(b) respectively. The transfer func- tions of RC and RLC impedance circuits can be expressed in the following Laplace forms
where r = RC, and w O =I,". For the input of a Dirac current pulse
Xf)
(ideal impulse, no time duration), the output voltage pulse u(f) is represented as a damped ex- ponential pulse in theRC
impedance circuit and a damped [image:4.612.315.516.77.297.2] [image:4.612.320.522.661.723.2]id) 0)
450 Ma et al.: Interpretation of Wavelet Analysis and its Application in Partial Discharge DeteciSon
. .
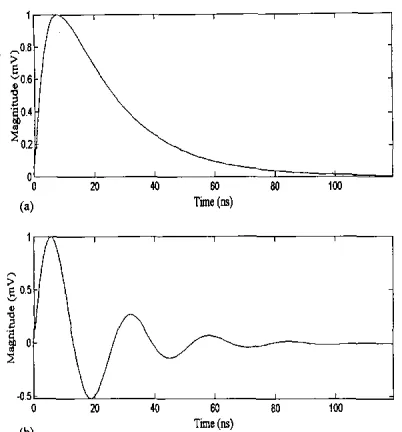
Figure 6. Two typical PD pulses. a, simulated DEP-type pulse; b, simulated DOP-type pulse.
oscillatory pulse in the RLC impedance circuit. The value
of T controls the decay time of both representative forms
of pulse and w , ) determines the oscillation frequency of
the latter output pulse.
In practice, the current pulse i ( f ) caused by a P D is not an ideal Dirac current, because it has duration in time, as shown in Figure 4. When a practical P D pulse passes i(t)
through a detection circuit, the output pulse produced al- ways has a finite rise time. Considering the shape of a P D current pulse and the characteristics of detection circuits, the damped exponential pulse (DEP) and the damped
os-
cillatory pulse (DOP) can be numerically simulated as the mathematical models of (7) and (8) respectively, and fur- ther displayed in Figures 6a and 6b.
(7)
(8)
D E p ( 1 ) = A ( ~ - @ I -
D O P ( t ) = Asin(27if,r)(e-"h -e-"i )
where A gives the pulse peak value, f , , t , the damping coefficients that determine those typical characteristic pa- rameters
r,, r,,
f d describing the pulse shape, whilst f, is the oscillatoty frequency of the DOP-type pulse.4
OPTIMAL WAVELET SELECTION
The W T of a signal produces a wavelet detail coeffi- cient distribution throughout the entire time-scale (frequency) view which, referred to as the "wavelet pat- tern'' of a signal, depends on the wavelet chosen in the WT. For a better understanding of this, an example of a discharge signal with 5 successive DEP-type pulses is given,
Figure 7. Wavelet patterns of a DEP-type pulse. Sampling fre-
quency, 1GHz; data record, 2100 points. a, With the db2 wavelet; b, With the db7 wwclct.
where 1, = 5ns,
r ,
= Ions and fd = 20ns in each pulse. Its wavelet pattern after applying FDWT with 5-level (scale) using the db2 and db7 wavelet is displayed in Figures 7a and 7b respectively. Here, FDWT with low level is cho- sen as the P D pattern can be characterired within such a level range. The same reasoning applies for the level de- termination later in characterizing the patterns of noise. Despite the similarity in both patterns, the values of their coefficient are significantly different, as seen from all lev- els. The "optimal" wavelet suitable for analyzing a given signal is the one whichis
capableof
generating as many coefficients with maximal values as possible within the time-scale domain. In this case, db2 is a more appropriate wavelet than db7 for analyzing this type of PD pulse.In statistical analysis, the correlation coefficient y [17] is used to detect one particular relationship between vari- ables. The greater the value of y , the more approximate in wave shape between two variables. Uncorrelated data sets result in an y of 0, whereas equivalent data sets have an y of 1. For this reason, the correlation coefficient y
can also be used as a criterion in identifying an appropri- ate wavelet choice for P D pulse examination as described below:
[image:5.612.93.294.109.325.2] [image:5.612.331.534.112.394.2]IEEE Transactions on Dielectrics and Electrical Insulation
db2 db3
Vol. 9, No. 3, June 2002 451
0.5272 0.2410 0.4557 0.2042 db4
db5 db6 db7 db8 db9 d b l 0 d b l l db12 db13 db14 d b l 5 db16
I
db19 db20
svm2
I
0.3761 0.3281
0.0234 0.7841 0.2213 0.3526 0.1443 0.7747
0.0447 0.7257 0.0632 0.6590 0.0151 0.5607 0.0196 0.5894 0.0633 0.6108
0.0708 0.6055 0.0622 0.6075 n.0516 0.6057 0.0231 0.5949
0.0212 0.5755
0.0418 0.5648
0.U484 0.5351 0.0527 (l.5517
0.5237 0.2410 0.4557 0.3486 0.5126 0.28(10 lem3 0.2462 0.5972
2. the wavelet data set is acquired from thc available wavelet families by use of the aforementioned methods in
the section of wavelet methodology,
3. a set of correlation coefficients y is then calculated and finally
4. after comparing all of the correlation coefficients, the optimal wavelet for the defined discharge pulse is the one with the maximal value of y .
For example, let us consider a DEP-type pulse with pa- rameters t , = 5ns, t , = l0ns and I d = 20ns and a DOP-type pulse with the same time paramcters as above with an oscillation frequency
f,
= 2OMHz. Table 1 lists all of the calculated values of the correlation coefficient y between the PD pulses and the available wavelets investigated, where all of wavelets are named using their abbreviations and the number behind indicates thc order of the wavelct in its corresponding family. The results show that the dh2 is the best wavelet for the DEP-type discharge pulse and the db7 for the DOP-typc pulse. It can he seen from Fig- ures 8a and 8b that the bcst wavelct based on the corrcla- tion coefficients appear remarkably similar to the pulse under analysis.Does this tcchnique apply to all other discharge pulses with different characteristic parameters? The authors be- lieve that during the WT, the mother wavelet is scaled both in amplitude and in duration at different scales pro- ducing the best match result with the detected discharge pulse at a certain scale as long as a reasonable mother wavelet is chosen. Normally, the wavclets with lower order such as db2, db3, sym?, sym3, Iem2 and lem3 are appro- priate to the PD data measured with RC detection circuit, whilst for the P D data measured with RLC detection cir- cuit, higher order wavelets of db6
-
dblO are appropriate.I M 2w IW 400 YUI 6W 7W 8oJ
R & b he
[image:6.616.313.518.108.320.2](b)
Figure 8. Comparisons hetween thc PD pulse and the determined optimal wavelet. a. optimal wavelet far DEP-type PD pulse; b, opti-
mal wavelet for DOP-type PD pulsc.
In practical use, the potentially candidate wavelets can be applied to the same problem under investigation simulta- neously to determine the one which yields thc best result.
5
PD
PULSE
EXTRACTION
452 Ma et al.: Interpretation of Wavelet Analysis
and
its Application in Partial Discharge Detection [image:7.616.71.284.72.354.2](b)
+-+
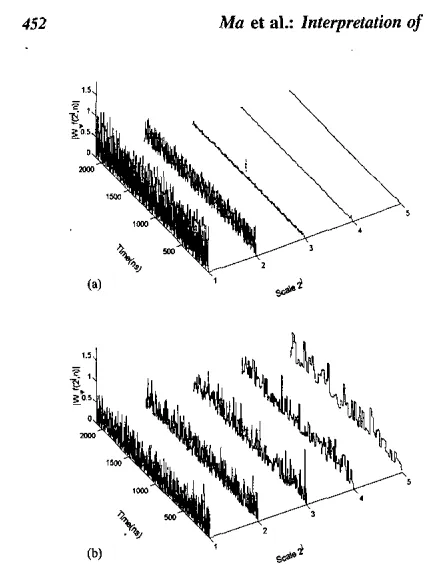
Figure 9. Wavelet patterns of the noise with the db2 wavelet. Sam- pling frequency, 1GHz; data record, 2100 points. a, sinusoidal noise
by broad frequency range between 100 kHz and 200 MHr; b, random
noise by white noise,
The present paper addresses two important and novel issues, which are missing from previous publications, re- lated to wavelet based denoising methods, i.e., optimal wavelet selection and automated thresholding to accom- modate the typical P D pulses and representative forms of noise with varying signal to noise ratio. The former has been addressed in the previous section, whereas this sec- tion presents an automatic level-dependent thresholding criterion which can be used to separate PDs from “noise” by means of characteristic patterns following the applica- tion of the DWT with the selected wavelets.
Thc coefficient distributions of two types of noise have been examined against a PD pulse. The first was continu-
ous sinusoidal noise with very broad frequencies between
100
kHe
and 200 MHz. Its wavelet pattern, as demon- strated in Figure 9a, decays asymptotically, in a significant way, with the increment of decomposition level. Secondly, the wavelet signature of stochastic noise given by white noise has the form shown in Figure 9b. In this case, the average density of coefficients is inversely proportional t o the dyadic scale 1/2’ ( j is the decomposition level), or, half the number of coefficient extremes d o not propagate from one scale 1/21 to a coarser scale 1/2’+’ [201. In sin- gularity terms in signal processing, its Lipschitz exponentis negative.
As described above, P D signals and noise present dif- ferent wavelet patterns, thus enabling PD feature extrac- tion. For a given set of PD data in the presence of noise, the denoising can be performed through wavelet decom-
position, thresholding of wavelet coefficients and wavelet reconstruction. Thresholding is of vital importance during denoising, which is conducted by retaining the wavelet co- efficients associated with discharge events and, on the other hand, discarding all other discharge-free coeffi- cients which characterize noise.
An automatic level-dependent thresholding criterion and hard thresholding approach
is
recommendedto
be applied to both details across decomposition levels and approximations at the user-predefined maximal level of a signdl following the FDWT. The former at level j is de- fined ass, mj/0.6745*d
m
,
where m j is the esti- mated level-dependent median value andn,
the level-de- pendent length of the signal. As can he seen from this thresholding estimator which considers the coefficient fluctuation at each decom osition level, both the basic threshold estimatee-
*log( n j ) and the rescaling factormJ0.6745 are level dependent, thus facilitating the most effective suppression of indeterminate noise.
Hard thresholding processes the data in such a way that those wavelet coefficients whose absolute values are greater than the threshold are kept and those less than the threshold are replaced by zero, as can he expressed mathenlatically as y = x * ( I x
I
>
A), where n, y are origi- nal and retained coefficients respectively and A the threshold value. Unlike the hard thresholding, soft thresh- olding shrinks the kept coefficients as can he seen from the thrcsholding rule y = sign(x)*(1
x1
- A). Hard thresh- olding was preferred by the authors in P D denoising due to the higher coefficient values associated with discharge events being kept thus yielding an improved PD signal to noise ratio in comparison with software thresholding. More information on the thresholding rules can be refer- enced in [6,211.Consider now the efficiency of wavelet analysis in the denoising of signals containing partial discharges from some examples. Two sets of PD pulse sequences, one with .5 individual DEP-type pulses and the other with 5 DOP- type pulses, were immersed in electrical noise constituting various forms of electromagnetic radiation (both sinu- soidal and stochastic), and recovery implemented. As shown from Figure 10, the db2 wavelet yields an effective denoising result when adopted in the DEP-type PD ex- traction. The frequency spectra of such DEP-type pulses and the superimposed noise are illustrated in Figures lob, and 10c, respectively. The correlation coefficient y he- tween the separated P D signal and the original one has a value of 0.890, indicating the great similarity between them in nature, and the relative error in amplitude between them is within only 2%. However, for the DOP-type P D extraction, dh7 wavelet yields a better denoising result, as
shown in Figure 11 as an example. By observing Figures I l h and l l c , it can be seen that the frequency spectra of
IEEE Transactions on Dieleclrics and EIectricaI InsuIation VoI. 9,
No.
3, June 2002 453Boos
E
(c,o 10 IM 150 250 100 I10
ua
450iWFnqurnry (MH1
3 r , I
,
,
,
I I , ,, ,
0 02 0.4 06 08 I I 2 1.4 I K IU 2
[image:8.612.318.522.88.358.2] [image:8.612.77.288.107.358.2](4 ?me(&*)
Figure 10. Demising of a DEP-type P D event immersed in noise in the case of UWB measurement simulation. Sampling frequency, 1 CHI; data record, 2100 points. a, original noisy signal; b, frequency spcctrum of P D pulses; c, frequency spectrum of the superimposed noise; d, P D pulses extracted.
P D pulses: r, = 5ns, t,, = 10ns. rd = 2Ons, 50ns time separation; noisc, combined by sinusoidal noise in broad frequency range hetween 100
kHz and 200 MHz and white noise.
pulses. However, this kind of resonant P D pulse can still be separated from the combined electrical noise using the proposed denoising method. In this case, the denoising result shows the value of y is high at approximately 0.95, and the relative error in amplitude is down to 4%.
Simulation studies showed that the denoising of both DEP-type and DOP-type P D pulses for narrowband sinu- soidal noise is more efficient than that for wideband stochastic noise. As the DEP-type pulse has a wideband frequency spectrum, when the narrowband sinusoidal noise is superimposed on the DEP-type pulses, they can be identified from the coarsest approximations at maximal level and the details along decomposition levels which represent the specific frequency band involved in
a
signal. In the case of the narrowband DOP-type pulses superim- posed by narrowband sinusoidal noise, the local irregular- ities of tlie signal are dominated by P D data when sam- pled with a suitable resolution, which can be detected from the details at lower levels following the FDWT. However, the denoising quality deteriorates gradually with the in- crement of the frequency spectrum range that the PD sig- nals and noise overlap. This method is less efficient in suppressing stochastic noise from both types of P D pulses when the signal to noise ratio is less than -3dB due to.orL I I I I I I,
4
o 50 iw 19 M O 1 s ~ yo is0 rm
(d) Tmr (PSI
Figure 11. Demising of a DOP-type P D event immersed in nuke in the case of narrow-hand measurement simulation. Sampling fre- quency, 10 MHz; data record, 4200 points. a, original noisy signal; h, frequency spectrum of P D pulses; c, frequency spectrum of the su-
perimposed noise; d, P D pulses extracted.
P D pulses: I , = 0.07 ps, r, = 0.5 ps. rd = 1 ~ s , 20 WLS time separation; noise, combined hy sinusoidal noise in frequency range between 50
kHz and 1 MHr and white noise.
stochastic noise having a wideband frequency spectrum and a random occurrence in time.
It is worth underlining that the characteristic parame- ters of the PD pulse influence significantly the efficiency
of P D pulse extraction from various forms of noise inter- ference. The greater the damping coefficient and interval between pulses, the better the result in terms of P D event denoising. For the sampling frequency
f,
utilized, the higher thef,,
the higher the wavelet decomposition level required in order to achieve the same efficiency for P D denoising, since a longer original sequence is available with the increment o f f , within a fixed time period.Further evidence of the power of this technique is illus- trated in Figure 12. In this case, partial discharge signals were acquired from a cable component energized at 5
kV
454 Ma et al.: Interpretarion of Wavelet Analysis and its Application in Partial Discharge Detection
6 t ' ' ' ' 1 ' ' ' , ' ' .I
' 1 1
(b) Tim 64
Figure 12. Denoising of PD pulses immersed in actual narrowband electronic noise and corona. Sampling frequency, 10 MHz; data recurd, 2048 points. a, detccted original PD data; b, separated PD
pulses.
T o further evaluate the performance of this denoising technique, the P D H,(+,q) patterns generated by using the original data without any processing, by using a threshold technique and the wavelet denoising technique are presented here for the test on the cable component. The sampling frequency utilized in this test was 2.5 MHz
obtaining 5 X lo4 points for each data record with respect
to a complete ac power cycle of 50 Hz. Each P D pattern was generated with 100 data records as acquired by the above narrow-hand detection system during a measure- ment duration of 10 min. The P D pattern shown in Figure 13a is dominated by the noise where the original data are directly used to produce the pattern. Figure 13h gives the
PD pattern by using a threshold technique applied to the original data where the noise level is estimated as 2 times of the standard deviation value of the acquired data. Fig- ure 13c gives the P D pattern based on the wavelet-based noise suppression. It is evident the wavelet denoising technique not only has eliminated the noise but also de- tected more P D activity with low apparent discharge mag- nitude, and is thus much more unambiguous and effective in characterizing the nature of the discharges in this par-
ticular PD geometry.
The time using a standard Pentium 3 t o denoise a sig-
nal consisting of 2048 points illustrated in Figure 12 is 0.2 s. The time needed to denoise such a data stream of 5 x lo4 in generating P D patterns is around 1.5 s, giving a good result potentially for on-line dkagnOStiCS or quality assurance of power equipment. Another attractive benefit coupled to this method is data compression of P D mea- surement data. Because only those coefficient data re- lated to discharge events need to be used to precisely re-
Figure 13. PD patterns of B cable component energized at 5kV.
Sampling frequency, 2.5 MHr; measurement duration, 10 mi". a, With original data without any processing; b, With a threshold method
directly applied to original data; c, With wavelet-based noise sup-
pression.
construct the actual P D signal extracted, the amount of data storage space can he greatly reduced. If the compres- sion measure is evaluated in compression ratio C, in per- centage between the total retained coefficients across de- composition lcvels and the length of the original signal under analysis, C , is found to he within 5%.
6
TIME-FREQUENCY ANALYSIS
[image:9.612.314.534.105.516.2] [image:9.612.90.289.107.318.2]ZEEE Transactions on DieIectrics and EIectrical Insuhtion
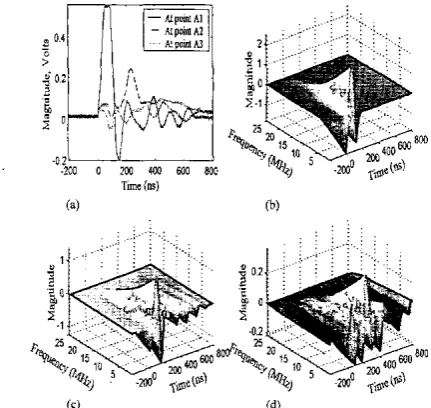
Figure 14. Time-frequency description of a discharge simulating pulse propagating along the winding. a, PD pulses measured at dif- ferent points; b, wavelct pattern at point A , (a point on the end winding of thc first turn of a coil); c, wavelet pattern at point A? (same point one turn away from A , ) ; d, wavelet pattern at point A , (same point two tums away from A I ) .
twice the pulse rise time was injected at one point A , in the winding, yielding output responses at A , , A , as shown in Figure 14a. The detailed experimental setup can be found in [22]. In this case, A , is a point on the end wind- ing of the first turn of a coil, A , the same point one turn away from A , , and A , two turns distant from A , .
In the case of motors, generators and transformers, par- tial discharge detection and interpretation is often ham- pered by the distorting effect on the PD pulse due to the distributed impedance of the windings
as
the pulse propa- gates from its site of origin to the measurement terminals. However, its wavelet pattern of a signal created by the continuous wavelet transform (CWT) offers the possibilityof improving the characterization of the pulse propaga- .tion and providing better insight into the mechanism of propagation since it contains unique and cnhanced infor- mation compared with traditional methods in both the time and frequency domains
[231.
As is well known, thc factor u in the CWT, as described in equation (4), can be varied
in
either linearor
dyadic scaling depending on the frequency component contained in the signal undcr examination and the required fre- quency resolution. Here, the scaling factor a is varied inlinear increments so that the CWT can provide a finer wavelet pattern view through the entire time-frequency domain. In the CWT, the relationship between the scale and frequency can he understood in the following proce- dures. If a mother wavelet has a centra! frequency of
w & n where wo is defined as wC, = j w 1 $ ( w ) I ’ d w , the central frequency created by $ ( a t ) as shown in equation
Vol. 9, No. 3, June 2002 455
(3) becomes w&na). Furthermore, the frequency
f,
at scale a corresponding to the sampling frequency f, of the original signal is then given by f, = (f,wo)/(2rru).Consider now the wavelet choice suitable for the time- frequency analysis of a P D pulse propagating along the winding. To detect the local edges or sharp transitions in
a signal, which are defined as singularities, the wavelets with some vanishing moments are crucial. The wavelets with k vanishing moments satisfy the condition
/;’$(t)dt = 0, (9)
where j is positive integer j
<
k. The modulus maxima of the CWT coefficients of f ( t ) yielded with such $ ( I ) are given hy(10)
I W # f ( i , h ) I
s
where A is a constant and a the Lipschitz exponent which is used to measure the singularity of a signal f ( r ) at time instant b. The Lipschitz exponent a gives an indication of
the differentiability of
f(0 more precisely, for example,
the a of a Dirac signal is estimated as 0, and the a of a signal which is differentiable at time b is measured as 1.T o estimate a signal with a Lipschitz exponent up to k ,
the wavelet selected should have k vanishing moments. However the number of CWT coefficient maxima at a given scale often increases linearly with the numbcr of the vanishing moment of the wavelet
[ZOI.
Therefore, the wavelets suitable for the P D pulse propagation applica- tion are those with as few vanishing moments as possible but with enough moments to detect all sharp transitions that are of interest in this field. [image:10.612.66.282.109.313.2]The dh2 wavelet with 2 vanishing moments is chosen here to illustrate the wavelet pattern of P D pulses de- tected at different points along the winding. Figures 14b to 14d display the wavelet patterns of the pulses shown in Figure 14a following the CWT with db2 wavelet. The en- ergetic wavelet coefficients cover the active frequency components up to around 20 MHz and the time range of
0-600 ns. Clearly, the wavelet pattern can reveal explicitly not only the dominant frequencies involved in the signal under examination but also the time instants when they appear.
A “traveling wave” on the copper of the winding is dominantly present during the propagation of this pulse. The further thc detection point from the injection point, the progressively wider in shape and lower in magnitude the pulse observed, since high frequency components are seriously attenuated when the pulse propagates from its origin site to the measurement point. Meanwhile, the “coupling waves”are found in the waveforms of A , , A ,
456 Ma et al.: Interpretation of Wavekt Analysis
and
its Application in Partial Discharge Detection [image:11.612.59.286.110.315.2]. .
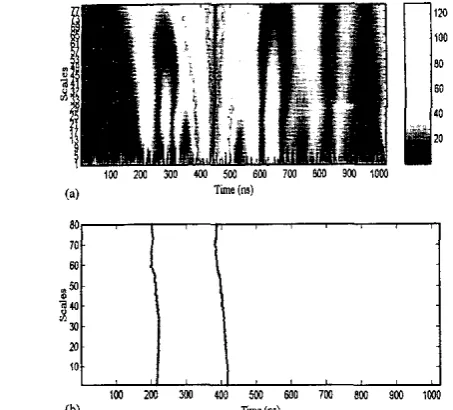
Figure 15. The coefficient distribution of the detected PD pulse and the associated local maxima lines used to infer the original site of PD
pulse. Wavelet, dbl; linear scaling, from 1 to 80; a, hvo-dimensional coefficient distribution of PD pulse at point A , in the wavelet do- main; h, local maxima lines.
The combination of information contained in the “traveling wave” and “coupling wave” has been used for locating PD site in HV plant [24]. Does the wavelet pat- tern improve the time-flight method for inferring the orig- inal P D site? This will be addressed below in terms of the local maxima lines of the wavelet coefficients in the direc- tion of the scale. The local maxima line
is
defined in this context as a continuous curve in the wavelet domain along which all points are modulus maxima [ZO]. The singulari- ties in an irregular signal indicate the onset of the sharp transients, the timingof
which is of interest for locating the transient onset especially resulted from the comhina- tion of the “traveling wave”and “coupling wave”. In order to minimize the amount of computation, the d b l wavelet with only one vanishing moment is chosen as the analyz- ing wavelet for locating the singularities in time. Figure 15a illustrates a two-dimensional wavelet pattern of the P D pulse at point A , in the time-scale domain where the scales are selected within 80. Figure 15b shows the kept local maxima lines in the same wavelet domain by apply- ing a predetermined threshold h = p max(I
W$a, b )I
) to truncate other local maxima lines whose amplitudes are lower than this threshold, where p is a turning factor with a value between 0 and 1.As
can be seen from the local maxima lines, the “coupling wave” and the “traveling wave” appear at time instants 0.215 ys and 0.417 ys, re- spectively. The “coupling wave” arrives almost instantly due to a stray field formed in the dielectric media in which energy is coupled to the neighbouring conductors, the ar- rival time of which depends on the physical distance being divided by the approximate speed of light. The “traveling ~.
Table 2. Arrival time of two propagation mechanisms and the in-
ferred distance with respect to the pulse injection point.
0.218 0.630 4.944 I
wave” arrives with a time delay depending on the electri- cal distance propagating along the winding divided by the velocity which is insulation material dependent. Therefore the arrival time difference between the “traveling wave and the “coupling wave”can he used to calculate the dis- tance between the detection point and the origin site of the P D pulse. Table 2 gives the arrival time of such two propagation modes in the waveforms acquired at points
A , , A , by which the original PD pulse site can be in- ferred. In this case, the velocity of the traveling wave in the induction motor winding is around 120m/ys, and the electrical distances (conductor length) of points A , , A ,
with respect to pulse injection point A , are 2.42 m and
4.84 m respectively [22]. It demonstrates that the error in distance is within 3% hut it increases with the distance of detection point, due to the amplitude decrement of the P D pulse along the winding.
7
CONCLUSIONS
AVELET transforms can reveal enhanced and reli-
nals. The W T is capable of locating time and frequency components simultaneously allowing the analysis of sig- nals with irregular and transition features, such as in the case of partial discharges. The scaling factor selected in the WT can be varied in either linear or dyadic scaling depending on the frequency component contained in the signal under examination and the required frequency res- olution.
T o use wavelet theory for PD analysis, it is vital to se- lect the most appropriate wavelet and this is determined by the nature of the P D pulse. The correlation coefficient between the wavelet and the measured
PD
pulse can be used as an efficient criterion to evaluate the optimal wavelet for the measured P D pulse. For P D data acquired with a R C detector circuit, the optimal wavelets are those dyadic orthogonal wavelets of lowcr order, whereas for P D data obtained with a RLC detector circuit, those dyadic orthogonal wavelets of higher order are preferred.Based on the patterns of the coefficient distribution of
the PD pulses and noise following the
WT,
denoising problemscan
be solved. Further testson
practicalPD
data obtained on-site will confirm its power.Because only a convolution calculation is involved in the implementation of the FDWT, the algorithm may be po- tentially applied for on-line P D detection in the presence
of severe electrical disturbance. Furthermore, the possibil-
IEEE Transactions on Dielectrics and Electrical Insulation Val. 9, No. 3, June 2002 457
ities for data compression that accompanies the wavelet- based method alleviate the problems related to data stor-
age and data communication during on-line P D detection.
The technique employing the local maxima lines of the PD pulse following the CWT provides the potential for locating the original site of a P D pulse propagating along the winding more accurately. However, studies have shown that this application depends on the wavelet choice, the scale range selected and the turning factor for threshold- ing, therefore it is application dependent and needs to he further justified.
The present effort of this paper has been devoted to finding wavelets from the extensive libraries of mother wavelets based on the clear understanding of the test specimen and the detection system utilized. Provided the behavior of the detection circuit being utilized is fully characterized and understood, as is the case in these stud- ies, there should be no need to adopt an adaptive wavelet approach. However, if the P D data set is non-stationary in the measurement, an adaptive wavelet should be consid- ered to automatically adjust the shape of the analyzing wavelet to the signal of interest. All of these show there is still a lot of work to he done in this area, hut it holds very significant promise for the future.
ACKNOWLEDGMENTS
The authors gratefully acknowledge the contributions
from Dr. B.
G .
Stewart and Mr. A. Nesbitt to the experi- mental measurements referred to in the paper. The au- thors would also like to express their sincere thanks forthe constructive comments from the referees, which helped
to improve the presentation.
REFERENCES
[ I ] 1. I. Kemp. "Partial Dischargc Plant-monitoring Technology: Present and Futurc Developments",IEE Proc. Sci. Meas. Tech- nol., Vol. 142, No. 1, pp. 4-10, 1995.
[2] F. H. Kreuger, E. Gulski and A. Krivda, "Classification of Par- tial Discharge", IEEE Trans. E l , Vol. 28, pp. 917-931, 1993. [3] A. K. Louis, P. Maab, and A. Rieder, "Wauelels: Theory ond Ap-
plicarions", John Wiley & Sons, 1997.
[41 I. Daubechies, "Thc Wavelet Transform, Time-Frequency Lv- calimtion and Signal Analysis", IEEE Trans. Information The-
151 S. G. Mallat, "A Theory for Mulliresolution Signal Decomposi- tion: The Wavelet Representation", l E E E Trans. Pattern Andly- sis and Machine Intelligence, Vol. 11, pp. 674-693, 1989.
"Wauelet
Toolbox Manuul - User's Guide", The Math Works Inc., USA, 1996.
ory, VOI. 36, pp. 961-1005,1990.
[6] M. Misiti, Y . Misiti, G. Oppenheim and J. Poggi,
Moanuscnpr r e r n a d on 3 Morclt 2001, in p a l form 19 Febnror). 2002.
[7] M. Mukai, T. Okano, S. Nishimoto, 1. Kitani and K. Arii, "Study
on Degradation Diagnosis of Pdrtial Discharge in a Void by
Wavelet Analysis", Proc. Symposium on Electrical Insulating Materials, Japan, pp. 463-466. 1995.
[XI S. Huang and C. Hsieh, "High-Impedance Fault Detection Uti- lizing B Morlet Wavelet Transform A p p r o a c h , IEEE Trans. Power Delivery, Vol. 14, pp. 1401-1407, 1999.
191 S. Huang and C. Hsieh, "Application of Murlet Wavelets to Su-
pervise Power System Disturbances", IEEE Trans. Power Deliv- ery, Vol. 14, pp. 235-243, 1999.
[I01 T. B. Littler and D. J. M o m s , "Wavzlets for the Analysis and
Compression of Power System Disturbances", IEEE Trans. Power Delivery, Vol. 14, pp. 358-364, 1999.
[ I I] L. Angrisani, P. Daponte, G. Lupu, C. Petrarca and M. Vitelli, "Analysis of Ultrawide-band Detected Partial Discharges by
means of a Multiresalutiun Digital Signal-processing Method", Measurement, vol. 27, pp. 207-221, 2000.
[12] X. Mal C. Zhou and 1. J. Kcmp, "Investigation into the Use of Wavelet Theory for Partial Discharge Pulse Extraction in Elec- tricallv , Noisv Envimnments". Proc. 8th International Confer- ~,~ ~~~~
~~~~~~
cnce o n Materials, Measurements and Applications, Edinburgh. UK, pp. 123-126, 20W.
1131 Shim, J. J . Soraghan and W. H. Siew, "Detection of P D Ulilis- ing Digital Signal Processing Methods, Part 3: Open Loop Noise Reduction", IEEE Electrical Insulation Magazine, Vol. 17, No.
1141 P. Morshuis, "Assessment of Dielectric Degradation by Ultra- wide-band PD Detection", IEEE Trans. DEI, VoI. 2, pp. 744-760, 1995.
[I51 G. C. Stone, H. G. Sedding, N. Fujimoto and J. M. Braun, "Practical Implcmentation of Ultra wide hand Partial Discharge Detecturs", IEEE Trans. El, VoI. 27, pp. 70-81, 1992. [I61 G. Zingales, "The Requirements of a PD Measuring System
Analyzed in the Time Domain", IEEE Trans. DEI, Vol. 7, pp.
[I71 G. Kcppel and S. Zedeck, " D R I I ~ An&i~for Research Desins - Analyrir of Variance and M d f i p l e Rearrrsiorr/Correlotion Ap-
proaclm", W. H. Freeman and Company, Ncw York, 19R9.
[I81 U. Kopf and K. Fescr, "Rejection of Narrow-hand Noise and
Repetitive Pulses in Oil-sitc PD Measurements", IEEE Trans.
DEI, Vol. 2, pp. 1180-1191, 1995.
1191 H. Borsi, E. Gockenbach and D. Wenzel, "Separation of Partial Discharge from Pulse-shaped Noise Signals with the help of Neural Nehvorks", IEE Proc. Sci. Meas. Technol., Vul. 142, pp. 69-74, 1995.
[20] S . Mallat and W. L. Hwang, "Singularity Detection and Process- ing with Wavelets", IEEE Trans. Infcmnation Theory. Vol. 38, pp. 617-643, 1992.
[21] D. L. Donaha, "De-noising by soft-thresholding", IEEE Trans. Information Theory, Vol. 141, pp. 613-627, 1995.
[221 C. Zhou, 1. J. Kemp and M. Allan, "The PD Pulse Behavior in Rotating Machine Stator Windings", IEEE Conf. on Electrical Insulation and Dielectric Phenomena, Vol. 1, pp. 372-375, 1995. [231 X. Ma, C. Zhou and 1. 1. Kemp, "PD Pulse Propagation Studies Using the Wavelet Transform",IEEE Conf. on Electrical Insula- tion and Dielectric Phenomena, Vol. ?, pp. 626-629, 2000. 1241 R. E. James, Q. Su, B. T. Phung, S . C. Foong and R. C. Tych-
sen, "Location of Partial Discharge on an 80MW/12.5kV Hydro-generator with thc aid of Digital Filtering Techniques", J.
Electrical and Electroni~s Engineering, Australia-IE Aust. and IREE Ausl., Vol. IO, No. 4, pp. 338-343, 1990.
I , pp. 6-13,