Neutron reflection from the liquid helium surface
T. R. Charlton1, R. M. Dalgliesh1, A. Ganshin2, O. Kirichek1, S. Langridge1, P. V. E. McClintock2
1
ISIS, STFC, Rutherford Appleton Laboratory, Harwell, Didcot, UK 2
Lancaster University, Lancaster, UK
The importance of liquid helium for physics can hardly be overestimated. Its unique ability to remain liquid right down to absolute zero makes helium an ideal experimental sample for studying quantum phenomena in condensed matter. Helium-4 was first liquefied by Kamerlingh Onnes in 1908. Since then the properties of bulk helium liquid (including 4He, 3He and isotopic mixtures) have been studied in detail, resulting in the discovery of many fundamental phenomena including, especially, superfluidity. However the free surface of liquid helium has attracted significantly less attention than the bulk liquid, perhaps due to the relatively complex experimental methods that are needed for surface studies. Currently the best-known approaches are probably optical ellipsometry, surface tension measurements, and investigations of two-dimensional charge sheets above and below the surface.
Optical ellipsometry was exploited for measuring the thickness and density profile of the liquid helium surface [1]. It was shown in experiments that the vertical thickness within which the density changes from 90 to 10% of the bulk liquid density increases slightly with temperature from 1.4 to 2.1 K , with an average value of 9.4 Å at 1.8 K. There was also evidence of a rise of up to 3 Å between 2.1K and the superfluid transition temperature (λ point). A very close value for the vertical thickness, of 9.2 ± 1 Å at 1.13 K, was obtained in experiments where liquid-vapor density profiles of thick 4He films were measured using X-ray reflectivity [2].
The surface tension of liquid helium can be measured by various experimental methods [3, 4] and may be compared directly with the values derived from theoretical models [5, 6]. However, establishing the relationship between surface tension and the dynamical properties of superfluid helium remains a rather complex task [7].
Perhaps the most powerful experimental technique for studying the surface properties of liquid helium is through measurements on two-dimensional charge systems including surface electrons (SE) and layer of ions trapped under the surface of liquid helium [8]. The existence of the quantized capillary surface waves, or ripplons, earlier proposed by Atkins [7] in order to explain surface tension data, has been clearly proven in experiments with a two-dimensional plasma resonance in surface electrons [9]. Later, ripplons [10] as well as scattering of surface electrons with Fermi quasi-particles from bulk liquid [11] were detected on liquid 3He. Soon after that, it was found that the
mobility of surface electrons on 3He deviates drastically from the single-electron-ripplon scattering theory below 70 mK [12]. In contrast, the mobility of surface electrons on 4He follows the single-electron-ripplon scattering theory down to 20 mK, the lowest
temperature achieved in the experiment. This may suggest a crossover to the long-mean-free-path regime, implying a connection to the Rayleigh-like waves predicted
studies of the surface tension of liquid 3He [4], behavior that could not be explained in terms of ripplons and the quasi-particle-scattering contribution.
Capillary waves on the surface of thick superfluid 4He films have been detected via the dielectric ponderomotive effect [15]. This method allowed measurement of the spectrum and damping of capillary waves within the wavelength range 3.3 – 20 μm. The damping was orders of magnitude smaller than the value predicted theoretically.
In some respects, the SE, surface tension and capillary wave methods provide rather indirect ways of studying the liquid helium surface experimentally, inevitably leading to ambiguities in the interpretation of the data. A complementary experimental approach that might facilitate direct studies of the microscopic properties of liquid helium surface, thus illuminating this fascinating subject, is therefore much to be desired.
In this paper we propose a new experimental method based on the unique
combination of neutron reflection and ultra-low temperature sample environment: small-angle neutron reflection from the liquid surface, opening new opportunities for studying the interface properties of quantum liquids. We also present our preliminary
measurements of reflection from the superfluid and normal liquid 4He surfaces. Note that a range of classical optical phenomena such as reflection, refraction and interference can be also observed for slow neutrons [16, 17]. For a neutron approaching a plane surface at a glancing angle θ, the refractive index at the boundary between two media is defined as:
cos cos k
k
n (1)
where k and k are the neutron wave vectors inside and outside the medium. Sincen1, a limiting case occurs whencos1, characterized by the critical angle c such
thatcosc n. For cwe have total external reflection. The phenomenon is
analogous to the total internal reflection of light; the difference is in the sign of
n1
. For the thermal neutrons c 1 we can writecos 12 2, which leads to:) 1 (
2 n
c
(2)
Total reflection of slow neutrons was first reported by Fermi and co-workers [18, 19] and since been extensively applied to range of problems. The specular reflection of neutrons gives information on the neutron refractive index profile normal to a surface. The refractive index is simply related to the scattering length density and hence specular neutron reflection can provide important information about the composition of surfaces and interfaces. Similar information can be obtained from x-ray reflection experiments. There are many instances, however, where the neutron method provides distinct
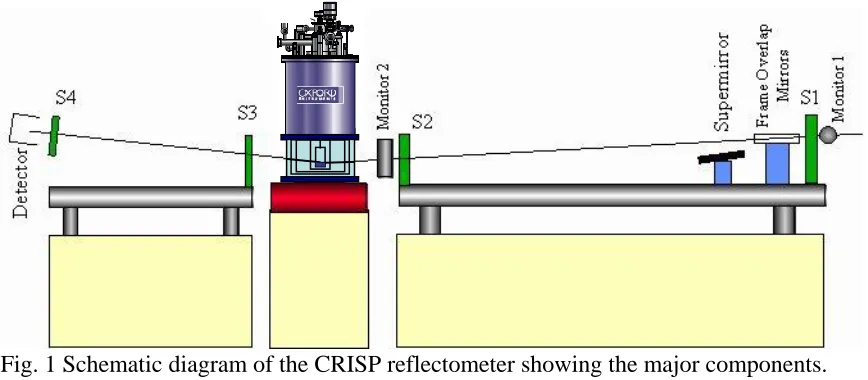
Fig. 1 Schematic diagram of the CRISP reflectometer showing the major components. Items used for polarization handling have been removed from the drawing since they
were not used in the experiments described.
Our experiments were performed on the CRISP Instrument, which was designed as a general purpose reflectometer for the investigation of a wide spectrum of interfaces and surfaces. It uses a broad-band neutron time-of-flight method for determination of the wavelength at fixed angles. Fig. 1 shows a schematic digram out of the instrument. 1.The sample geometry is horizontal, allowing investigation of liquid surfaces. The instrument uses the pulsed neutron beam from the ISIS neutron facility and passage via a 20 K hydrogen moderator provides neutron wavelengths in the range 0.5 - 6.5 Å at the source frequency of 50 Hz, extending up to a maximum of 13 Å if operated at 25 Hz. The incident beam is well collimated by both coarse and fine adjustable collimating slits ( S1 – S4) to give a variable beam size and angular divergence, with typical dimensions of 40 mm wide (horizontal direction) and anything up to 10 mm in height (vertical direction). A variable aperture disc chopper defines the wavelength band, and prompt pulse
suppression is achieved by a nimonic chopper. Additional frame overlap suppression is provided by the nickel-coated silicon wafer frame overlap mirrors, which remove wavelengths greater than 13 Å. The instrument has two types of detectors, a He single detector and a 1-D position-sensitive multidetector. The instrument can also be run in a polarized mode allowing polarized neutron reflectivity measurements as well being able to perform full polarization analyes.
The experimental arrangement is extremely flexible and, with the neutron beam inclined at 1.5˚ to the horizontal, provides well for the study of liquid surfaces. Provision for liquid surfaces angles of less than 1.5˚ is achieved by the insertion of a supermirror. The sample position is designed to be vibrationally isolated from the rest of the
instrument, further aided by active anti-vibrational damping. Much of the instrument is automated allowing for precision control and a high degree of reproducibility.
and wall thickness 0.5 mm was attached to the sample stick of the VTI. The temperature of the cell was measured with a calibrated Cernox sensor.
In order to estimate the influence of the cell and sample environment on the signal from the scattered neutrons, we performed neutron reflection calibration measurements from the surface of liquid D2O at room temperature in the same experimental setup. The test demonstrated a negligible influence of the sample environment on the experimental data.
In our experiments we attempted to study neutron reflection from the surfaces of both liquid 4He and 3He. However, due to the large cross-section for neutron scattering from the 3He nucleus in the vapour phase, we could not detect a reflection signal from the 3He liquid surface within the experimental temperature range down to 1.25K. The 3He vapour pressure decreases rapidly with temperature, and we therefore we believe that the
temperature reduction below ~1K should solve this problem.
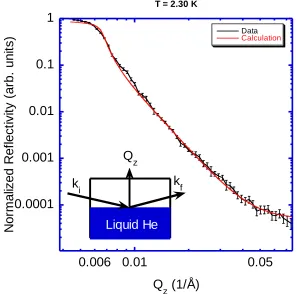
In the experiment we condense approximately 10 litres of helium gas (at STP) into the cell, which is kept at a temperature of 2 K. After the reflection signal is detected, the temperature of the cell is stabilized and controlled for a sufficient period of time to collect neutron reflection data over a range of values of wave vector transfer Qz perpendicular to the reflecting surface (see the diagram in the inset of Fig. 2), which typically takes a few hours.
0.0001 0.001 0.01 0.1 1
0.006 0.01 0.05
T = 2.30 K
Data
Calculation
N
o
rm
a
lize
d
R
e
fl
e
ct
ivi
ty
(a
rb
.
u
n
it
s)
Q
z (1/Å)
k
i kf
Q
z
[image:4.612.107.404.337.631.2]Liquid He
Fig. 2 The reflectivity of the liquid 4He surface as a function of Qz measured at 2.3 K. The inset shows the orientation of the incoming ki and outgoing kf wave vectors as well as
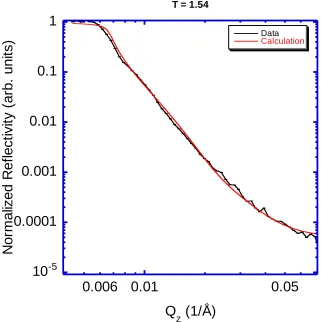
We have measured the reflectivity of the liquid 4He surface as a function of Qz at temperatures of 2.3 K and 1.54 K, obtaining the results presented in Figs. 2 and 3 respectively. As a general feature both data sets show a slight downward slope of the reflectivity approaching the critical value, Qc~0.006 1/Å, attributable to absorption of neutrons by traces of 3He at the natural isotopic ratio of about 2 x 10⁻⁷ in the supplied 4He gas. Without absorption the signal below Qc would be completely flat. Past Qc, from Qz >
0.08 1/Å where the Born approximation applies we observe the typical ~ Qz-4 decrease in the reflectivity curve indicating, qualitatively, that the surface is smooth.
10
-50.0001
0.001
0.01
0.1
1
0.006
0.01
0.05
T = 1.54
Data
Calculation
N
o
rm
a
lize
d
R
e
fl
e
ct
ivi
ty
(a
rb
.
u
n
it
s)
Q
[image:5.612.109.430.199.521.2]z
(1/Å)
Fig. 3 The reflectivity of liquid 4He surface as a function of Qz measured at 1.54 K.
To extract quantitative information from the data we compare the reflectivity profile with an optical model. In its simplest form, the model reduces to the quantum
2.30K occurs gradually over a large 800 Å distance while, at 1.54K, the transition is compressed into ~400 Å. We can suggest a possible explanation for this observation.
0 2 10-7 4 10-7 6 10-7 8 10-7 1 10-6 1.2 10-6
0 200 400 600 800 1000
T = 2.30 K
T = 1.54 K
S
ca
tt
e
ri
n
g
P
o
te
n
ti
a
l
(1
/Å
2 )
Depth (Å)
Fig. 4 The scattering potential profiles obtained by numerical simulation, using the reflectivity data for 2.3 K and 1.54 K. The abscissa corresponds to vacuum below 0 Å, to the near-surface region between 0 Å and 800 Å, and to bulk liquid 4He above 800 Å. Note that the optical potential is proportional to the density and scattering power of the material.
Experiments on liquid 4He with both neutron scattering [22, 23] and X-ray diffraction [24] indicate a significant change in the structure of liquid as it cools through the
superfluid transition. This observation was also supported by Monte Carlo simulations [25] where it was shown that, when Bose condensation takes place, the liquid 4He
becomes more disordered in Cartesian space with some rearrangement of atoms occurring to create the necessary space for delocalization to occur. If there is an enhanced Bose-Einstein condensate fraction close to the surface of the superfluid [26, 27], an increase in disorder could be expected, possibly accounting for the alteration in the neutron
scattering structure factor. However thorough theoretical modelling is now required to establish whether the results observed in the experiment can be accounted for
quantitatively on this basis.
normal liquid at 2.3 K. We have also observed a surface layer ~200 Å thick with slightly different neutron scattering structure factor in superfluid 4He. The new experimental method described in this paper opens up fresh opportunities in the study of quantum fluids and solid quantum surfaces and interfaces. For example it could be used for direct observation of Fomin surface excitations on liquid 3He [13], or in the search for a
superfluid transition in 2D 3He on the surface of micro-separated 3He-4He liquid mixture [28]
References
1. D.V. Osborne, J. Phys.: Condens. Matter 1, 289 (1989)
2. L.B. Lurio, T.A. Rabedeau, P.S. Pershan, Isaac F. Silvera, M. Deutsch, S.D. Kosowsky, and B.M. Ocko Phys. Rev. Lett. 68, 2628, (1992)
3. K.N. Zinoveva, ZhETF 29, 899 (1955)
4. K. Matsumoto, Y. Okuda, M. Suzuki, and S. Misawa J. of Low Temp. Phys. 125, 59 (2001)
5. K.R. Atkins Can. J. Phys. 31, 1165 (1953) 6. A.D. Singh, Phys. Rev. 125, 802 (1962)
7. K.R. Atkins and Y. Narahara Phys. Rev. 138, A437 (1965)
8. Yu. Monarkha and K. Kono Two-Dimensional Coulomb Liquids and Solids, Springer (2004)
9. C.C. Grimes and G. Adams Phys. Rev. Lett. 36, 145, (1976)
10. K. Shirahama, S. Ito, H. Suto and K. Kono J. Low Temp. Phys. 101, 439 (1995) 11. K. Shirahama, O.I. Kirichek and K. Kono Phys. Rev. Lett. 79, 4218, (1997)
12. O. Kirichek, M. Saitoh, K. Kono, F.I.B. Williams Phys. Rev. Letts, 86, 4064 (2001) 13. I.A. Fomin, Sov. Phys. JETP 34, 1371 (1972)
14. Yu.B. Ivanov, Sov. Phys. JETP 52, 549 (1980)
15. P. Roche, G. Deville, K.O. Keshishev, N.J. Appleyard, and F.I.B. Williams Phys.
Rev. Lett. 75, 3316, (1995)
16. A.G. Klein and S.A. Werner Rep. Prog. Phys. 46, 259 (1982)
17. J. Penfold and R.K. Thomas J. Phys.: Condens. Matter 2, 1369 (1990) 18. E. Fermi and W. Zinn Phys. Rev. 70, 103 (1946)
19. E. Fermi and W. Marshall Phys. Rev. 71, 666 (1947) 20. L. G. Parratt, Phys. Rev., 95(2), 359 (1954)
21. L. Nevot and P. Croce, Rev. Phys. Appl. 15, 761 (1980)
22. V.F. Sears and E.C. Svensson, Phys. Rev. Lett. 43, 2009 (1979)
23. E.C. Svensson, V.F. Sears, A.D.B. Woods, and P. Martel Phys. Rev. B 21, 3638 (1980)
24 H.N. Robkoff, D.A. Ewen, and R.B. Hallock Phys. Rev. Lett. 43, 2006 (1979) 25. J. Mayers, Phys. Rev. Lett. 84, 314 (2000)
26. A. Griffin and S. Stringari Phys. Rev. Lett. 76, 259 (1996) 27. A.F.G. Wyatt Nature 391, 56 (1998)