Identifying the evolution of stock markets
stochastic structure after the euro
Caiado, Jorge and Crato, Nuno
January 2008
Online at
https://mpra.ub.uni-muenchen.de/6609/
Identifying the evolution of stock markets stochastic structure after the
euro
Jorge Caiadoa Nuno Cratob
a
Department of Economics and Management, Escola Superior de Ciências Empresariais, Polytechnic Institute of Setúbal and CEMAPRE, Campus do IPS, Estefanilha, 2914-503 Setúbal, Portugal. Tel.: +351 265 709 438. Fax: +351 265 709 301. E-mail:
bDepartment of Mathematics, Instituto Superior de Economia e Gestão, Technical
University of Lisbon and CEMAPRE, Rua do Quelhas 6, 1200-781 Lisboa, Portugal. Tel.: +351 213 925 846. E-mail: [email protected]
Abstract: Previous studies have investigated the comovements of international eq-uity markets by using correlation, cointegration, common factor analysis, and other ap-proaches. In this paper, we investigate the stochastic structure of major euro and non-euro area stock market series from 1994 to 2006, by using cluster analysis techniques for time series. We use an interpolated-periodogram based metric for level and squared returns in order to compute distances between the stock markets. This method captures the stochastic dependence structure of the time series and solves the shortcoming of unequal sample sizes found for di¤erent countries. The clusters of countries are formed by the dendrogram and the principal coordinates associated with the sample spectrum for both the series of returns and volatilities. The empirical results suggest that the cross-country groups have become considerably more homogeneous with the introduction of the euro as an electronic currency. For reference, we also explore the pairwise correlations among the series.
Keywords: Cluster analysis; Euro area; International stock markets; Periodogram; Stock returns; Volatility.
1. Introduction
small international stock-markets correlations in periods of low volatility (small absolute returns), and much higher correlations in periods of high volatility (large absolute returns). International equity market comovements and euro area market integration have been also widely studied using vector error correction and cointegration approaches (Bessler and Yang, 2003, Syriopoulos, 2004, Tahai et al., 2004, Voronkova, 2004, Rita and Costantini, 2006), and factor model approaches (Engle and Susmel, 1993, Hui, 2005). For a review of measures of equity market integration in the euro area, see the survey by Baele et al. (2004).
The identi…cation of similarities (or dissimilarities) in international stock returns by using cluster analysis needs further research. Some studies, as Mantegna (1999) and Bonanno et al. (2001), used the Pearson correlation coe¢cient as similarity measure of a pair of stock returns. Although this can be useful to ascertain the structure of stock returns comovements, it does not take into account the information about the stochastic behavior of returns and volatilities and it cannot be directly used for comparison and grouping stocks with unequal sample sizes.
In this paper, we investigate whether the structure of stock markets change over time from before to after the introduction of the euro as an electronic currency. In addressing this issue we also attempt to analyze some important questions:
1) Is there a …nancial integration in the euro area markets? 2) How this …nancial integration changes over time?
3) Which stock markets and countries have become more integrated?
4) What is the degree of a¢nity among euro and non-euro area …nancial markets? 5) Are the cross-country a¢nities similar for returns and squared returns?
In order to compare the series, our method groups the asset return series into clus-ters, with the property that series in the same cluster have similar stochastic dependence structure and series in other clusters are quite distinct. The clusters are formed by look-ing to the dendrogram and the principal coordinates associated with the log normalized periodogram ordinates for both returns and squared returns.
In order to obtain overlapping data researchers usually delete part of the series, which has the disadvantage of using less than available information. Our method overcomes this problem by constructing interpolated periodograms where needed.
The remainder of the paper is organized as follows. Section 2 presents the distance-based methods for time series classi…cation and clustering. Section 3 describes the data set used in this paper. Section 4 presents the cluster analysis evidence for the empirical results. Section 5 explores correlations for returns and squared returns. Conclusions are summarized in the …nal section.
2. Comparing …nancial time series
In order to compare di¤erent time series and to perform their cluster analysis, we have to de…ne a relevant distance measure. Previous studies have used the contemporaneous correlation between time series data to analyze their interdependence.
cross-correlations.
With this spectral distance measure we perform a cluster analysis of the series. This way we form groups and assess in what measure they are de…ned according to euro-area boundaries. We use both return series and volatility series.
2.1. Periodogram-based distance
The periodogram is a useful tool to describe the cyclical behavior of an observed time series. It is common practice to normalize the periodogram, dividing it by the sample variance so that it captures only the autocorrelation structure. The Euclidean distance be-tween the log normalized periodogram ordinates provides a recently developed frequency domain method for time series classi…cation (Caiado et al., 2006).
LetPt; t= 1; :::; nbe the price index of a given country series. We compute the returns
as the di¤erence of log prices, rt = logPt log Pt 1. Volatility is taken as the squared
returns,r2
t. LetPx(!j) = n
1
jPnt=1rt;xe
it!jj2be the periodogram of the return seriesr
t;x
for countryx at frequencies !j = 2 j=n, j = 1; :::; m (with m = [n=2] the largest integer
less or equal to n=2), and let N Px(!j) = Px(!j)=b0;x be the normalized periodogram of
rt;x, whereb0;x is the sample variance ofrt;x. Similar expression is de…ned for N Py(!j).
A log normalized periodogram (LNP) distance measure between the returns series of countries x and y is given by
dLN P(x; y) =
v u u t m X j=1
[logN Px(!j) logN Py(!j)]
2
, (1)
This distance ful…lls the usual properties of a metric, except the triangle inequality: (i) d(x; y) = 0 if N Px(!j) = N Py(!j); (ii) d(x; y) 0; and (iii) d(x; y) = d(y; x). We
construct similar expression for the volatilities, substituting r2
t for rt. The advantages of
the above measures over other distance-based methods are that they additionally con-vey all the stochastic structure of the processes and they are easy to implement and computational fast.
For two return seriesfrt;x; t= 1; :::; nxgand frt;y; t= 1; :::; nyg with unequal sizesnx 6=
ny, we can use the periodogram interpolation method proposed by Caiado et al. (2007).
This method consist of a linear interpolation of the individual periodogram ordinates at Fourier frequencies so that we estimate the periodogram ordinates of the series with longer (shorter) length from the series with the shorter (longer) length.
Without loss of generality, let my < mx and k = [pmmxy] be the largest integer less or
equal to pmx
my for p= 1; :::; my. The interpolated periodogram ordinates for countryx are
given by
P0
x(!p) =Px(!k) + (Px(!k+1) Px(!k))
!p;y !k;x
!k+1;x !k;x
. (2)
We then use the following distance measure between the interpolated log normalized periodogram (ILNP) ordinates of the two series,
dILN P(x; y) =
v u u t my X p=1
[logN P0
x(!p) logN Py(!p)]
2
where N P0
x(!p) is the interpolated normalized periodogram of the longer series and
N Py(!p)is the normalized periodogram of the shorter series. This approach can be quite
useful since the usual metrics based on the Euclidean distances and pairwise correlations cannot be directly used for comparison of …nancial time series with unequal length.
2.2. Cluster analysis
For each data set, we compute a distance matrix withc(c 1)=2di¤erent pairs (where
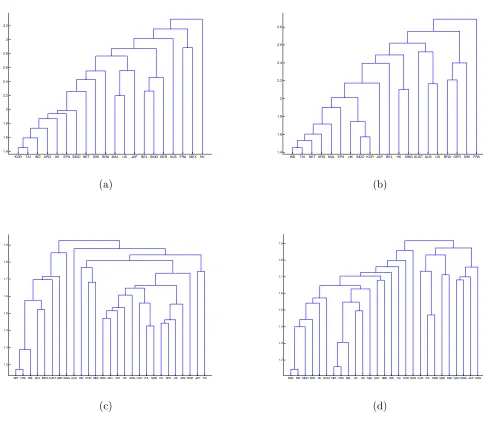
c is the number of countries) using the ILNP metric (3) for both returns and squared returns. We group the time series using the hierarchical clustering tree (or dendrogram) by complete linkage method (see for instance, Johnson and Wichern, 1992) which minimizes the maximum distance between time series features in the same group in such a way that series in the same group are similar to one another and series in di¤erent groups are as distinct as possible. We consider also the useful technique of multidimensional scaling, which creates a con…guration of c points in a map of p dimensions (in this case, two dimensions) with the Euclidean distances among stock markets using the information about the time series stochastic features.
3. Data description
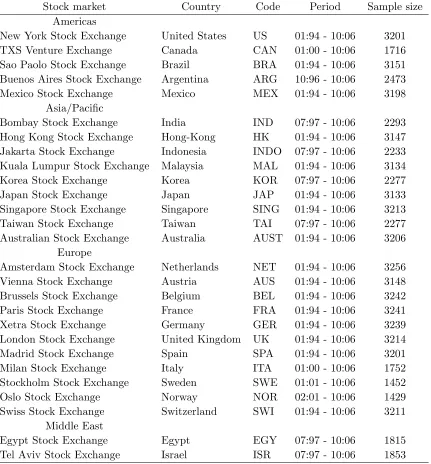
We consider data of daily index returns for 27 international stock markets from the Americas, Asia and Paci…c, Europe and Middle East. Data are reported in Table 1 and cover the period from 1994 to 2006. Data correspond to closing prices adjusted for dividends and splits (http://…nance.yahoo.com).
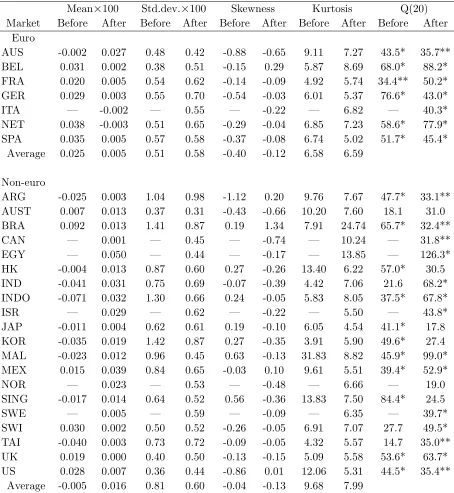
Table 2 reports summary statistics (mean, standard deviations, skewness, and kurtosis coe¢cients, and Ljung-Box test for thek-th autocorrelations) of the indices returns for the sample periods previous (1994-1998) and subsequent (1999-2006) to the introduction of the euro as an electronic currency. Before euro, we found negative skewness coe¢cients for all markets except Brazil, Hong-Kong, Indonesia, Japan, Korea, Malaysia and Singapore, which show small positive skewness coe¢cients. After euro, Belgium and the non-euro countries Argentina, Brazil, Mexico and U.S. exhibit a positive skewness. The return series for all the markets are highly leptokurtic except France, India, Korea and Taiwan (before euro), and Japan (after euro), which have moderate (less than 5) excess of kurtosis. In general, the euro area markets show lower excess of kurtosis than the non-euro area markets for both sample periods. There are signi…cant autocorrelations up to order 20 in the returns for all markets but Australia, India, Switzerland and Taiwan (before euro), and Australia, Hong-Kong, Japan, Korea, Norway and Singapore (after euro), which do not reject the null hypothesis of no autocorrelation at the 5% signi…cance level.
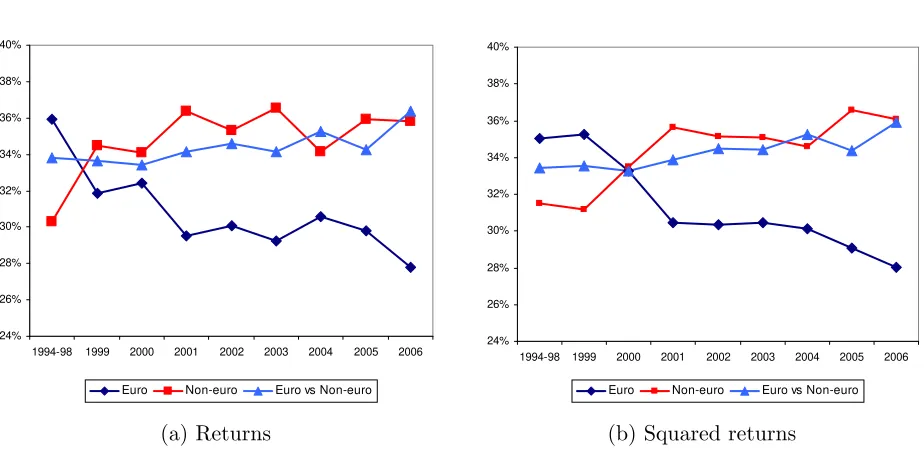
4. Stochastic structure analysis
Figure 1 shows the relative average distances among euro, non-euro and euro versus non-euro stock markets using the periodogram-based metric de…ned in (3). These plots clearly suggest that the euro area countries tend to become more homogeneous over time and their relative distance increased with respect to the non-euro area countries. Results are similar for both returns and squared returns.
Table 1
Daily indices of 27 international stock markets
Stock market Country Code Period Sample size Americas
New York Stock Exchange United States US 01:94 - 10:06 3201 TXS Venture Exchange Canada CAN 01:00 - 10:06 1716 Sao Paolo Stock Exchange Brazil BRA 01:94 - 10:06 3151 Buenos Aires Stock Exchange Argentina ARG 10:96 - 10:06 2473 Mexico Stock Exchange Mexico MEX 01:94 - 10:06 3198
Asia/Paci…c
Bombay Stock Exchange India IND 07:97 - 10:06 2293 Hong Kong Stock Exchange Hong-Kong HK 01:94 - 10:06 3147 Jakarta Stock Exchange Indonesia INDO 07:97 - 10:06 2233 Kuala Lumpur Stock Exchange Malaysia MAL 01:94 - 10:06 3134 Korea Stock Exchange Korea KOR 07:97 - 10:06 2277 Japan Stock Exchange Japan JAP 01:94 - 10:06 3133 Singapore Stock Exchange Singapore SING 01:94 - 10:06 3213 Taiwan Stock Exchange Taiwan TAI 07:97 - 10:06 2277 Australian Stock Exchange Australia AUST 01:94 - 10:06 3206
Europe
Amsterdam Stock Exchange Netherlands NET 01:94 - 10:06 3256 Vienna Stock Exchange Austria AUS 01:94 - 10:06 3148 Brussels Stock Exchange Belgium BEL 01:94 - 10:06 3242 Paris Stock Exchange France FRA 01:94 - 10:06 3241 Xetra Stock Exchange Germany GER 01:94 - 10:06 3239 London Stock Exchange United Kingdom UK 01:94 - 10:06 3214 Madrid Stock Exchange Spain SPA 01:94 - 10:06 3201 Milan Stock Exchange Italy ITA 01:00 - 10:06 1752 Stockholm Stock Exchange Sweden SWE 01:01 - 10:06 1452 Oslo Stock Exchange Norway NOR 02:01 - 10:06 1429 Swiss Stock Exchange Switzerland SWI 01:94 - 10:06 3211
Middle East
Table 2
Summary statistics for daily euro area and non-euro area stock-market returns Mean 100 Std.dev. 100 Skewness Kurtosis Q(20) Market Before After Before After Before After Before After Before After
Euro
AUS -0.002 0.027 0.48 0.42 -0.88 -0.65 9.11 7.27 43.5* 35.7** BEL 0.031 0.002 0.38 0.51 -0.15 0.29 5.87 8.69 68.0* 88.2* FRA 0.020 0.005 0.54 0.62 -0.14 -0.09 4.92 5.74 34.4** 50.2* GER 0.029 0.003 0.55 0.70 -0.54 -0.03 6.01 5.37 76.6* 43.0* ITA — -0.002 — 0.55 — -0.22 — 6.82 — 40.3* NET 0.038 -0.003 0.51 0.65 -0.29 -0.04 6.85 7.23 58.6* 77.9* SPA 0.035 0.005 0.57 0.58 -0.37 -0.08 6.74 5.02 51.7* 45.4*
Average 0.025 0.005 0.51 0.58 -0.40 -0.12 6.58 6.59
Non-euro
ARG -0.025 0.003 1.04 0.98 -1.12 0.20 9.76 7.67 47.7* 33.1** AUST 0.007 0.013 0.37 0.31 -0.43 -0.66 10.20 7.60 18.1 31.0 BRA 0.092 0.013 1.41 0.87 0.19 1.34 7.91 24.74 65.7* 32.4** CAN — 0.001 — 0.45 — -0.74 — 10.24 — 31.8** EGY — 0.050 — 0.44 — -0.17 — 13.85 — 126.3* HK -0.004 0.013 0.87 0.60 0.27 -0.26 13.40 6.22 57.0* 30.5 IND -0.041 0.031 0.75 0.69 -0.07 -0.39 4.42 7.06 21.6 68.2* INDO -0.071 0.032 1.30 0.66 0.24 -0.05 5.83 8.05 37.5* 67.8* ISR — 0.029 — 0.62 — -0.22 — 5.50 — 43.8* JAP -0.011 0.004 0.62 0.61 0.19 -0.10 6.05 4.54 41.1* 17.8 KOR -0.035 0.019 1.42 0.87 0.27 -0.35 3.91 5.90 49.6* 27.4 MAL -0.023 0.012 0.96 0.45 0.63 -0.13 31.83 8.82 45.9* 99.0* MEX 0.015 0.039 0.84 0.65 -0.03 0.10 9.61 5.51 39.4* 52.9* NOR — 0.023 — 0.53 — -0.48 — 6.66 — 19.0 SING -0.017 0.014 0.64 0.52 0.56 -0.36 13.83 7.50 84.4* 24.5 SWE — 0.005 — 0.59 — -0.09 — 6.35 — 39.7* SWI 0.030 0.002 0.50 0.52 -0.26 -0.05 6.91 7.07 27.7 49.5* TAI -0.040 0.003 0.73 0.72 -0.09 -0.05 4.32 5.57 14.7 35.0** UK 0.019 0.000 0.40 0.50 -0.13 -0.15 5.09 5.58 53.6* 63.7* US 0.028 0.007 0.36 0.44 -0.86 0.01 12.06 5.31 44.5* 35.4**
Average -0.005 0.016 0.81 0.60 -0.04 -0.13 9.68 7.99
24% 26% 28% 30% 32% 34% 36% 38% 40%
1994-98 1999 2000 2001 2002 2003 2004 2005 2006
Euro Non-euro Euro vs Non-euro
(a) Returns
24% 26% 28% 30% 32% 34% 36% 38% 40%
1994-98 1999 2000 2001 2002 2003 2004 2005 2006
Euro Non-euro Euro vs Non-euro
[image:8.612.74.536.130.357.2](b) Squared returns
Figure 1. Evolution of relative average distances among stock-market stochastic features for (a) returns and (b) squared returns
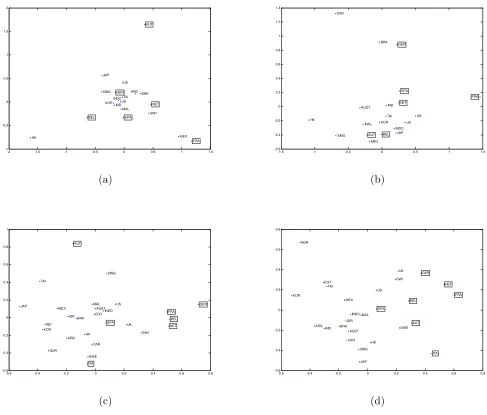
of the time series of daily stock-market indices using all available data in the sample periods 1994-1998 (for all countries except Egypt, Canada, Italy, Sweden, Norway and Israel) and 1999-2006 with the introduction of the euro (for all countries). For better visualizing the clusters, on the plots we dropped the outlier countries Australia and Mexico for mean and squared return analysis, respectively.
Figure 2 focus on the multidimensional scaling approach (also known as principal co-ordinates analysis) associated with the log normalized periodogram co-ordinates in sample periods 1994-1998 and 1999-2006.
On the period previous to the introduction of the euro, all the markets seem to be close for level returns, except Hong-Kong, Austria, Mexico and France. Looking at the map for squared returns, we see that some current euro area markets are at di¤erent locations; for instance, Austria and Belgium are close to the major Asian markets, Germany is close to Brazil in a distinct cluster, and France seems to be an outlier.
After euro, we found that the euro area countries (with the exception of Austria for mean returns) are close together and close to United States, United Kingdom, Switzerland and Sweden. The South/Middle American, the Asian/Paci…c and the Middle East markets tend to cluster together. Austria and Norway markets are clear outliers for mean and squared returns, respectively.
-2 -1.5 -1 -0.5 0 0.5 1 1.5 -1 -0.5 0 0.5 1 1.5 2 NET AUT BEL IND BRA FRA GER UK HK SPA INDO MAL KOR ARG MEX JAP US SWI SING TAI (a)
-1.5 -1 -0.5 0 0.5 1 1.5
-0.6 -0.4 -0.2 0 0.2 0.4 0.6 0.8 1 1.2 1.4 NET AUST AUT BEL IND BRA FRA GER UK HK SPA INDO MAL KOR ARG JAP US SWI SING TAI (b)
-0.6 -0.4 -0.2 0 0.2 0.4 0.6 0.8
-0.6 -0.4 -0.2 0 0.2 0.4 0.6 0.8 1 NET AUST AUT BEL IND BRA FRA EGY GER UK CAN HK SPA INDO MAL KOR ARG ITA MEX JAP US SWE NOR SWI SING ISR TAI (c)
-0.6 -0.4 -0.2 0 0.2 0.4 0.6 0.8
[image:9.612.114.601.210.625.2]-0.6 -0.4 -0.2 0 0.2 0.4 0.6 0.8 NET AUST AUT BEL IND BRA FRA EGY GER UK CAN HK SPA INDO MAL KOR ARG ITA MEX JAP US SWE NOR SWI SING ISR TAI (d)
KORTAI INDARGUK SPA INDO NETSWIBRAMAL US JAP BEL SING GERAUSFRAMEXHK 1.4
1.6 1.8 2 2.2 2.4 2.6 2.8 3 3.2
(a)
IND TAINETARGMAL SPA UK INDO KORJAPBEL HKSING AUST AUS US BRAGERSWIFRA 1.4
1.6 1.8 2 2.2 2.4 2.6 2.8
(b)
NET FRABEL EGY INDO AUST GER SING AUSIND KOR MEX BRA MALISRHKARG CAN ITASWE UKSPAUSSWI NOR JAPTAI 1.2
1.3 1.4 1.5 1.6 1.7 1.8 1.9
(c)
BRAISR INDO SPAHK AUST NET FRABELUKUSMAL EGY MEXINDTAI KOR NOR AUSITASWE GER SWI CAN SING JAP ARG 1.2
1.3 1.4 1.5 1.6 1.7 1.8 1.9
[image:10.612.92.575.205.644.2](d)
5. Cross-correlation analysis
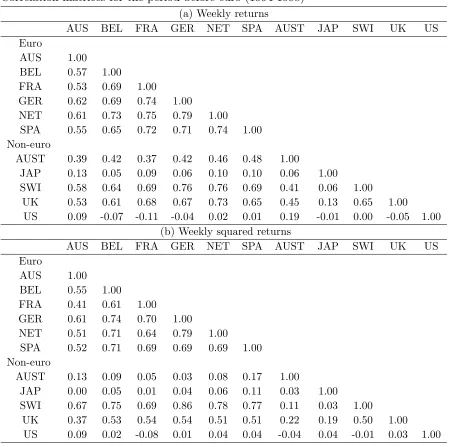
To complement the previous analysis, we studied the pairwise correlation between data for all countries It is not possible to do so directly with the available data Non-trading days and holidays are not the same in di¤erent countries. To make data corrections is di¢cult and subject to too many errors. As it is usually done (e.g., Engle and Susmel, 1993), we used weekly series constructed by aggregation. We got a total of 678 weekly observations for the period 1994-2006.
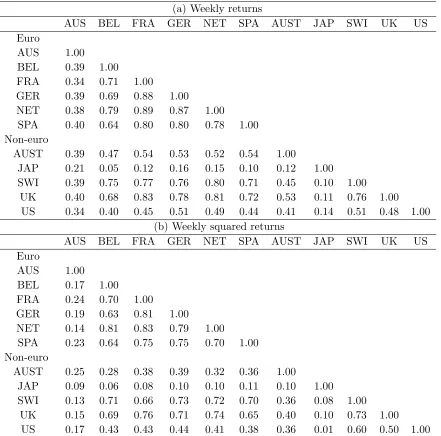
Tables 3 and 4 show the correlation matrices for the weekly returns and squared returns in both sample periods under study. For simplicity, we present in the tables the euro area markets Netherlands, Austria, Belgium, France, Germany and Spain, and only the non-euro area markets for United Kingdom, Switzerland, United States, Australia and Japan. Before euro, it can be seen that correlations among current euro area market returns and squared returns are high (i.e., more than 0.6) except for Austria. As expected, there are very high correlations between neighboring countries Netherlands, France and Ger-many, and relatively high correlations among all euro area countries. For squared returns, there are 3 correlations higher than 0.7 among euro area markets Belgium, Germany, Netherlands and Spain, and 4 correlations higher than 0.7 between these euro area mar-kets and Switzerland. After euro, there are 8 mean correlations and 5 squared correlations higher than 0.7 among euro area markets (with the exception of Austria), and 9 mean correlations and 6 squared correlations higher than 0.7 between euro area markets (except Austria) and non-euro area markets Switzerland and United Kingdom.
Before 1999, no euro area country shows mean and squared correlations higher than 0.1 with United States nor higher than 0.2 with Japan. After euro, such correlations are much higher with the United States (the lowest mean and squared correlations are 0.34 and 0.17 with Austria) but do not increase with the Japan. In contrast, the squared correlations between Switzerland and Austria, and between Austria and Germany decrease from 0.67 to 0.13 and from 0.61 to 0.19 before to after the euro.
In general, mean correlations are slightly higher than squared correlations. These results are in agreement with some existing …ndings in international stock-market comovements literature. For instance, Engle and Susmel (1993) have found lower squared correlations among European stock markets than in level returns.
6. Concluding remarks
In this paper, we investigated the evolution of similarities among major euro and non-euro area stock markets in the period 1994-2006.
We performed a cluster analysis using a sample-spectrum based metric for daily stock indices returns and squared returns. This approach provides useful information about the time series behavior in terms of the stochastic dependence and volatility e¤ects, and solves the shortcoming of unequal sample sizes found for di¤erent countries.
Table 3
Correlation matrices for the period before euro (1994-1998) (a) Weekly returns
AUS BEL FRA GER NET SPA AUST JAP SWI UK US Euro
AUS 1.00
BEL 0.57 1.00
FRA 0.53 0.69 1.00
GER 0.62 0.69 0.74 1.00
NET 0.61 0.73 0.75 0.79 1.00
SPA 0.55 0.65 0.72 0.71 0.74 1.00 Non-euro
AUST 0.39 0.42 0.37 0.42 0.46 0.48 1.00
JAP 0.13 0.05 0.09 0.06 0.10 0.10 0.06 1.00
SWI 0.58 0.64 0.69 0.76 0.76 0.69 0.41 0.06 1.00
UK 0.53 0.61 0.68 0.67 0.73 0.65 0.45 0.13 0.65 1.00 US 0.09 -0.07 -0.11 -0.04 0.02 0.01 0.19 -0.01 0.00 -0.05 1.00
(b) Weekly squared returns
AUS BEL FRA GER NET SPA AUST JAP SWI UK US Euro
AUS 1.00
BEL 0.55 1.00
FRA 0.41 0.61 1.00
GER 0.61 0.74 0.70 1.00
NET 0.51 0.71 0.64 0.79 1.00
SPA 0.52 0.71 0.69 0.69 0.69 1.00 Non-euro
AUST 0.13 0.09 0.05 0.03 0.08 0.17 1.00
JAP 0.00 0.05 0.01 0.04 0.06 0.11 0.03 1.00
SWI 0.67 0.75 0.69 0.86 0.78 0.77 0.11 0.03 1.00
Table 4
Correlation matrices for the period after euro (1999-2006) (a) Weekly returns
AUS BEL FRA GER NET SPA AUST JAP SWI UK US Euro
AUS 1.00
BEL 0.39 1.00
FRA 0.34 0.71 1.00
GER 0.39 0.69 0.88 1.00
NET 0.38 0.79 0.89 0.87 1.00
SPA 0.40 0.64 0.80 0.80 0.78 1.00 Non-euro
AUST 0.39 0.47 0.54 0.53 0.52 0.54 1.00
JAP 0.21 0.05 0.12 0.16 0.15 0.10 0.12 1.00 SWI 0.39 0.75 0.77 0.76 0.80 0.71 0.45 0.10 1.00
UK 0.40 0.68 0.83 0.78 0.81 0.72 0.53 0.11 0.76 1.00 US 0.34 0.40 0.45 0.51 0.49 0.44 0.41 0.14 0.51 0.48 1.00
(b) Weekly squared returns
AUS BEL FRA GER NET SPA AUST JAP SWI UK US Euro
AUS 1.00
BEL 0.17 1.00
FRA 0.24 0.70 1.00
GER 0.19 0.63 0.81 1.00
NET 0.14 0.81 0.83 0.79 1.00
SPA 0.23 0.64 0.75 0.75 0.70 1.00 Non-euro
AUST 0.25 0.28 0.38 0.39 0.32 0.36 1.00
JAP 0.09 0.06 0.08 0.10 0.10 0.11 0.10 1.00 SWI 0.13 0.71 0.66 0.73 0.72 0.70 0.36 0.08 1.00
Volatilities show a more clear grouping of euro area countries in a distinct cluster. In contrast, from correlation analysis, we found that the correlations of returns and volatilities among euro area countries do not change signi…cantly from before to after the introduction of the euro.
Acknowledgment: This research was supported by a grant from the Fundação para a Ciência e Tecnologia (FEDER/POCI 2010). Comments from participants in the 11th International Conference on Macroeconomic Analysis and International Finance and 26th International Symposium on Forecasting are gratefully acknowledged.
REFERENCES
1. Baele, L., Ferrando, A., Hördahl, P., Krylova, E. and Monnet, C. (2004). "Measuring …nancial integration in the euro area", Occasional Paper Series No. 14, European Central Bank.
2. Bessler, D. and Yang, J. (2003). "The structure of interdependence in international stock markets", Journal of International Money and Finance, 22, 261-287.
3. Bonanno G., Lillo F., and Mantegna, R. N. (2001). "High-frequency cross-correlation in a set of stocks", Quantitative Finance, 1, 96-104.
4. Caiado, J., Crato, N. and Peña, D. (2006). "A periodogram-based metric for time series classi…cation", Computational Statistics & Data Analysis, 50, 2668-2684. 5. Caiado, J., Crato, N. and Peña, D. (2007). "Comparison of time series with unequal
length", manuscript.
6. Engle, R. and Susmel, R. (1993). "Common volatility in international equity markets",
Journal of Business & Economic Statistics, 11, 167-176.
7. Hui, T. (2005). "Portfolio diversi…cation: a factor analysis approach", Applied Financial Economics, 15, 821-834.
8. Johnson, R. A. and Wichern, D. W. (1992).Applied Multivariate Statistical Analysis. 3rd Ed., Englewood Cli¤s, Prentice-Hall.
9. Karolyi, G. and Stulz, R. (1996). "Why do markets move together? An investigation of U.S.-Japan return comovements", The Journal of Finance, 51, 951-986.
10. Lin, W., Engle, R. and Ito, T. (1994). "Do bulls and bears move across borders? International transmission of stock returns and volatility", The Review of Financial Studies, 7, 507-538.
11. Longin, F. and Solnik, B. (1995). "Is the correlation in international equity returns constant: 1960-1990?", Journal of International Money and Finance, 14, 3-26. 12. Mantegna, R. N. (1999). "Hierarchical structure in …nancial markets", The European
Physical Journal B, 11, 193-197.
13. Morana, C. and Beltratti, A. (2007). "Comovements in international stock markets",
Journal of International Financial Markets, Institutions and Money, in press.
14. Rita, D. and Costantini, M. (2006). "Comovements and correlations in international stock markets", The European Journal of Finance, 12, 567-582.
15. Syriopoulos, T. (2004). "International portfolio diversi…cation to Central European stock markets", Applied Financial Economics, 14, 1253-1268.
integra-tion for the group of seven (G7) industrialized countries using an I(2) cointegraintegra-tion model", Applied Financial Economics, 14, 327-335.