http://dx.doi.org/10.4236/ib.2013.54019
Technical Efficiency in the Container Terminals in Mexico,
1982-2010: Through Data Envelopment Analysis (DEA)
Odette V. Delfín-Ortega, César L. Navarro-Chávez
Institute of Economic and Business Research, Universidad Michoacana de San Nicolás de Hidalgo, Morelia, México. Email: [email protected], [email protected]
Received October 28th, 2013; revised November 18th, 2013; accepted December 2nd, 2013
Copyright © 2013 Odette V. Delfín-Ortega, César L. Navarro-Chávez. This is an open access article distributed under the Creative Commons Attribution License, which permits unrestricted use, distribution, and reproduction in any medium, provided the original work is properly cited.
ABSTRACT
The paper shows an analysis of the global technical efficiency of container terminals of the main ports of Mexico in the period 1982-2010, through Data Envelopment Analysis (DEA). This methodology allows us to measure each decision unit evaluated in relation to other homogeneous units. The aim of the study is to determine the importance of global technical efficiency, pure technical efficiency and scale efficiency in the ports of México. For this purpose, quay length and number of employees are used as input and as output of the number of containers. The results show that the Mexi-can ports in general have a low technical global efficiency and only the ports showed that technical global efficiency, technical pure efficiency and scale efficiency were Veracruz and Tuxpan in the year 1982, and Manzanillo and Lazaro Cárdenas in the year 2010. For that reason, it requires better operability which means greater mobility of TEUs.
Keywords: Technical Efficiency; Data Envelopment Analysis; Mexico Ports
1. Introduction
The ports are a very important part in the development of a country, allowing a more efficient transport system. The efficient operation of any of the activities taking place within the port is important for products using shipping to reach the end consumer markets at minimum cost and in the shortest time possible.
In the specific case of container terminals, the market for container services of maneuvers comprises different services that are used to move a container between the boat and land transportation. Additionally, shipping com- panies, as users, demand high productivity services, so that, to the extent that is greater, the time spent on the boat will be lower, as well as the costs for the use of port infrastructure [1].
Developing efficient port operations can significantly improve the export competitiveness of a nation and the availability of imported products.
The aim of this investigation is to determine the im- portance of global technical efficiency, technical pure efficiency and scale efficiency in the ports of México and we consider the hypothesis that the container terminals in Mexico have a low global technical efficiency because
they have not achieved significant improvements in the scale of production.
2. Literature Review
Efficiency is defined as “the degree of optimization of the results obtained in relation to the resources used” [2]. Another definition that nicely illustrates the efficiency is “the relationship between the goods and services con- sumed and goods and services produced, or what is the same, for services rendered (outputs) in relation to the resources used for this purpose (inputs)” [3].
techni-cal efficiency.
The scheme proposed by him, with the following components, technical, allocative and overall efficiency. In this sense, a particular production process is techni-cally efficient when starting from a certain inputs and assuming a fixed production technology, it achieves the highest possible level of output. Allocative efficiency is achieved, on the other hand, when knowing the prices of inputs and assuming that there may be changes in pro-duction technology, their combination allows to achieve a given level of output at the lowest cost.
DEA models can be classified according to:
• The type of efficiency measure that provide: radial and non-radial models.
• The orientation of the model: input-oriented, output- oriented or input-output oriented.
• The types of returns to scale production technology characterized understood as the way in which the factors of production can be characterized by the existence of returns to scale: constant or variable to scale.
Farrell study is complemented by the work of Charnes, Cooper and Rhodes [4], which started at constant yield CRS, such that a change in the levels of inputs leads to a proportional change in the output level, which requires many optimizations as decision units (DMU). It has two orientations: input (a comparison between the minimum level of inputs required for a given level of outputs, and actually taken) and output orientation: (A comparison of the maximum attainable output for a given level of inputs, and the actually achieved). The CCR model works with constant returns to scale, which means that the DMU which has the highest ratio of input product (higher slope) establish the efficiency frontier and DMUs would be accepted under this frontier are considered inefficient DMUs. It can be written in general terms in 3 ways: frac-tional, multiplicative and enveloping.
It shows the linear programming model guidance out-put:
1 1
1
1 1
,
max s.t 1
0
0 ,
s m
k kp j jp
k j
s m
k ki j j
k j
k j
V Y U X
V Y U X
i V U k j
(1)
The assumption of CRS is not always appropriate in real life contexts, later, Banker, Charnes and Cooper [9] extended the original model to include variable returns to scale (VRS). They considerated various circumstances such as imperfect competition, restrictions on access to funding sources, etc. It can cause the units not operating at optimal scale and modifying the linear program so that they enter a convexity constraint. To differentiate it from the previous model is called variable returns to scale (VRS). Being the output-oriented model as follows:
1
1 1
max
Y 0, ,
1, s.t
0; 0 1
, , 1, , , , l
f if iz
n o
rz f r
f f f n f f z n i
X S X
Y S r Z
n m S f
, (2)This modification allowed to decompose the global technical efficiency (GTE) into Pure Technical Effi-ciency (PTE) and Scale EffiEffi-ciency (SE). For this, it is necessary calculate two models: CRS and VRS on the same data, if there is a difference in the two measure-ments for a particular DMU, then it means that the DMU has scale inefficiency and inefficiency value is the dif-ference between the CRS and VRS measurement.
Pure Technical Efficiency matches with VRS meas-urement. Scale inefficiency arises of producing a scale level is not optimal, considering as such the scale ob-tained from the efficient activity of the signatures (CRS = 1).
The Global Technical Efficiency is the product of the two efficiencies: pure technical and scale and its meas-urement matches with CRS.
Global technical efficiency is then represented fol-lows:
GTEETP SE (3) If SE = 1, then ETG = ETP, indicating that the unit has no scale inefficiency and therefore operates in an optimal scale [10]. Scale efficiency measures the impact of scale size on the productivity of a DMU (see Figure 1).
The scale efficiency of firm D relates to the distance from the technically efficient data point E, to the CRS technology and is equal to [11]:
SE GF GE
(4)
and TECRSGF GD (5)
then
SE TECRS TEVRS
GF GD GE GD GF GE
(6)
After calculating the scale inefficiency, it can analyze what kind of returns are those which cause such ineffi-ciency, if the DMU exceeds the size of production scale, and therefore presents decreasing returns to scale, or if it has returns to scale, and therefore not has reached the limit of growth provided by this situation.
Ports Efficiency
Several authors have studied the efficiency of the ports as it shows:
Eduardo Martínez-Budria, Díaz-Armas and Navarro Ibañez [12]. They analyzed the efficiency of Spanish port services, using the DEA-BCC technique and they used for inputs number of employees, quay length, surface area, labor cost, capital cost and number of passengers and for outputs: containerized cargo, general bulk cargo, liquid bulk, solid cargo bulk, income payment area and Payment for private users.
Park and De [13] realized an analysis of port effi-ciency using the DEA-CCR model and DEA-BCC in Korean ports. They used for inputs berthing capacity, cargo handling capacity, profitability and Revenues for outputs they used loading throughput, number of vessels, commercialization, global throughput, customer satisfac-tion. The study finds that alternative DEA is a potentially powerful approach to the evaluation of the overall effi-ciency of seaports.
Ramón Sala, Molinos-Senante and Amparo Medal [14] analysed the efficiency of 28 Spanish ports using a non- radial DEA model: the Russell Measure. They used for inputs quay length, surface terminal, number of cranes and number of employees and for outputs: number of full containers 20’, number of empty containers of 20’, num-ber of full containers of 40’, numnum-ber of empty containers of 40’. They used this methodology in order to obtain the efficiency score for each of the inputs analyzed. As re-sults of the analysis, they concluded that the Spanish Port System has generally a high average level of efficiency but it could grow around 20% to consider that all ports operate on the efficient frontier.
Cullinane et al. [15] studied the technical efficiency of port container terminal, using the DEA model CCR and DEA-BCC too. They used for inputs Terminal length, terminal area, quayside gantry, yard gantry and straddle carrier and for outputs they used Containers throughput.
The paper presents the pros and cons of port privatization and provides an empirical examination of the relationship between privatization and relative efficiency within the container port industry.
Joyce Low[16] realized a study to provide an assess-ment on the required waterside and quayside capacity of 23 major Asian ports and estimate their inefficiency cost associated with excess capacity. She applied an integrated suite of DEA models (CCR, BCC, SBM, Congestion and
Measure-Specific) to measure the efficiency in the ports. The application of an integrated suite of DEA models enables more insights to be gleaned and better result validation, since ports differ in terms of their scale of operations, output demand and natural endowments. The findings from this research show that ports in Asia are generally characterized by constant or increasing returns to scale.
3. Methodology
Model Specifications: In the measurement of technical global efficiency, we works the Constant Returns to Scale (CRS) and Variable Returns to Scale ( VRS ) DEA models, with output-oriented because it is intended to analyze the possibility of maximizing the number of TEUs1 with the inputs you have.
One calculates the technical global efficiency, as well as pure technical and scale efficiency, that the Decision Making Units (DMU’s) have had. The sample ports are those that moved containers during the period 1982-201. They are ports of Mazatlan, Manzanillo, Lazaro Car- denas, Altamira, Tuxpan, Veracruz, Progress and Salina Cruz. It is necessary also to consider that the number of DMUs must be at least two times the total number of inputs and outputs considered [17]. In this research in- puts used are: dock length and number of employees and outputs: number of TEUs handled annually (see Table 1).
In order to obtain data that model the production func- tion, different sources were used:
1) Statistical yearbooks of ports in México in the Sec- tion Container Movement Coordination Ports and Mer- chant Marine SCT [18],
2) Port’s development plans for selected periods.
4. Results and Discussion
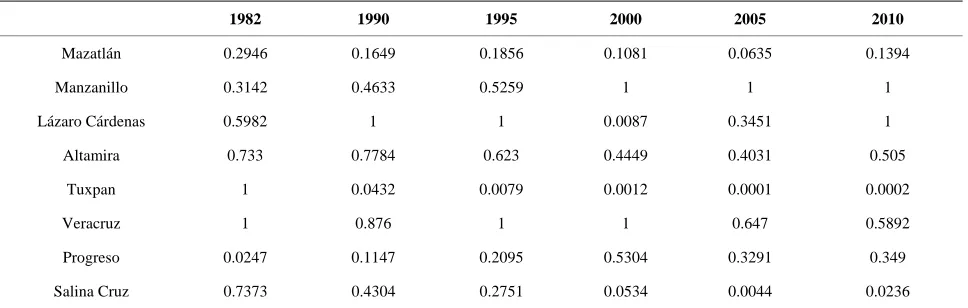
In general there was a low global technical efficiency in the port sector in Mexico during the period under study. However, the port of Manzanillo stands out as it is effi-cient for the period 2000-2010, while the ports of Lazaro Cardenas and Veracruz, although efficient for some years are not known for having continuity in this indicator. In the particular case of Lazaro Cardenas in 2000, was minimal movement of containers that had compared to other years, which led to the fact that it had the lowest level of efficiency in the figures obtained for this port. Tuxpan, Salina Cruz and Mazatlan are in a difficult posi-tion in terms of technical global efficiency, not only for its steep downward trend but for their minimum values on measures of efficiency (see Table 2).
1Twenty-foot equivalent unit (TEU) it is used to describe the capacity
Table 1. Number of containers handled at the ports of Mexico 1982-2010.
1982 1990 1995 2000 2005 2010
Mazatlan 2611 4086 10,012 16,813 17,559 25,795
Manzanilo 3133 32,792 86,938 426,717 872,386 1,511,378
Lázaro Cárdenas 2088 24773 55,109 752 132,479 796,023
Altamira 14,620 55,093 102,996 182,545 324,601 488,013
Tuxpan 18,066 1020 391 104 15 18
Veracruz 33,575 110,019 222,959 540,014 620,858 661,653
Progreso 82 3125 11,545 56,581 71,769 56,434
Salina Cruz 12,009 20,311 14,404 5413 922 5432
Source: General Coordination of Ports and Merchant Marine, 2012.
Table 2. Global technical efficiency in ports of México 1982-2010.
1982 1990 1995 2000 2005 2010
Mazatlán 0.2946 0.1649 0.1856 0.1081 0.0635 0.1394
Manzanillo 0.3142 0.4633 0.5259 1 1 1
Lázaro Cárdenas 0.5982 1 1 0.0087 0.3451 1
Altamira 0.733 0.7784 0.623 0.4449 0.4031 0.505
Tuxpan 1 0.0432 0.0079 0.0012 0.0001 0.0002
Veracruz 1 0.876 1 1 0.647 0.5892
Progreso 0.0247 0.1147 0.2095 0.5304 0.3291 0.349
Salina Cruz 0.7373 0.4304 0.2751 0.0534 0.0044 0.0236
Source: Personal compilation based on DEA results.
Subsequently it performed global technical efficiency (GTE), disaggregated into technical pure efficiency (TPE) and efficiency scale (ES). The results allow us to distin-guish situations in which a production unit may be tech-nically efficient but not placed in the optimal scale of production.
By 1982, the most efficient ports were Tuxpan and Veracruz, as both pure technical efficiency and scale efficiency had the highest weight. They could use a smaller amount of inputs required to meet demand, plus they had an optimal production scale. On the opposite side are Mazatlan, Manzanillo, Altamira and Salina Cruz, who were not efficient in any of the categories consid-ered. The port of Progreso although proved to be techni-cally efficient in the area of pure efficiency, was not placed in the optimal scale of production (see Table 3).
In the year 2010 the ports of Manzanillo and Lazaro Cardenas are the most efficient in both pure and scale efficiency. Tuxpan was the one that had the lowest tech-nical global efficiency score, this was due to substantially decreased the number of TEUs, reflecting the efficiency of very small scale, although in pure technical efficiency
it was shown to be efficient.
4.1. Benchmarking
With Benchmarking analysis one identifies the DMUs that are considered as a reference for the inefficient DMUs, having similar characteristics. It is observed that both in the year 1982 and 2010, the Port of Lazaro Cardenas is the one most often taken as the reference port. The ports of Mazatlan, Manzanillo, Altamira and Salina Cruz were less efficient ports in 1982, so one makes reference to Lazaro Cardenas, Tuxpan and Ve-racruz. Already in 2010, the most inefficient ports took to Manzanillo and Lazaro Cardenas as reference (see Table 4).
4.2. Slacks Analysis
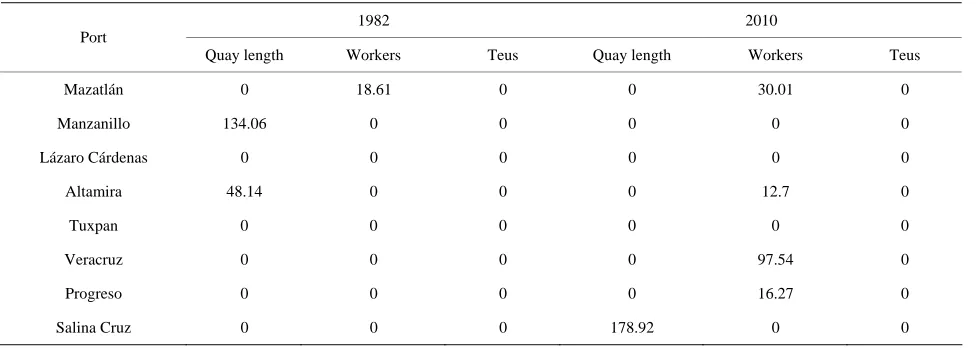
[image:4.595.57.541.294.448.2]the case of quay length for 1982 the port of Manzanillo and Altamira had 134.06 and 48.14 meters wasted re-spectively while the port of Salina Cruz in 2010 had
178.92 meters unused. It would have been more efficient to use this input at its full strength (see Table 5).
[image:5.595.55.541.148.318.2]The most important contribution in this study is that it
Table 3. Efficiency in ports of México 1982-2010.
1982 2010 Port
GTE TPE ES GTE TPE ES
Mazatlán 0.2946 0.794 0.3711 0.1394 0.3061 0.4554
Manzanillo 0.3142 0.4501 0.6979 1 1 1
Lázaro Cárdenas 0.5982 1 0.5982 1 1 1
Altamira 0.733 0.7753 0.9454 0.505 0.5543 0.9109
Tuxpan 1 1 1 0.0002 1 0.0002
Veracruz 1 1 1 0.5892 0.7428 0.7931
Progreso 0.0247 1 0.0247 0.349 0.989 0.3528
Salina Cruz 0.7373 0.8026 0.9186 0.0236 0.2765 0.0852
[image:5.595.57.539.356.513.2]Source: Personal compilation based on DEA results.
Table 4. Benchmarking analysis of the port sector in Mexico 1982-2010.
Port 1982 2010
Mazatlán 3 (0.97) 5 (0.03) 3 (0.11) 5 (0.89)
Manzanillo 3 (0.97) 6 (0.03) 2
Lázaro Cárdenas 3 3
Altamira 3 (0.6) 6 (0.4) 2 (0.12) 3 (0.88)
Tuxpan 5 5
Veracruz 6 2 (0.13) 3 (0.87)
Progreso 7 3 (0.07) 5 (0.93)
Salina Cruz 3 (0.68) 5 (0.02) 6 (0.31) 2 (0.01) 5 (0.99)
Source: Personal compilation based on DEA results.
Table 5. Slacks variables analysis 1982-2010.
1982 2010 Port
Quay length Workers Teus Quay length Workers Teus
Mazatlán 0 18.61 0 0 30.01 0
Manzanillo 134.06 0 0 0 0 0
Lázaro Cárdenas 0 0 0 0 0 0
Altamira 48.14 0 0 0 12.7 0
Tuxpan 0 0 0 0 0 0
Veracruz 0 0 0 0 97.54 0
Progreso 0 0 0 0 16.27 0
Salina Cruz 0 0 0 178.92 0 0
[image:5.595.57.545.551.725.2]presents an analysis of the efficiency of container termi-nals in Mexico, which has not been done in the way pre- sented in this work, one of the main differences is the study period (1982-2010) which includes both stage where it was managed entirely by the government as the stage where there was already interventionism on the part of private. On the other hand besides indicating the level of efficiency of ports showing pure, scale and global ef-ficiency, we present a benchmarking analysis in order to identify those ports that are inefficient and they were compared to other ports with similar characteristics and that are efficient and finally with slack analysis shows the number of inputs that must reduce to be more effi-cient.
5. Conclusions
We have introduced the measurement of global technical efficiency Mexican ports in the period 1982-2010, which in turn can be decomposed into pure technical efficiency (PTE) and scale efficiency (ES).
In this research, we work the CRS and VRS DEA model of output oriented. Input needs to consider quay length and the number of workers, while output needs to consider the number of containers handled annually. The hypothesis is true, since the results show that on average the ports have a global low technical efficiency because most ports show a reduced scale efficiency.
Tuxpan and Veracruz were ports that had a higher global technical efficiency in the year 1982. This was due to the fact that production scale remained at its maximum scale operating efficiently as shown in Table 2, as well as its resources properly optimized, thereby realizing pure technical efficiency. The port that is char-acterized by having the lowest efficiency in the period was Progreso, despite having a high level of pure techni-cal efficiency. In 2010, Manzanillo and Lazaro Cardenas were ports with the great global technical efficiency while Tuxpan was the one that obtained less efficiency, mainly because in that year they moved only 18 contain-ers.
With Benchmarking analysis, one is able to identify efficient ports that served as reference to the inefficient, with the ports of Manzanillo and Lazaro Cardenas refer-enced in the year 2010. In Slacks analysis, there must be 50% of the ports for this year that had a surplus of work-ers, making it necessary to rethink hiring, where profiles are evaluated as indicated for the management of these terminals, and also to have ongoing training in techno-logical areas as is true today the port of Manzanillo.
It is generally observed that the ports of Mexico are inefficient mainly due to the poor results on the effi-ciency of scale, which tells us that they are at the optimal scale of production. As a matter of public policy, it is necessary that they encourage that increased containers
are moved through investment policies for the procument of infrastructure and equipprocument that meet the re-quired demand for there to be a better scale of production and in turn to have a global efficiency technique.
REFERENCES
[1] J. Ojeda, “The Port Problem in Mexico in Perspective in 1982-2004, Towards New Paradigms,” Regulation of
Transport Infrastructure, 2011, pp. 121-170.
[2] I. Igae, “Goal Setting and Performance Measurement in the Public Domain,” Madrid, Spain, 1997.
[3] A. Aeca, “Performance Indicators for Public Entities,” Document no. 16, Series of Principles of Managerial Ac- counting, 2nd Edition, Madrid, 1997.
[4] A. Charnes, W. Cooper and E. Rhodes, “Measurement the Efficiency of Decision Making Units,” European Journal
of Operational Research, Vol. 2, No. 6, 1978, pp. 429-
444. http://dx.doi.org/10.1016/0377-2217(78)90138-8 [5] T. Koopmans, “Efficient Allocation of Resources,” Eco-
nometrica, Vol. 19, No. 4, 1951, pp. 455-465.
http://dx.doi.org/10.2307/1907467
[6] G. Debreu, “The Coefficient of Resource Utilization,”
Econometrica, Vol. 19, No. 3, 1951, pp. 273-292.
http://dx.doi.org/10.2307/1906814
[7] R. Shephard, “Cost and Production Functions,” Princeton University Press, Princeton, 1953.
[8] M. Farrell, “The Measurement of Productive Efficiency,”
Journal of the Royal Statistical Society: Serie A, Vol. 120,
No. 3, 1957, pp. 253-267. http://dx.doi.org/10.2307/2343100
[9] R. Banker, A. Charnes and W. Cooper, “Some Models for Estimating Technical and Scale Inefficiencies in Data Envelopment Analysis,” Management Science, Vol. 30, No. 9, 1984, pp. 1078-1092.
http://dx.doi.org/10.1287/mnsc.30.9.1078
[10] V. Coll and O. Blasco, “Evaluation of the Efficiency by Data Envelopment Analysis,” 2006.
http://www.eumed.net/libros-gratis/2006c/197/index.htm [11] T. Coelli, P. Rao, C. O’Donnell and G. Batesse, “An
In-troduction to Efficiency and Productivity Analysis,” 2nd Edition, Springer, 2005.
[12] E. Martínez-Budría, R. Diaz-Armas, M. Navarro-Ibanez and T. Ravelo-Mesa, “A Study of the Efficiency of Span- ish Port Authorities Using Data Envelopment Analysis,”
International Journal of Transport Economics, Vol. 26,
No. 2, 1999, pp. 237-253.
[13] R. Park and P. De, “An Alternative Approach to Effi- ciency Measurement of Seaports,” Maritime Economics
& Logistics, Vol. 6, 2004, pp. 53-69.
http://dx.doi.org/10.1057/palgrave.mel.9100094
[14] R., Sala and A. Meda, “Study of Technical and Eco- nomic Efficiency of Container Terminals,” Asepuma, 2004, pp. 1-11.
Bussiness, Vol. 57, No. 5, 2005, pp. 433-462. http://dx.doi.org/10.1016/j.jeconbus.2005.02.007
[16] J. Low, “Capacity Investment and Efficiency Cost Esti- mations in Major East Asian Ports,” Maritime Economics
& Logistics, Vol. 12, 2010, pp. 370-391.
http://dx.doi.org/10.1057/mel.2010.13
[17] F. Lo, C. Chien and J. Lin, “A DEA Study to Evaluate the Relative Efficiency and Investigate the District Reor-
ganization of the Taiwan Power Company,” IEEE Trans-
actions on Power Systems, Vol. 16, No. 1, 2001, pp. 170-
178.