Munich Personal RePEc Archive
Do south-south trade agreements
enhance member countries’ trade?
evaluating implications for development
potential in the context of SAARC
Das, Gouranga and Bhattacharya, Swapan K.
Hanyang University, Erica Campus, South Korea, Indian Institute of
Public Administration, New Delhi, India, Asian Development Bank
Institute, Tokyo, Japan
5 November 2009
Online at
https://mpra.ub.uni-muenchen.de/37255/
UNU-CRIS workshop 5-6 Nov 2009. Bhattacharya and Das Page 1
Do South-South Trade Agreements Enhance Member Countries’ Trade? Evaluating Implications for Development Potential in the Context of SAARC.
Swapan K. Bhattacharya* & Gouranga G. Das**
Paper prepared for the UNU-CRIS and UNU-WIDER International Workshop, 5-6 November, 2009
“South –South Cooperation holds key to building upon the best of what our region has to offer. Let us leverage our strengths to create a more integrated and inclusive Asia pacific region-free from poverty, free from hunger” Dr. Noeleen Heyzer, UN Under Secretary General and Executive Secretary of ESCAP. 1
I: Background
One of the most important developments in the post WTO scenario has been the
phenomenal growth of regional trading agreements among different countries’ blocs
across the globe as complement to the multilateral trading system. At the advent of “new regionalism”, different countries have formed the complex web of regional trading arrangements what Bhagwati and Panagariya (1999), Estevadeordal (2006) and others refer as the “Spaghetti Bowl” phenomenon of the international trading system. In Asian
region itself, there have been 49 such regional trading blocs (RTBs) operating like
“Spaghetti bowl”, where every country is member of such blocs simultaneously. Among several others, East Asian economies have been emerging as most successful RTBs in Asia region after achieving strong economic interdependence, particularly through external liberalization, domestic structural reforms and market-driven integration with the global and regional economies. Intraregional trade, FDI and financial flows among these
countries have created a “naturally” integrated economic zone (Kawai, 2005).
Association for South-East Asian Nations (ASEAN) has also been emerging as strong,
cohesive, and well-integrated regional trading bloc due to its proximity in demand and vertically-integrated production system across the members. In order to strengthen its regional economic cooperation, it has concluded many regional trading agreements among several countries of the region.
*
Visiting Researcher, Asian Development Bank Institute, Tokyo **
Professor, Hanyang University, ERICA Campus, Republic of Korea 1
UNU-CRIS workshop 5-6 Nov 2009. Bhattacharya and Das Page 2
Recently, Plummer (2007) has argued that regional and bilateral trade agreements in Asia with the exception of a few in South Asia appear to minimize the ‘spaghetti bowl effect’ such as, via overlapping accords and inconsistency compared to other trade agreements initiated in other parts of the world. His conclusions are based on examination of the actual contents and operations of those agreements. One of his conclusions is that there can still be ways to improve the performance of trade agreements in Asia. It is, in this context, an attempt has been made to identify ways to improve trade agreements in Asia, particularly involving majority of South Asian countries. Unlike EU and NAFTA, regional trading arrangements in Asia in general and South Asia are not cohesive due to asymmetry in economic development among the member countries, which is more prominent among the South Asian countries. Though it has been trying through several institutional reforms to liberalize its economies and to augment regional cooperation on win-win basis, perennial political mistrust among two major trading partners in this regional has crippled the prospect the successful economic cooperation in this region over the years.
UNU-CRIS workshop 5-6 Nov 2009. Bhattacharya and Das Page 3
influences (Gawande and Krishna, 2001) have been identified to constrain trade flows between countries. A good empirical example in the context of country-specific constraints impeding trade between countries is the case of South Asian Association for Regional Cooperation (SAARC). It could have emerged as the ‘engine of growth’ for South Asia, but could not do so with its full vigor because of political frictions between two largest trading partners viz. India and Pakistan. Other sporadic efforts to form regional trading arrangement in this region viz. Bhutan, Bangladesh, India and Nepal – Growth Quadrangle (BBIN-GQ) and Mekong – Ganga Cooperation (MGC), which includes 5 ASEAN countries viz. Cambodia, Lao PDR, Myanmar, Thailand and Vietnam, have not made any perceptible progress in this regards so far.
South Asia has been the late comer in the bandwagon of regional trading arrangements in the Asia-Pacific region due to firstly, inward-orientation of its economies relative to other nations of this region and second, political mistrust, which is the major stumbling block of economic integration. Though members of South Asia have traditionally been protectionist towards opening its economies to other countries, it has recently been engaged in regional cooperation through signing PTAs and FTA, first, bilaterally and then, among all of its members. South Asia Free Trade Area (SAFTA) was signed by seven members of SAARC during Twelfth SAARC Summit held in Islamabad on 4-6 January 2004, which came into force from 1 January 2006.
UNU-CRIS workshop 5-6 Nov 2009. Bhattacharya and Das Page 4
Pakistan has so far restricted SAFTA Tariff concessions for India to the items included in their List of Importable items from India called “positive list”.
In spite of triumphs and tribulations, trade among the SAARC countries has been on higher trajectory since 2000. Pakistan has increased the number of items to be imported from India from earlier 1075 items to 1936 items at present. Despite this fact, Pakistan’s exports to India have increased from 65 million dollars during 2000 to 291 million dollars during 2007 i.e. registering an average growth of 49.7 per cent. Whereas its imports from India has been growing much faster than its exports to the latter country. Pakistan’s imports from India were 183 million dollars during 2000, which increased to 1266 million dollars, thus registering an annual growth of 84.55 per cent.
UNU-CRIS workshop 5-6 Nov 2009. Bhattacharya and Das Page 5
II: Towards Regional Integration: SAARC Intraregional Trade
The basic reason of ‘regional integration; is the ‘economic integration’ of ‘natural’ and ‘unnatural’ countries. Economic integration is propelled by the competitive needs of different countries of the world to face the onslaught of globalization after the onset of WTO in 1 January 1995. In the new liberalized trade regime, it is pertinent for the countries to be more competitive by reducing costs through removal of trade barriers and restrictions on the movement of factors of production. As Richard Baldwin (1995) and C. Fred Bergsten (1996) have pointed out that there seems to be intense competitive pressures in the world economy today than what it was prior to WTO, which has induced governments to liberalized trade both bilaterally and regionally. Since new issues have been cropped up over the years in the trade arena, it becomes almost impossible task for WTO to take up any agenda with consensus from its 153 members, which is evident from increasing number of trade disputes at the WTO. This leads members to find out an alternative system to the multilateral system, where prompt decision can be taken and implemented. This gives rise to the proliferation of regional trading blocs since last one and a half decade. Nevertheless, there has been an intense pressure to the governments by the voters and firms’ lobbies to provide a framework of policies well suited to their interests of maximizing economic welfare and economic profits. In the face of such pressures and the stalemate of multilateral trading system under the auspices of WTO to promote trade and investment, governments have sought alternative policy changes to improve economic welfare and farms’ profits. This was the route cause of phenomenal growth of regionalism in recent years.
UNU-CRIS workshop 5-6 Nov 2009. Bhattacharya and Das Page 6
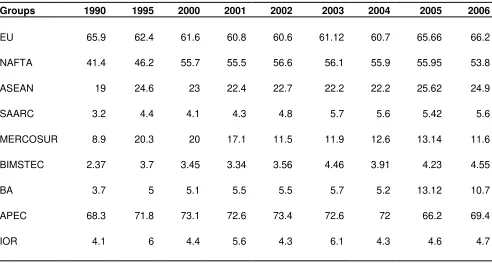
[image:7.612.95.587.355.618.2]region. Its intraregional trade was 3.2 per cent during 1990, which increased marginally to 5.6 per cent in 2006. MERCOSUR is one of the most vibrant and emerging trading blocs in the Latin America, whose intraregional trade was 11.6 per cent in 2006, up 8.9 per cent during 1990. Interregional trade among the countries of the Bangkok Agreement (BA) has also shown tremendous growth from 3.7 per cent in 1990 to 10.7 per cent during 2006. Trade among the APEC countries is highest among all trading blocs, which was 71.8 per cent during 1995, although reduced to 69.4 per cent during 2006. IOR has also made inroad as a vibrant regional trading bloc, not much significantly. Its intraregional trade has increased from 4.1 per cent (1990) to 4.7 per cent (2006). BIMSTEC is still crawling in regional economic cooperation with miniscule intraregional trade share—share increasing from 2.37 per cent in 1990 to 4.55 per cent during 2006.
Table 1 Intra-Regional Trade (Export) of Major Trading Blocs (%)
Groups 1990 1995 2000 2001 2002 2003 2004 2005 2006
EU 65.9 62.4 61.6 60.8 60.6 61.12 60.7 65.66 66.2
NAFTA 41.4 46.2 55.7 55.5 56.6 56.1 55.9 55.95 53.8
ASEAN 19 24.6 23 22.4 22.7 22.2 22.2 25.62 24.9
SAARC 3.2 4.4 4.1 4.3 4.8 5.7 5.6 5.42 5.6
MERCOSUR 8.9 20.3 20 17.1 11.5 11.9 12.6 13.14 11.6
BIMSTEC 2.37 3.7 3.45 3.34 3.56 4.46 3.91 4.23 4.55
BA 3.7 5 5.1 5.5 5.5 5.7 5.2 13.12 10.7
APEC 68.3 71.8 73.1 72.6 73.4 72.6 72 66.2 69.4
IOR 4.1 6 4.4 5.6 4.3 6.1 4.3 4.6 4.7
Source: COMTRADE Database
UNU-CRIS workshop 5-6 Nov 2009. Bhattacharya and Das Page 7
UNU-CRIS workshop 5-6 Nov 2009. Bhattacharya and Das Page 8
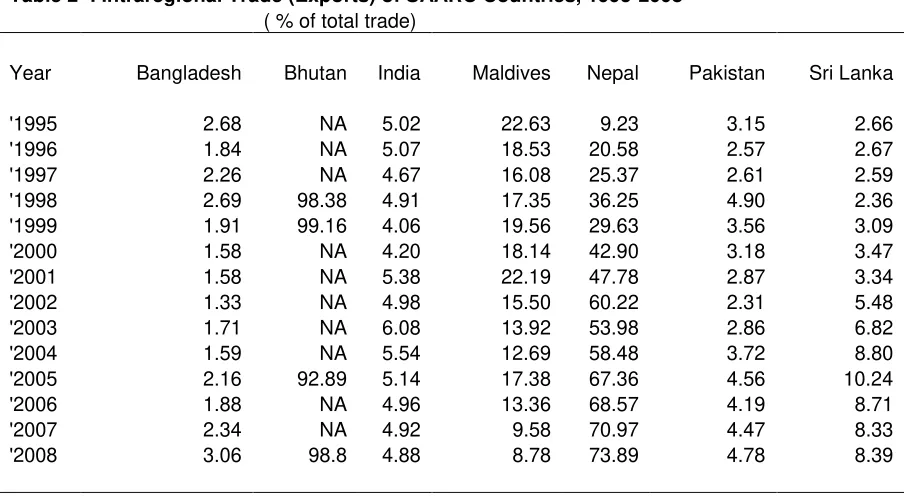
Table 2 : Intraregional Trade (Exports) of SAARC Countries, 1995-2008
( % of total trade)
Year Bangladesh Bhutan India Maldives Nepal Pakistan Sri Lanka
'1995 2.68 NA 5.02 22.63 9.23 3.15 2.66 '1996 1.84 NA 5.07 18.53 20.58 2.57 2.67 '1997 2.26 NA 4.67 16.08 25.37 2.61 2.59 '1998 2.69 98.38 4.91 17.35 36.25 4.90 2.36 '1999 1.91 99.16 4.06 19.56 29.63 3.56 3.09 '2000 1.58 NA 4.20 18.14 42.90 3.18 3.47 '2001 1.58 NA 5.38 22.19 47.78 2.87 3.34 '2002 1.33 NA 4.98 15.50 60.22 2.31 5.48 '2003 1.71 NA 6.08 13.92 53.98 2.86 6.82 '2004 1.59 NA 5.54 12.69 58.48 3.72 8.80 '2005 2.16 92.89 5.14 17.38 67.36 4.56 10.24 '2006 1.88 NA 4.96 13.36 68.57 4.19 8.71 '2007 2.34 NA 4.92 9.58 70.97 4.47 8.33 '2008 3.06 98.8 4.88 8.78 73.89 4.78 8.39
Source : DOTS, IMF
III: Trade Potential among SAARC Countries: Measuring Trade Intensities.
UNU-CRIS workshop 5-6 Nov 2009. Bhattacharya and Das Page 9
trade. The size adjusted regional export share is a variation of the TII. Its purpose is to normalize the intra-regional export share of a regional trading bloc for group size in the world trade. This measure is useful when comparing the intraregional trade of different trading blocs which vary significantly in terms of the number or level of development of the members. The rationale for the adjustment is that we expect larger groups to have a larger share of world and intraregional exports. Therefore, in a given block, the trade intensity index is defined as the ratio of the intra-regional export share for a given trade bloc, to the share of the trade bloc’s exports in the world trade. In the bilateral trade flow of the SAARC countries the trade intensity statistic is the ratio of two export shares. The numerator is the share of the destination of interest in the exports of the region under study. The denominator is the share of the destination of interest in the exports of the world as a whole. In other words, the numerator is the export share of the source region to the destination; the denominator is export share of the world to the destination. It has one limitation. As with the trade shares, high or low values and changes over time may reflect numerous factors other than trade policy. Trade Intensity Index (TII) can be measured as follows:
TII
ij= [ X
ij/ X
i] / [ X
j/ ( X
w) ]
Where:
TII
IJ = Trade intensity index of exporting country ‘i’ (source) to country ‘j’(destination).
X ij = Exports of source country ‘i’ to the destination ‘j’ X i = Total exports of ‘i’ i.e. source country
X j = Export to country ‘j’ (destination) X w = Total world exports
UNU-CRIS workshop 5-6 Nov 2009. Bhattacharya and Das Page 10
There may be several reasons why trade intensities among several countries diverge from the unity. The entire gamut of reasons can be categorized into two broad groups viz. objective resistance and subjective resistance (Garnaut, 1972). As regards objective resistance, intensity of trade is likely be high between a combination of industrial good exporter and exporter of primary products because of strong complementary in the structure of production of two countries, which is determined by comparative advantage of the two countries. Regarding factors determining subjective resistance, among others, discriminatory commercial policies, flow of capital and economic aid from the developed (relatively) to developing economies influence the trade intensity index of the two countries (Yamazawa, 1970). Apparently, in the short run, countries can not control the objective resistance due to its structural rigidities in the mode of production, but they can eliminate subjective resistance by cooperating with enhancing economic cooperation with each other either bilaterally or in a group or
multilaterally. The vision of SAFTA is to eliminate all subjective barriers among
member countries in a mutually exclusive way.
UNU-CRIS workshop 5-6 Nov 2009. Bhattacharya and Das Page 11
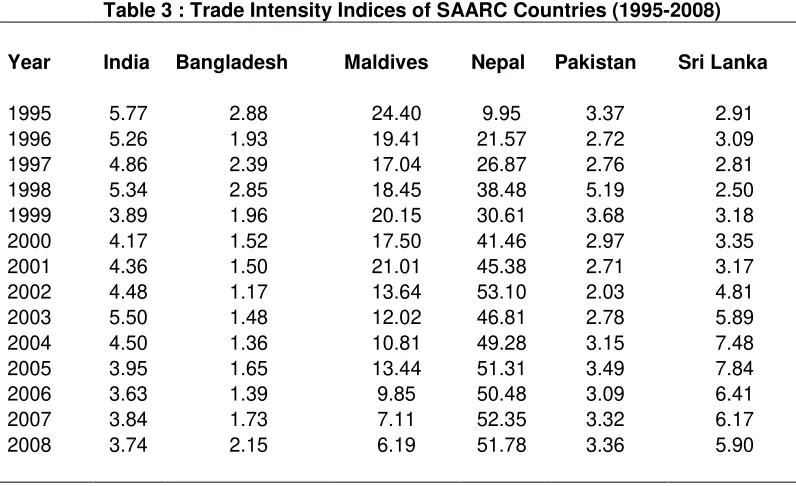
[image:12.612.91.489.447.690.2]Trade intensity of Nepal has increased quite significantly over the years due to its increasing trading relation with India due to bilateral agreements. Nepal’s trade intensity index with the SAARC countries has been increased from 9.95 in 1995 to 51.78 during 2008, the highest among all countries of this region. Pakistan is yet to take advantage of the liberal trading atmosphere of this year. The reason is that it has adverse political relationship with India, which is the largest trading partner of this region. But it is gradually coming out of the shadow it had in the last century and, notwithstanding its acrimonious political relation with India, its trading relations with the latter countries has been growing significantly over the years. Pakistan’s import from India is more than $ 2 billion whereas it exports not more than $ 200 million. Its trade intensity index with the SAARC countries remains the same over the years. Its TII was 3.37 in 1995, which marginally declined to 3.36 in 2008. Sri Lanka’s economic integration with the SAARC is much more pronounced than other countries of this region. It has concluded bilateral free trade agreement with India. As a result of which its exports to India has increased manifold, which is reflected through its TII values. Its TIIwas 2.91 in 1995 increased to 5.9 during 2008, which shows it has increasing its trade integration with the SAARC countries over the years. The trends of TII indices of SAARC countries during 1995— 2008 are shown in Table 3.
Table 3 : Trade Intensity Indices of SAARC Countries (1995-2008)
Year India Bangladesh Maldives Nepal Pakistan Sri Lanka
1995 5.77 2.88 24.40 9.95 3.37 2.91 1996 5.26 1.93 19.41 21.57 2.72 3.09 1997 4.86 2.39 17.04 26.87 2.76 2.81 1998 5.34 2.85 18.45 38.48 5.19 2.50 1999 3.89 1.96 20.15 30.61 3.68 3.18 2000 4.17 1.52 17.50 41.46 2.97 3.35 2001 4.36 1.50 21.01 45.38 2.71 3.17 2002 4.48 1.17 13.64 53.10 2.03 4.81 2003 5.50 1.48 12.02 46.81 2.78 5.89 2004 4.50 1.36 10.81 49.28 3.15 7.48 2005 3.95 1.65 13.44 51.31 3.49 7.84 2006 3.63 1.39 9.85 50.48 3.09 6.41 2007 3.84 1.73 7.11 52.35 3.32 6.17 2008 3.74 2.15 6.19 51.78 3.36 5.90
UNU-CRIS workshop 5-6 Nov 2009. Bhattacharya and Das Page 12
IV: Estimating Trade Potentials of SAARC Countries: Analytical Framework, Data and Methodology.
IVa : Analytical Framework
Analytical tool for measuring the impact of preferential trading arrangements (PTAs) and free trade arrangement (FTA) among SAARC countries is an extended version of the Gravity Model popularized by Anderson (1979), and Bergestrand (1985), among others. Most of the studies have been conducted in a static partial equilibrium analytical framework, where impacts of PTAs and FTA are directly measured via increase in trade of the exporting countries, without going into details of other macroeconomic impacts, such as increase in employment, income, output and welfare of the trade partners. However, trade can be constrained by “natural barriers” (e.g. distance
between economic regions) and (exogenous) policy-constrained “unnatural” or
“artificial” barriers in the form of high tariff and non-tariff barriers. Beyond the ‘natural’ geographical constraints, there are constraints due to unfavorable ‘policy’ environments
in home country, which may be named as ‘behind the border’ constraints, and also in
partner countries, which may be called ‘beyond the border’ constraints to trade (Gawande and Krishna, 2001; Wilson et al. 2004; and Newfarmer and Nowak, 2005). Of these constraints, ‘behind the border’ constraints can be reduced or eliminated through appropriate trade policy reforms of home country, and ‘beyond the border’ constraints can be reduced through policy co-ordination between home and partner countries through
trade agreements. In order to overcome these ‘behind the border’ and ‘beyond the
border’ constraints, all countries have been vying for regional and bilateral trading arrangements. It is, therefore, rational to define potential trade between home and a partner country as the maximum possible trade that can occur between them, given the ‘natural’ constraints, but without the influence of any ‘policy induced’ constraints to trade. Thus, potential trade here refers to the maximum level of trade with natural barriers that would have happened between home and partner countries had there not been any significant ‘behind the border’ and ‘beyond the border’ constraints between them (Kalirajan, 1999).
UNU-CRIS workshop 5-6 Nov 2009. Bhattacharya and Das Page 13
framework have been difficult. Unless the impacts of these constraints are not measured, the potential trade between countries can not be identified correctly. A number of different specifications of the gravity model have been suggested in the literature. Earlier studies have estimated the gravity equation involving countries of interest and worked out the difference between observed values and predicted values that are calculated from the OLS estimates as potential trade (Baldwin, 1994; and Nilsson, 2000). The OLS estimation procedure produces estimates that represent the centered values of the data set. However, potential trade refers to free trade with no trade restrictions. In other words, this means that the estimation of potential trade requires a procedure that represents the upper limits of the data and not the centered values of the data set. The upper limit of the data is influenced by observations from countries that have liberalized trade the most, among the countries included in the analysis. The procedure involves mainly two steps, namely, first to identify a method to include ‘policy induced’ constraints to trade in the gravity equation along with ‘natural’ constraints and stimulants, and secondly to select a procedure of estimation dealing with upper limits of the data indicating no influence of ‘policy induced’ constraints.
While conventional gravity model studies admit the importance of ‘policy induced’ constraints on home country’s exports, usually, these factors are merged with the ‘statistical random error term’ with ‘normal properties’ by implying that they are randomly distributed across observations. However, such a modeling in empirical work does lead to incorrect estimates of potential trade and does not also reflect the reality. Therefore, the lack of any appropriate measures to account for this problem in empirical studies of international trade could be insightful. Recently, Anderson and van Wincoop (2003), as a way of tackling this problem, suggested an approach to modify the conventional gravity model specification by including a multilateral resistance term to obtain more correct estimates. Drawing on the method suggested in Kalirajan (2007), which is an alternative to the method suggested by Anderson and van Wincoop, without imposing heavy data requirements on researchers, it is rational to argue that researchers do not have full information on all ‘policy induced’ constraints in home country and partner country on home country’s trade. Nevertheless, the combined effects of ‘behind
UNU-CRIS workshop 5-6 Nov 2009. Bhattacharya and Das Page 14
measured. Given the link between home country’s trade policy reform and export growth, the interest in this paper is to model the combined effects of the ‘behind the border’ constraints for the existing level of ‘beyond the border’ constraints.
In the generic gravity model, trade is proportional to the product of each country’s ‘economic mass’, which can be measured by gross domestic product (GDP) and population (POP), and inversely proportional to the distance between the countries.
Xij = C Yi β Y j γ P i φ Pjτ D ij –δ (1)
where Xij is exports of country i to country j. Yi and Yj are gross domestic products respectively of country i and j; Pi and Pj are population of country i and j respectively; and Dij is the distance between capital cities of home country and its partner country. Taking logarithms, the base line model (1) can be conveniently represented in the log-linear form as equation (2).
Ln Xij = α + β ln Yi + γ ln Yj + φ ln Pi + τ ln Pj - δ ln Dij (2)
The real world situation is too complex to be represented by a simple equation as (2). There are several other important factors such as trade policies of exporting countries and openness to trade of importing countries affecting trade. When sufficient information on these variables is available, the relevant variables are included in equation (2) as additional explanatory variables. In the absence of such information, generally, the impact of these variables is represented by a statistical error term, εij, which is assumed
to follow a normal distribution with mean 0 and variance σ2, in equation (2). For
simplicity of exposition, the time subscript is avoided.
ln Xij = α + β ln Yi + γ ln Yj + φ ln Pi + τ ln Pj - δ ln Dij + ε ij (3)
UNU-CRIS workshop 5-6 Nov 2009. Bhattacharya and Das Page 15
against openness not only in North American and European trade, but also in East Asian trade. In contrast to similar studies, Dhar and Panagarya (1996) estimated both country specific and pooled cross-country gravity equations to examine the question of openness in North America, Europe and East Asia. An important finding of their study is that a country-specific gravity equation can explain trade flows between countries better than a cross country gravity equation because the latter makes large difference across countries.
Following Dhar and Panagarya, equation (3) can be estimated in a slightly modified way
to measure trade potentialities of countries in SAARC using data from 1995 to 2008. The empirical model may be specified as follows1:
ln X ij = α0 + β1 ln (GDPj) + β2 ln (Popnj) + β3 ln (PCGDPi) + β4 ln (Distij) +ε ij ... (4)
Now, potential exports estimated using equation (4) would represent the centered values of data and any difference between the estimated and actually realized exports would be considered as random without bearing any policy implications. As discussed earlier, potential exports would be the maximum possible exports between home and partner countries, had there not been any significant ‘behind the border’ and ‘beyond the border’
constraints to home country’s exports. Drawing on the Stochastic Frontier Production
Function literature popularized by Aigner, Lovell and Schmidt (1977), and Meeusen and van den Broeck (1977) this characteristic of potential exports can be modeled by decomposing the statistical error term, ε ij into a single sided error term, u, which shows the combined effects of ‘behind the border’ constraints on exports with the assumption that data on details of factors contributing to ‘behind the border’ constraints within home country are not available, and a double sided error term vij, which indicates the effects of other left out variables such as ‘beyond the border’ constraints and ‘normal’ statistical errors.
ln X ij = α0 + β1 ln (GDPj) + β2 ln (Popnj) + β3 ln (PCGDPi) + β4 ln (Distij) - u i + vij .. ... (5)
1
UNU-CRIS workshop 5-6 Nov 2009. Bhattacharya and Das Page 16
The single sided error term, ui is the combined effects of the ‘behind the border’ constraints, which emanates due to the existing socio-political-institutional rigidities in
home country. This effect creates the difference between actual and potential exports
between the two countries concerned. u varies across observations and across time. The time varying characteristic of u is modeled as follows:
[
]
{
}
ii it
it u t T u
u =η = exp−η( − )
The above equation means that ‘behind the border constraints’ to export have been varying over time. This assumption implies that if the estimate of η is positive then the ‘behind the border constraints’ decline exponentially to its minimum value, ui, at the last
period, T of the panel. In this case, the gap between potential and actual exports has been declining. u takes values either 0 or greater than 0 and it is usually assumed to follow a truncated (at 0) normal distribution, N (µ, σ2u). When u takes the value 0, this means that the influence of ‘behind the border’ constraints is not important and the actual exports and potential exports are the same, assuming that the influence of ‘v’ is not significant on the exports. When u takes the value greater than 0, this means that the influence of ‘behind the border’ constraints is important and it creates a gap between actual exports and potential exports. Thus, the term ui, which is bilateral observation-specific, represents the influence of the ‘behind the border’ constraints, which is a function of the socio-political-institutional rigidities that are within the exporting country’s control. Thus, unlike the conventional approach, the suggested method of estimating the gravity model does include explicitly the influence of ‘behind the border’ constraints on trade flows
between two countries in the modeling of the gravity equation. The double-sided error
UNU-CRIS workshop 5-6 Nov 2009. Bhattacharya and Das Page 17
The advantages of the suggested methodology of modeling and estimation of the gravity model are as follows. Firstly, unlike the conventional OLS estimation, it does not suffer from a loss of estimation efficiency. Secondly, the suggested modeling estimates the influence of the ‘behind the border’ constraints, isolating it from ‘beyond the border’ constraints and the statistical error term. This isolating property will enable us to examine how effective has been the influence of ‘behind the border’ constraints on potential exports. Thirdly, the suggested approach provides potential trade estimates that are closer to frictionless trade estimates. Potential trade is not the level of trade without any restriction (free trade). As noted above, potential trade is determined by the upper limit of the data set. That is, by those economies who have liberalized trade restrictions (by reducing or eliminating behind the border unnatural barriers) to the most. Thus, potential trade for a given level of ‘beyond the border’ constraints can be defined as the maximum level of trade given the current level of the determinants of trade and (given) the least level of ‘behind the border’ constraints within the system. Finally, the suggested method bears strong theoretical and policy implications for finding ways of improving the socio-political-institutional factors in home country to achieve frictionless trade.
IVb : Comparative Static Scenario Analysis:
The Gravity Model has a number of advantages in analyzing the intraregional trade, particularly for the PTA of the 90’s, sometimes known as "new regionalism".2 We perform a comparative static analysis of tariff reductions under different scenarios and evaluate its effects on directionalities of exports for SAARC Member Countries (SMCs). The objective of this analysis is to see costs and benefits of different PTAs and FTA to member countries. As listed below, four hypothetical illustrative scenarios have been considered:
(i) 25% across the board tariff cuts by all countries;
(ii) 50% across the board tariff cuts by all countries;
(iii) 75% across the board tariff cuts by all countries; and
(iv) 100% tariff cuts i.e. free trade among all countries ( SMCs).
2
UNU-CRIS workshop 5-6 Nov 2009. Bhattacharya and Das Page 18
The results of the simulations obtained are indicative as these are estimated values based on hypothetical scenarios under the conditions that respective countries offer tariff cuts, as per the magnitudes mentioned above, from the existing tariff lines. The analysis would measure the impact of PTAs by the proportionate change in exports (expressed in US dollars) of respective countries due to reduction of tariffs of other SMCs. The higher the initial tariff level on trade between partners, the greater would be the final effect of reduction and elimination of tariffs with gradually higher doses of tariff-cuts. However, tariff is only one of many factors that determine the impact of PTAs and FTA on trade. In assessing the impact, the elasticities indicating the proportionate response of bilateral trade to changes in tariffs, the initial tariff levels as well as initial level of exports are relevant for determining absolute changes in exports of SMCs under tariff-cut scenarios.
IVc : Data Sources
Data on trade (exports) of SMCs(SAARC Member Countries) are taken from the UN COMTRADE database provided through the online WITS software developed by the World Bank and the UNCTAD. There are gaps in the COMTRADE database both for years and for countries. In such cases, export data were taken from IMF’s Direction of Trade Statistics. Both GDP and population data of the respective countries are taken from the online data provided by the UN Statistical Division, UN and the World Development Indicators 2006. World Bank Tariff data for the entire analysis are taken from TRAINS CD-ROM compiled by UNCTAD provided in the WITS software. The variable REXR aims to account for significant changes in real exchange rate in SMCs. REXR is an index with base 2005=100 for the real exchange rate of the domestic currencies of SMCs. REXR is calculated using the nominal exchange rate and GDP deflator from IMF’s International Financial Statistics (exchange rate is market value and average of the period).
UNU-CRIS workshop 5-6 Nov 2009. Bhattacharya and Das Page 19
DIB = r. ar cos [ sin ( φI ) . sin ( φ B ) + cos ( φ I ) .cos ( λ B – λ I )
Where DIB is the distance between the SAARC countries, say, ‘B’ and ‘I’ i.e. distance
between their capitals in miles/kms , r is the earth radius in miles, φI and φ B are radian measures of the parallel of latitude of the two countries’ capitals, and ( λ B – λ I) is the radian measure of the difference in meridians of the two countries’ capitals. Distance basically measures transport cost, which is, in other words, represents trade costs. The distance variable is computed in the following manner. Assuming that all countries are of a circular area, one can compute the radius (r) for all countries based on data provided in the world atlas. When production is concentrated in the centre of the circle (the country’s capital or economic area), the average distance (m) between the centre and other points on the circular area is derived from the following condition:
m2π = r2π - m2π
Thus, the circular area is splitted in an outer concentric circular area of the same size. Solving for m yields, m= √¯r2/2.
The periods of analysis are from 1999 to 2005. The computer software Frontier 4.1 is used to estimate stochastic frontier gravity model, which is explained in details in Coelli (1996).
IVd : Discussion of the Results of Estimations
Equation (5) was estimated for each SAARC country separately to find out how far were actual exports of SAARC countries different from their potential exports to each other on bilateral basis during 1995- 2008. This analysis will indicate the influence of ‘behind the border’ constraints in home country on their exports to the concerned
importing countries for the existing level of ‘beyond the border’ constraints. By
UNU-CRIS workshop 5-6 Nov 2009. Bhattacharya and Das Page 20
There are a few diagnostic statistics to confirm the validity of the modeling of equation (5) with the composed errors, u and v. The gamma coefficient presents a measure of the total variation in exports that is due to the influence of ‘behind the border’ constraints represented by the term ‘u’. The gamma coefficient is an average over the time period, which is measured as follows:
γ = [( Σt
σ
2ut
) /( Σt
σ
2ut+ σ
2vt) ] / T
Where σ 2
ut is the variance of the one-sided error term at period t, σ2vt is the variance of
the random error term at period t and T is the total number of time period i. e. 14 years in this paper (i.e. 1995 to 2008). The gamma coefficients are significant at the 1 percent level, which means that ‘behind the border’ constraints did contribute mainly to the gap
between potential and actual exports. The significance of the gamma coefficients also
implies that the specification of equation (5) including the definition of the composed errors, u and v is valid for the present data set. The large size of the gamma coefficients indicate that the influence of ‘behind the border’ constraints are responsible for a substantial proportion of the mean total variation in realized exports.
It may be interesting to see how do the gamma coefficients vary over time. This is equivalent to examine whether the influence of ‘behind the border’ constraints towards reducing actual exports from potential exports has been increasing from one period to
another or not. Information on the temporal behavior of gamma can be obtained by
examining the eta coefficient. If the eta coefficients were positive and significant, then the impact of ‘behind the border’ constraints on reducing actual exports from potential exports would be decreasing over time. However, if eta were zero or not significant, then
the impact would be constant or fixed over time. Results in Table 4 shows that eta
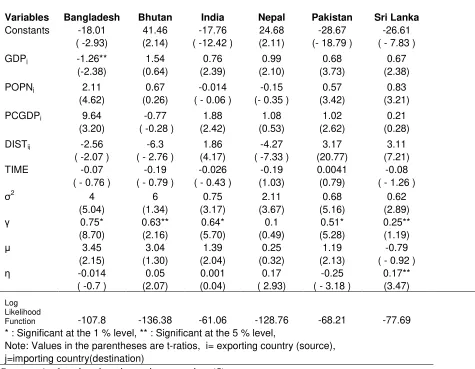
coefficients are positive and significant in the case of Sri Lanka, Bhutan and Nepal which means that trade policy reforms have been effective in reducing the impact of ‘behind the border’ constraints to export of these two countries. Though the coefficient is positive in the case of India and negative for Bangladesh, it is not significant, which means that the impact of ‘behind the border’ constraints remained constant without any
significant changes from 1995 to 2008. On the other hand, the eta coefficients are
UNU-CRIS workshop 5-6 Nov 2009. Bhattacharya and Das Page 21
important policy suggestion that India, Pakistan and Bangladesh within SAARC need to intensify their trade policy reforms to remove existing policy constraints hindering realization of export potentials with other members of the region.
UNU-CRIS workshop 5-6 Nov 2009. Bhattacharya and Das Page 22
Table 4 Maximum Likelihood Estimates of the Stochastic Frontier Gravity Equation for Trade among SAARC Countries, 1995-2008
Variables Bangladesh Bhutan India Nepal Pakistan Sri Lanka
Constants -18.01 41.46 -17.76 24.68 -28.67 -26.61 ( -2.93) (2.14) ( -12.42 ) (2.11) (- 18.79 ) ( - 7.83 ) GDPj -1.26** 1.54 0.76 0.99 0.68 0.67
(-2.38) (0.64) (2.39) (2.10) (3.73) (2.38) POPNj 2.11 0.67 -0.014 -0.15 0.57 0.83
(4.62) (0.26) ( - 0.06 ) (- 0.35 ) (3.42) (3.21) PCGDPi 9.64 -0.77 1.88 1.08 1.02 0.21
(3.20) ( -0.28 ) (2.42) (0.53) (2.62) (0.28) DISTij -2.56 -6.3 1.86 -4.27 3.17 3.11
( -2.07 ) ( - 2.76 ) (4.17) ( -7.33 ) (20.77) (7.21) TIME -0.07 -0.19 -0.026 -0.19 0.0041 -0.08 ( - 0.76 ) ( - 0.79 ) ( - 0.43 ) (1.03) (0.79) ( - 1.26 )
σ2
4 6 0.75 2.11 0.68 0.62
(5.04) (1.34) (3.17) (3.67) (5.16) (2.89)
γ 0.75* 0.63** 0.64* 0.1 0.51* 0.25** (8.70) (2.16) (5.70) (0.49) (5.28) (1.19)
μ 3.45 3.04 1.39 0.25 1.19 -0.79
(2.15) (1.30) (2.04) (0.32) (2.13) ( - 0.92 )
η -0.014 0.05 0.001 0.17 -0.25 0.17** ( -0.7 ) (2.07) (0.04) ( 2.93) ( - 3.18 ) (3.47)
Log Likelihood
Function -107.8 -136.38 -61.06 -128.76 -68.21 -77.69 * : Significant at the 1 % level, ** : Significant at the 5 % level,
Note: Values in the parentheses are t-ratios, i= exporting country (source), j=importing country(destination)
Source: Authors’ estimation using equation (5)
UNU-CRIS workshop 5-6 Nov 2009. Bhattacharya and Das Page 23
The advantage derived from this is reflected in the size of the distance variable. It may be noted that average distance among SAARC countries are more or less the same. Therefore, other SAARC countries need to be more efficient in cost management in order to be efficient like India in the same product group or else it has to design alternative strategies related to product and market.
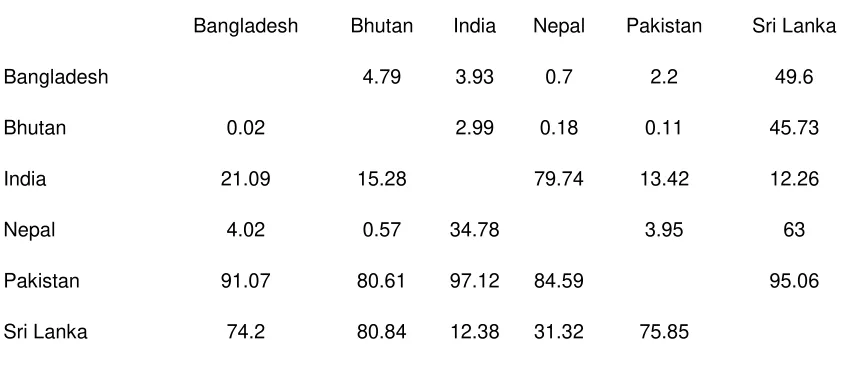
[image:24.612.93.526.424.608.2]The impact of policy induced ‘behind the border’ constraints on home country’s exports, which is estimated as the variable ‘u’, is presented in terms of realization of home country’s export potential in average percentage form in Table 5 for the periods 1995-2000 and in Table 6 for the periods 2001-2008. Percentage change in realization of export potentials of different SAARC countries during 1995-2008 is shown in Table 8. Increasing values over the periods indicate more exploitation of export potential of the exporting countries with rest of the group included in the study. The increasing values also mean that ‘behind the border’ constraints have been declining significantly in home country through its effective trade policy reforms for the existing levels of ‘beyond the border’ constraints.
Table 5 : Realization of Potential Exports (%) among the SAARC Countries, 1995-2000
Bangladesh Bhutan India Nepal Pakistan Sri Lanka
Bangladesh 4.79 3.93 0.7 2.2 49.6
Bhutan 0.02 2.99 0.18 0.11 45.73
India 21.09 15.28 79.74 13.42 12.26
Nepal 4.02 0.57 34.78 3.95 63
Pakistan 91.07 80.61 97.12 84.59 95.06
Sri Lanka 74.2 80.84 12.38 31.32 75.85
Source: Values are estimated by authors using equation (5).
Results in Table 5 show that Pakistan’s realization of exports to almost all SAARC
UNU-CRIS workshop 5-6 Nov 2009. Bhattacharya and Das Page 24
[image:25.612.92.522.362.546.2]best country is Sri Lanka, whose export realization with Bangladesh was 74.2 per cent, with Bhutan it was 80.84 per cent, with India it was 12.38 per cent and figures were 31.32 per cent and 75.85 per cent respectively with Nepal and Pakistan. Among all SAARC countries, Bhutan’s realization of export potential was lowest at least during 1995-2000. Except Sri Lanka with who its export realization was 45.73 per cent, with other SAARC members’ realization of potential exports was much below 5 per cent. Bangladesh follows the same trend. India is the largest economy of this region and it has been consistently opening up its economy since early nineties. Despite this its export orientation towards SAARC has been very insignificant during 1995-2000. India’s realization of potential exports was highest with Nepal among other SAARC countries, which was 79.74 per cent. With other countries of SAARC realization of its potential exports much less than 20 per cent.
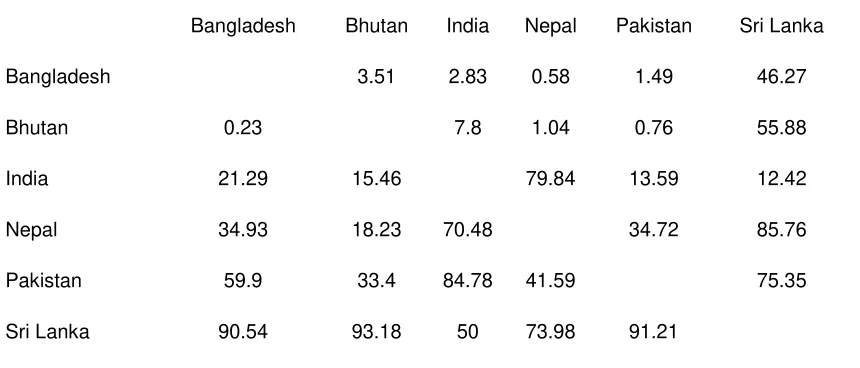
Table 6 : Realization of Potential Exports (%) among the SAARC Countries, 2001-2008
Bangladesh Bhutan India Nepal Pakistan Sri Lanka
Bangladesh 3.51 2.83 0.58 1.49 46.27
Bhutan 0.23 7.8 1.04 0.76 55.88
India 21.29 15.46 79.84 13.59 12.42
Nepal 34.93 18.23 70.48 34.72 85.76
Pakistan 59.9 33.4 84.78 41.59 75.35
Sri Lanka 90.54 93.18 50 73.98 91.21
Source: Values are estimated by authors using equation (5)
UNU-CRIS workshop 5-6 Nov 2009. Bhattacharya and Das Page 25
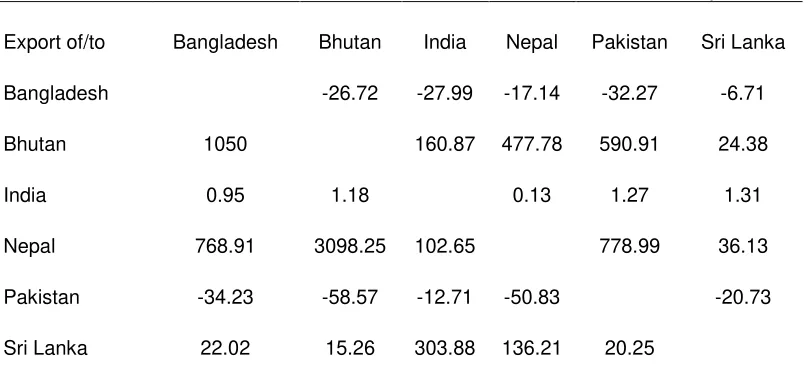
[image:26.612.93.497.157.348.2]7. It is pertinent to mention here that realization of export potential is the technical efficiency (TE) of equation (5) using stochastic frontier gravity model.
Table 7 : Change (%) in realization of export potentials of SAARC( 1995-2000 to 2001-2008)
Export of/to Bangladesh Bhutan India Nepal Pakistan Sri Lanka
Bangladesh -26.72 -27.99 -17.14 -32.27 -6.71
Bhutan 1050 160.87 477.78 590.91 24.38
India 0.95 1.18 0.13 1.27 1.31
Nepal 768.91 3098.25 102.65 778.99 36.13
Pakistan -34.23 -58.57 -12.71 -50.83 -20.73
Sri Lanka 22.02 15.26 303.88 136.21 20.25
Source: Valued are estimated by authors using equation (5)
UNU-CRIS workshop 5-6 Nov 2009. Bhattacharya and Das Page 26
India and Nepal. With India, it may due to successful implementation of Indo-Sri Lanka Bilateral Free Trade Agreement (ISLBFTA).
V: Modeling the impacts of PTAs and FTA among SAARC Countries.
The impact of the ‘beyond the border’ constraints can be divided into two groups, viz. ‘explicit beyond the border constraints’ and ‘implicit beyond the border constraints’.
Of these, the impact of ‘explicit beyond the border constraints’ on home country’s
exports may be measured from the coefficients of variables such as average tariffs (Tj)
and real exchange rate (REXRj ). These two variables are included in our gravity model
estimating the impact of PTAs and FTA on exports of all countries of SAARC. Including
these two variables and time as the control variables in equation (5), we may write equation (6) as:
ln X ij = α0 + β1 ln (GDPj ) + β2 ln (Popnj ) + β3 ln (PCGDPi ) +
β4 ln (Distij)+β5 ln (Tariffj) + β6 ln (REXRj ) +β7 ln (Time) - u i + vij
………..(6) where
Xij = Exports of country ‘i’ to country ’j’
GDPj = Gross Domestic Product of country j (i.e. importing country) Popj = Population of country ‘j’ (i.n. population of importing country) PCGDPi = Per capita GDP of exporting country ‘i’
Distij = Distance between country ‘i’ and ‘j’
Tariffj = Average weighted tariffs of the importing country
REXRj = Real exchange rate of the currencies of importing countries T = Time i.e. no of years viz. 1,2…….14 (for the years 1995….2008)
εij = exp (vi – ui ) [ as mentioned in equn. ( 4)
ui = Combined effects of “behind the border” constraints. This is the one sided disturbance term, which represents the combined effects of the country-specific
socio-political-institutional factors that prevents exports from reaching its potential. In other words, exp(u), which is the ratio of actual to potential exports, shows how much of county i’s potential exports to the jth country is achieved. vi =Combined effects of “beyond the border” constraints and other left out variables.
This is the random disturbance terms which truncated with a distribution N (0, σ2 v ) at period t.
UNU-CRIS workshop 5-6 Nov 2009. Bhattacharya and Das Page 27
Both the error terms are assumed to be independent of each other. In the above equation, period t= 1995….2008. Further, all the above data except the relative distance, vi and ui are in yearly aggregates. The estimation involves the use of panel data, which does not require the assumption that the one-sided error term ( ui ) and other independent variables in the above gravity equation are independent. The estimation of the u is carried out with the assumption that they are time-varying over a period of time and are
non-negative truncations of the N (μ, σ2
). The time varying characteristic of u is modeled as
u
i = η ( u i) = { exp [ -
η ( t
- T)] } u
iwhere η is the parameter to be estimated and T is the total number of time periods, which is 1995-2008 in our case. Maximum Likelihood Methods (MLE) can be used to estimate the above modified gravity model along with the magnitude of ‘u’ ( Coelli, 1996).
Entire exercise rests on the reductions in tariffs under different scenarios including free trade option. We have taken weighted average tariffs of total exports of five SAARC countries viz. Bangladesh, India, Nepal, Pakistan and Sri Lanka during 1995-2008. We have not taken Bhutan and Maldives since information on tariffs and real exchange rates are not available on a time series basis for the period we are studying. Tariffs are basically MFN tariffs rather than ad valorem duty. On the basis of tariff information provided by TRAINS, we have estimated tariff elasticities of 5 SAARC countries to their total exports from 1995 to 2008. In our model, we have estimated increase in exports of country ‘i’ to country ‘j’ and vice versa due to reductions of tariffs at different levels followed by complete elimination of tariffs. Given the estimated
parametric value of β5 from the fitted regression equation ( 6 ) for total exports and changes in tariff rates at different scenario as mentioned earlier in the methodology, the percentage increase in exports of country ‘i’ (source) to country ‘j’ (destination) and vice versa are worked out.
The methodology for calculation of increase in exports of one country due to
PTAs and FTA to the markets of other countries is as follows:
UNU-CRIS workshop 5-6 Nov 2009. Bhattacharya and Das Page 28
i.e., an increase in exports of country ‘i’ (source ) to country ‘j’ (destination) (1,2…6) due to change in tariffs of the latter country.
[exp { β^5 log (( TRJ, I )1/ (TRi, j ) 0 ) + ½ σ2 } -1 ] *100
That is, an increase in exports of ‘j’ (i.e. 1,2….6) to country ‘i’ due to change in tariffs of the latter country in the form of PTAs and FTA.
where σ2 = σ^2β5 log (TR I,J) + β5 log (TR J,I)
In our estimation, we have taken weighted average tariffs (TR) of total exports of SAARC instead of 1 plus tariff (1+TR).
Va : Empirical Results from the Model
Equation (6) has been estimated using MLE separately for Bangladesh, India, Nepal, Pakistan and Sri Lanka, the results of the stochastic frontier gravity model is shown in Table 8. All variables have significant signs barring a few at different levels. The bigger is the trading partners, the more significant is the bilateral trade due to high GDP and thus domestic demand of the importing country. The longer is the distance between two trading partners, higher is the transaction cost, therefore, less is traded. Higher the population of the importing country, higher is the trade between two countries. Higher are the tariffs in the importing country, less is the trade due to trade costs. Finally, higher is the real exchange rate means export earnings are more, therefore, more will be exported.
UNU-CRIS workshop 5-6 Nov 2009. Bhattacharya and Das Page 29
[image:30.612.95.521.163.585.2]demand for items exported by these two countries on the one hand or their export basket is limited to fulfill the demand of its neighboring countries on the other.
Table 8 : Maximum Likelihood Estimates (MLE) of the Stochastic Frontier Gravity for Trade among SAARC Countries, 1995-2008
Variables Bangladesh India Nepal Pakistan Sri Lanka
Constants -64.3 -3.74 17.29 -26.68 43.27
( -5.23 ) ( -0.84) (1.71) (-7.31) (4.50)
GDPj -0.52***' 0.72** 0.63*** 1.09* -0.93***'
( -1.45 ) (2.73) (1.55) (7.50) (-1.1)
POPNj 2.5* -0.062 0.23 0.3** 2.35***
(7.33) ( -0.31) (0.59) (2.10) (2.76)
PCGDPi 9.88* 1.65* 1.71*** 0.53 -0.77
(4.29) (2.53) (1.00) (0.90) (-1.0)
DISTij 3.41 -1.66 -3.2 3.32 -1.0***'
(3.68) ( - 0.44) (-5.75) (13.35) (-1.6)
TRj 0.16 -0.28**' 0.86** -0.36**' 0.55**
(0.90) ( -1.61) (2.18) (-2.28) (1.40)
REXRij -3.19**' 0.5*** -0.95***' -0.32***' -5.3*'
( - 3.51 ) (1.78) (1.70) (1.87) (-4.01)
TIME -0.31 -0.016 -0.16 -0.12 0.05
( - 5.04) (-0.32) (-0.9) (-3.21) (0.46)
σ2
36.07 2.67 1.66 0.55 2.52
(1.38) (1.64) (4.81) (6.78) (0.88)
γ 0.98 0.91 0.09 0.000037 0.8
(55.47) (16.29) (0.63) (0.01) (3.45)
μ -11.87 -3.12 0.23 0.0028 1.36
( - 2.34 ) (-1.05) (0.36) (0.01) (0.94)
η 0.017*** 0.02*** 0.18* -0.04 0.03***
(1.91) (1.09) (4.22) (-0.26) (1.11)
Log
likelihood -122.84 -66.13 -145.34 -94.52 -102.48
function
Source: Values are estimated by authors based on equation (6) * : Significant at 1 % level, ** : Significant at 5 % level and *** : Significant at 10 % level
UNU-CRIS workshop 5-6 Nov 2009. Bhattacharya and Das Page 30
countries at least in the case of total exports. This scenario may change if we disaggregate total exports in some major commodities at 2-digit HS categories and see their relationship with the population. Population growth of the neighboring countries does not play a dominant role in determining India’s exports at least for the period under study. Intuitively, export of any country is positively correlated with its per capita GDP. Several studies have shown such relationship. Our study shows that exports of SARRC countries are positively correlated with its per capita GDP except for Sri Lanka. Negative sign in per capita GDP implies that though per capita income of Sri Lanka increases, it does not reflect to its export pattern to neighboring countries. This may be due to the fact that weight of items it imports from SAARC countries and its balance of trade. If it imports more from the SAARC countries than exports and exports are limited to some items whose demands are inelastic. In that case, it is unlikely that export will growth with the
growth of per capita GDP. But picture will be clear if we do disaggregated analysis
rather than see totality of exports. Decomposition of Sri Lanka’s exports will give better picture about the reason of negative relationship between its per capita income and exports. Other signs are normal and as expected. As mentioned earlier that exports are negatively correlated with the distance because distance increases trade costs by increasing transaction cost. Therefore, except two countries viz. Pakistan and Bangladesh, which are adjacent to India and transport costs are not very significant to their total transaction costs to their exports into larger markets like India, export is negatively correlated with the distance, which is consistent with our analytical argument. Exports of these two countries do not have any relation with distances whatsoever. May be, natures of goods exported by these two countries are inelastic in demand and highly unrelated to price and distance. Moreover, as explained earlier, they have common border with India and have both rail and road connection. Therefore, costs factor does not play a very significant role in determining their exports to SAARC countries.
UNU-CRIS workshop 5-6 Nov 2009. Bhattacharya and Das Page 31
negligible and comprises low value added items. Therefore, these are not very sensitive to price. Picture is different in case of India and Pakistan, which basically export which are elastic and price sensitive. Therefore, any change is tariff has negative impact on its exports, which is also consistent with the theoretical underpinning.
UNU-CRIS workshop 5-6 Nov 2009. Bhattacharya and Das Page 32
Vb: Comparative Statics: Scenario Analysis of Impacts of PTAs and FTA for SMCs
Objective of this study is to evaluate the impact of PTAs and FTA among SAARC countries. In this exercise, we hypothetically measure the PTAs and FTA
between SAARC countries on a comparative static basis under ceteris paribus
assumption. The logical argument behind such phenomenon is that the more initial tariff level of any country compared to others, the greater the final effect of such arrangement because of elimination of tariffs and vice versa. This means if tariff level of any SAARC country is higher than its trading partner, any reduction in tariff of that country following a particular formula would result higher imports of that country from the partner country, whose tariff level is already low compared to the former country. Therefore, in the short run, imports of country having higher tariffs would increase much more than increase in imports of partner country (source) because of its lower base-level tariffs. However, tariff is only one among many factors that determine the impact of PTAs/FTA on trade. To calculate the increase in exports of any country, it requires base level exports of that country and elasticity of the importing country. The elasticities will determine the proportionate response to change in exports due to change in tariffs, given the initial tariff level as well as the initial value of exports. These factors determine the absolute change in exports due to change in tariffs.
UNU-CRIS workshop 5-6 Nov 2009. Bhattacharya and Das Page 33
due to few items available for exports, therefore, less benefit out of free/preferential trade, unless they broaden their export base.
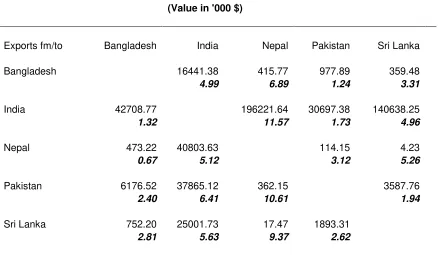
Simulated increase in exports of SAARC countries (except Bhutan and Maldives ) due to PTAs and FTA is shown in Table 9. In Table 9, we have shown likely increase in intraregional export of different SAARC countries due to PTAs and FTA. In a hypothetical scenario, if any country reduces its tariffs in a phased manner and then eliminates it completely, present exercise shows how much increase in exports of SMCs under different scenarios. In our analysis, we have simulated increase in exports under four hypothetical scenarios viz. 25 % , 50 %, 75% and 100 % reduction in tariffs. Consolidated figures of likely increase in intraregional exports of all SMCs after 100 per cent per cent reduction in tariffs i.e. under free trade, are shown in Table 10. In this exercise, we have simulated increase in intraregional trade of SAARC countries based on tariff level of 2008 and export value of the same year. Under FTA (with all SAARC countries), Bangladesh’ export growth will be highest with Nepal i.e. 6.89 per cent followed by India i.e. 4.99 per cent. Its export growth to Sri Lanka will be 3.31 per cent followed by Pakistan (1.24 per cent). This indicates that Bangladesh has much export potential with Nepal and India if it completely eliminates its tariffs with SMCs. Due to FTA, India’s export to Nepal market will grow by 11.57 per cent i.e. highest of all countries, followed by Sri Lanka i.e. 4.96 per cent Its export growth to Pakistan and Bangladesh is marginal due to FTA.
UNU-CRIS workshop 5-6 Nov 2009. Bhattacharya and Das Page 34
[image:35.612.91.529.405.660.2]Sri Lanka’s export to Nepal will increase by 9.37 per cent, whereas with India likely increase in export is 5.63 per cent followed by Bangladesh and Pakistan, where increase in intraregional trade will be 2.81 per cent and 2.62 per cent respectively. One thing is evident from Table 10, increase in intraregional trade due to SAFTA will be highest with Nepal and India. This may be due to the fact that tariff levels of these two countries are among the highest in the region. Obviously tariff levels of both India and Nepal are very high despite the fact that India has been consistently reducing tariffs over the years since 1991 and presently its peak tariff is at ASEAN level, but its collection rate is highest in this region. Therefore, all SMCs will get better market access if India eliminates its high tariff wall at the earliest. Though MFN tariff in India is very low at this moment, its bound tariff is 100 per cent to primary goods, 150 per cent with process goods and 300 per cent to edible oils, which gives much leeway to increase protectionist barriers if the situation is warranted so. Simultaneously, Nepal should also be insisted on reducing and then eliminating tariffs under SAFTA at the earliest.
Table 10 : Likely Increase in Intraregional Trade among SAARC Countries due to FTA, 2008
(Value in '000 $)
Exports fm/to Bangladesh India Nepal Pakistan Sri Lanka
Bangladesh 16441.38 415.77 977.89 359.48
4.99 6.89 1.24 3.31
India 42708.77 196221.64 30697.38 140638.25
1.32 11.57 1.73 4.96
Nepal 473.22 40803.63 114.15 4.23
0.67 5.12 3.12 5.26
Pakistan 6176.52 37865.12 362.15 3587.76
2.40 6.41 10.61 1.94
Sri Lanka 752.20 25001.73 17.47 1893.31
2.81 5.63 9.37 2.62
UN U -C R IS w o rk sh o p 5 -6 N o v 2 0 0 9 . B h at tac h ar y a an d D a s P a g e 3 5
Table : 9 Likely increase intraregional exports among SAARC countries due to PTAs & FTA (Value in '000 $)
Exports fm/to Bangladesh India Nepal Pakistan Sri Lanka
Scen.I Scen.II Scen.III Scen.IV Scen.I Scen.II Scen.III Scen.IV Scen.I Scen.II Scen.III Scen.IV Scen.I Scen.II Scen.III Scen.IV Scen.I Scen.II Scen.III Scen.IV
Bangladesh 4110.3 8220.7 12331.0 16441.4 103.9 207.9 311.8 415.8 244.5 488.9 733.4 977.9 89.9 179.7 269.6 359.5
1.25 2.49 3.74 4.99 1.72 3.44 5.17 6.89 0.31 0.62 0.93 1.24 0.83 1.65 2.48 3.31 60.00
India 10677.2 21354.4 32031.6 42708.8 49055.4 98110.8 147166.2 196221.6 7674.3 15348.7 23023.0 30697.4 35159.6 70319.1 105478.7 140638.3
0.33 0.66 0.99 1.32 2.89 5.78 8.68 11.57 0.43 0.87 1.30 1.73 1.24 2.48 3.72 4.96
Nepal 118.3 236.6 354.9 473.2 10200.9 20401.8 30602.7 40803.6 28.5 57.1 85.6 114.2 1.1 2.1 3.2 4.2
0.17 0.34 0.51 0.67 1.28 2.56 3.84 5.12 0.78 1.56 2.34 3.12 1.31 2.63 3.94 5.26
Pakistan 1544.1 3088.3 4632.4 6176.5 9466.3 18932.6 28398.8 37865.1 90.5 181.1 271.6 362.1 896.9 1793.9 2690.8 3587.8
0.60 1.20 1.80 2.40 1.60 3.20 4.81 6.41 2.65 5.31 7.96 10.61 0.49 0.97 1.46 1.94
Sri Lanka 188.1 376.1 564.2 752.2 6250.4 12500.9 18751.3 25001.7 4.4 8.7 13.1 17.5 473.3 946.7 1420.0 1893.3
0.70 1.41 2.11 2.81 1.41 2.82 4.22 5.63 2.34 4.68 7.02 9.37 0.66 1.31 1.97 2.62
Figures in bold and italics are percentage increase in exports.
UNU-CRIS workshop 5-6 Nov 2009. Bhattacharya and Das Page 36
VI: Synergy between Trade & Development Goals of SAARC
In general, surge in South-South economic, social and political interrelations has reshaped international development policy. It is imperative to see the relative
effectiveness of trade promotion versus trade diversion from a growth-development
perspective. Given the preceding picture of potential trade expansion between SAARC nations, it is pertinent to investigate the prospects for development behind these trade agreements. According to Singh and Singh (2009), some of the regions experience development gaps or development deficits, which needs urgent attention. The priority areas identified are: education and literacy, basic health care, gender bias, favorable institutions ensuring good governance and social capital, and transparencies, transport costs, infrastructure, among others. Thus, the factors inhibiting SAARC development goals (SDGs) are the domestic (i.e., behind the border) impediments as well as some external stimuli via less-than-potential trade constraining movement towards the potential frontier and achievement of desired targets. Promoting regional trade integration and cooperation on a sustained basis and achieving growth and development dividends needs removal of these constraints. However, intraregional trade among the SAARC member countries (SMCs) can induce establishment of such enabling factors on a mutually compatible basis. As all these constituent regions are not at same status in economic ladder, trading with relatively advanced country in the group would enable the relatively laggard to reach their potential frontiers and narrow the intra-group development deficits. For example, trading with relatively innovative ‘India’ could unleash the scope of trade and investment-led diffusion of technological know-how to follower countries like Bhutan, Maldives or Nepal and simultaneously, the removal of unnatural barriers (policy induced or structural) constraining its successful implementation and assimilation would help reaching these backward countries to reach the potentials. Given the fact that the share of manufactured exports in total intra-regional exports of SAARC is about 70%, these types of high technology manufactured exports have tremendous potentials for closing the growth deficits.3
3
UNU-CRIS workshop 5-6 Nov 2009. Bhattacharya and Das Page 37
In other words, the results are indicative for exploring the implications of such trade arrangements for meeting the SAARC development goals (SDGs), namely, poverty alleviation, economic growth, catch-up of the laggards with the forerunners, and removal of institutional-infrastructural bottlenecks impeding regional growth and convergence
(ISACAPA 2004).4 Quite appropriately, ‘SAARC Leaders at the Thirteenth Summit
(Dhaka, 13 November 2005), agreed to make important strides in the areas of science, technology and higher education, to meet the challenges of the twenty-first century and decided to give priority attention to encourage regional cooperation in these areas to derive benefits from the synergy of collective, well-planned and focused initiatives
undertaken by Member States.’5 The Leaders had directed that a SAARC Plan of Action
for Science, ICT and Technology be elaborated for consideration during a Meeting of Science, ICT and Technology Ministers. Not only these, considering UN’s Millennium development goals and targets, ‘developing a global partnership for development’ is necessary for eradicating poverty, hunger and income inequality afflicting the subsets of
countries in SAARC. 6 By regional cooperation and integration via SAPTA, access to
recent technologies via trade and investment from other markets like India (major source) and, relatively less advanced Bangladesh and Sri Lanka, will reduce the lag in the technology flows and also promote exchange of skills and resources. Quite pertinently, as has been mentioned in Section IV above, in the estimated stochastic frontier gravity model the realization of export potential is the technical efficiency (TE) in Equation (5).
Although East Asian FTAs and ASEAN have a juggernaut effect in terms of trade expansion and open regionalism, as has been discussed elsewhere in this paper, SAFTA’s experience is much different due to inward-orientation and socio-political institutional constraints reinforcing the ‘behind the border’ policy impediments. As the mandate and challenges for SAARC development goals go, there is a clear objective ‘for a comprehensive and strategic response to the problem of poverty and social development’
article, in future, a separate study is in our research agenda. Current paper offers qualitative argument in this line.
4
SAARC development goals for 2005-2010 are alike Millennium Development Goals of the United Nations. See ‘An Engagement with Hope’ by ISACAPA (2004).
5
See http://www.saarc-sec.org/main.php?t=2.6 6
Target 12 aims at non-discriminatory trading and financial system, good governance, development while Target 13 and 18 emphasize the needs for access to exports via dismantling of barriers and most
UNU-CRIS workshop 5-6 Nov 2009. Bhattacharya and Das Page 38
by regional cooperation in priority areas such as: health, education, environment, and environment. However, although the countries in this group differ in terms of growth and development experiences and impediments, it is important to consider the development potentials of regional cooperation in narrowing the existing gap. In the context of SAARC and BIMSTEC, apart from resource mobilization via capital flows, skill and knowledge exchange, the provision of development and technical assistance is one of the priorities. Thus, regional integration under SAFTA needs to be viewed from an angle of growth and development.
As has been emphasized by Arora and Vamvakidis (2004), Fugazza and Robert-Nicoud (2006), World Bank (2008), a country’s development and growth experience depend on it trading partners’ economic performance and often, leads to conditional convergence. Thus, there is both North-south and South-South spillover of benefits under increased trade potentials. In fact, South-South cooperation via increased trade can promote North-South trade via, for example, low-cost inputs and manufactures. Under cooperation-based integration (like the case of SAFTA for SMCs or BIMSTEC), several channels work for stimulating partners’ economic growth, viz., knowledge production, knowledge sharing, human capital, institutional development, social capital, political stability, and a network based on trust (Greenwald and Stiglitz 2006, Liu and San 2007). These help infant economies in the regions to grow based on the leaders. Industrialization is major engine of growth in countries like India, China, Russia and other emerging economies with backward and forward linkages. According to World Bank (2007), ‘India is increasingly becoming a top global innovator for high-tech products and services’ (p. xv). By improving the business investment climate, stronger skills, better information infrastructure, R&D, India has promising invention potential and scope of intersectoral spillover across sectors—formal and informal—to pave the way for inclusive innovation.
For example, ‘New Millennium Indian Technology Leadership Initiative’ program and