393
AUTOMATIC LIP READING FOR DAILY INDONESIAN
WORDS BASED ON FRAME DIFFERENCE AND
HORIZONTAL-VERTICAL IMAGE PROJECTION
1,2ARIS NASUHA, 2FATCHUL ARIFIN
1TRI ARIEF SARDJONO, 3HIDEYA TAKAHASHI, 1MAURIDHI HERY PURNOMO 1
Department of Electrical Engineering, Institut Teknologi Sepuluh Nopember, Surabaya, Indonesia
2
Department of Electronics Engineering Education, Universitas Negeri Yogyakarta, Yogyakarta, Indonesia
3
Department of Electric and Information Engineering, Osaka City University, Osaka, Japan E-mail: 1,[email protected], [email protected], [email protected],
3
[email protected], [email protected]
ABSTRACT
Automatic lip reading is one of research being developed lately. Automatic lip reading has been used for various purposes, such as enhancing speech recognition and aid to speech training for the deaf. There are two approaches in lip feature extraction, namely appearance based and shape based. Appearance based approach is usually better, because it provides visual features that cover not only lips structure but also teeth and tongue visibility. However, the drawback of this approach is producing too many features. This paper presents the new method, integration of frame difference and horizontal-vertical image projection. This proposed method is part of appearance approach, apart from using image projection as dimensionality reduction. We implement the proposed method in automatic lip reading to classify five daily words in Indonesian language. We use 200 data which are recorded in frontal face and focused around the lip. MLP (Multi Layer Perceptron) and SVM (Support Vector Machine) are used as classifiers. Model of the proposed method are evaluated using 4-fold cross-validation. Of four algorithms on the proposed method, the best result is achieved by the combination of folded lip image and double difference. The comparison of the proposed method and 2D-DCT (2 Dimension–Discrete Cosine Transform) shows that the proposed method exceeds 2D-DCT in CA (Classification Accuracy) and AUC (Area Under ROC Curve), specifically when using MLP as classifier. The proposed method achieves 96.5% in CA and 0.9993 in AUC, whereas 2D-DCT achieves 94% in CA and 0.9978 in AUC.
Keywords: Lip Reading, Neural Network, Visual Speech Recognition, Appearance Based Approach, Indonesian Language
1. INTRODUCTION
Automatic lip reading is one of research being developed lately. Automatic lip reading has been used for various purposes, such as enhancing speech recognition [1], security systems [2], silent speech interface [3], and aid to speech training for the deaf [4]. Automatic lip reading has been studied in various languages, such as English [5], Korean [6], Persian [7], Dutch [8], Arabic [9], however it has not been widely studied in Indonesian
language.
ISSN: 1992-8645 www.jatit.org E-ISSN: 1817-3195
394 There are 26 alphabets in Indonesian alphabet system which is similar to Latin alphabet system. Meanwhile, the previous research found that there are 33 phonemes in Indonesian language including allophones, and 13 visemes (visual phonemes) [11]. Other researcher found that there are 49 phonemes and 12 visemes [10]. Differences in the number of phonemes occurs partly because their loan words from other languages, such as Arabic, English, or from the local dialect such as Javanese. Differences in the number of visemes partly because of differences in the definition of viseme in some literatures.
Automatic lip reading consists of 3 principle stages, namely data acquisition, feature extraction and recognition. Because the characteristics of the lip color and movement, i.e. lip color is not always enough contrast with the surroundings, and the shape of the lips constantly changing during the process of reading lips [12], it requires the use of extraction methods suitable for both characteristics.
Methods to represent visual features of lips on a video, based on space and time, can be classified into two categories [13], namely stationary based method and motion-based method. The first method will show a video which is divided into a series of image frames, technically feature extraction is operated on each frame. This method is called the method of static features. The second method’s features will be taken from the relative motion between the object and the observer, namely the distribution of speed which appears on the brightness patterns that exist in a series of images. In other words, information related to the composition of the observed object and the speed of change in the composition.
The method of lip feature extraction can also be divided into two categories [14], namely the edge-based approach and model-based approach. Edge-based approach usually works at low level, using colors and edges to extract features of lip. The extraction will deteriorate when the lips and the surrounding lack of contrast. On the other hand, the model-based method, which was built with a set of parameters, usually produces better feature extraction. However, this method also has drawback, namely sensitive in initialization of
parameters. This method includes Deformable Template, ASM (Active Shape Model) and ACM (Active Contour Model).
Other perspective of feature extractions approaches that can be found in the literature have been classified according to the type of information source they process [15], namely shape based and appearance based. ASM and ACM are examples of shape based approach, whereas DFT (Discrete Fourier Transform) and DCT (Discrete Cosine Transform) are examples of appearance based one. Appearance based approach provides visual features that contain not only lip structure, but also about tongue and teeth visibility. The downside of this approach is producing a very large number of features.
There is a simple method for lip segmentation and tracking effectively, namely frame difference, which is one of the techniques in the background subtraction method. This method is widely used in surveillance video and motion detection. The advantage of this methods is low in computation.
Application of frame difference algorithm for automatic lip reading has studied by Lee et. al. [16]. In their research, frame difference is combined with PCA (Principal Component Analysis) and ICA (Independent Component Analysis) for lip feature extraction only, not word recognition. Moreover, important issue of the frame difference, namely selection of the threshold value, had not been widely discussed.
This paper will discuss the use of the proposed method, combination of frame difference and horizontal-vertical image projection method for automatic lip reading, especially on people who speak Indonesian language. This method is part of appearance based approach, with image projection as dimensionality reduction.
395
2. MATERIALS AND METHODS
2.1. Materials
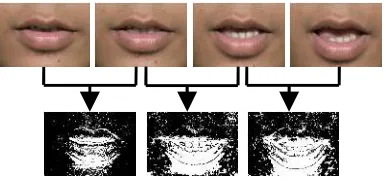
[image:3.612.317.510.193.284.2]In order to test our proposed method, we use video recorded from 10 volunteers, 5 men and 5 women, with age distribution from 19 to 22 years. All video are in color and focused around subject’s mouth. In these video, all volunteers are recorded in frontal face. Each of volunteers says five simple words in Indonesian, which is widely used in daily life, i.e. “saya” (I), “mau” (want), “makan” (eat), “minum” (drink) and “mandi” (take a bath). Each word is repeated four times, therefore there are 200 video data. The original frame size is 640x480 pixels. Each volunteer is recorded in 0.75 seconds for each word, in 25 frames per second. Example of frame from each subject can be seen in Fig. 1. Figure 2 is example of sequence of lip images pronouncing “saya”.
Figure 1. Examples Of Video Frames Of Each
Subject
Figure 2. Sequence Of Lip Images Pronouncing “Saya”
2.2. Methods
2.2.1. Frame Difference
There are many methods in motion detection, namely background subtraction, frame difference and optical flow. However, optical flow is computationally expensive, therefore it is difficult to use in real time application. Background subtraction also has drawback, i.e. highly sensitive to changes in lighting.
The basic principle of frame difference method is calculating the difference value of the pixel’s intensity in the current frame and previous frame, which can be expressed by Eq. (1).
, , 1, | , ,0, | , , , ,, , 1 |1 | (1)
Wherein dI(x,y,k) is a difference intensity value in pixel (x,y) at time k, I(x,y,k) and I(x,y,k-1) are intensity value in same pixel (x,y) at the current and previous time, T is the threshold value. Illustration of frame difference method can be seen in Fig. 3.
Figure 3. Illustration of Frame Difference Method The determination of the proper threshold value is very important. If it is too low, it will cause too much noise. On the other hand, if it is too high, it will cause too few informational parts. It is to be noted that the determination of the threshold is not only for the results in the form of segmentation of moving object. The expected outcome is the recognition accuracy. Therefore, in this study the initial determination of the threshold value is based on the image of one frame, which then adjusted based on experiments with consideration on the results of recognition, not on the accuracy of segmentation for one frame only.
Additionally, double difference [17] is an improved algorithm based on frame difference. It puts three consecutive frames as a group, subtracts both two consecutive frames (see Eq.(2) and Eq.(3)) and lets two differential results do the logical AND operation (see Eq.(4)). The algorithm can better obtain the moving objects’ region if the moving objects’ and frame rate are suitable.
, , 1, | , ,0, | , , , ,, , 1 |1 | (2)
, , 1 1, | , ,0, | , , 11 , ,, , 2 |2 | (3)
, , 1,0, , , ∩, , ∩ , ,, , 11 10 (4)
Double difference has been applied successfully in removing the well-known drawback of frame difference, that is foreground aperture and ghosting.
[image:3.612.93.289.347.525.2]ISSN: 1992-8645 www.jatit.org E-ISSN: 1817-3195
396 Image projections are one-dimensional representations of image contents. Horizontal -vertical image projection is histogram over horizontal and vertical way of grayscale level. Horizontal-vertical image projection is defined in Eq. (5) and Eq. (6).
∑ , for 0 $ 1 (5)
%& ∑' , for 0 ( 1 (6)
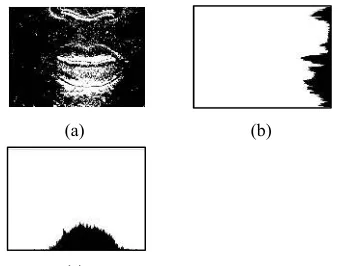
[image:4.612.104.274.382.515.2]The Phor and Pver are image projection in horizontal and vertical way respectively, I(x,y) is intensity value in pixel (x,y), M and N are width and height of image in pixel respectively. Each row and each column of image becomes a bin in the histogram. The stored count in a bin is the number of 1-pixels that appear in that row or column. This method can extract image features quickly and easily. This method has proven successful for Amazigh handwritten character recognition [18]. Illustration of this method can be seen in Fig. 4.
Figure 4. Illustration Of Horizontal-Vertical Image Pro- Jection, (A) Result Of Frame Difference, (B) Horizontal
Image Projection, (C) Vertical Image Projection 2.2.4. Proposed Method
The basic steps for the proposed method are as follow :
1) Convert video from RGB color space to grayscale
2) Manually down sampling and cropping the image in each frame to get area around the lip, from 640x480 pixels into 27x18 pixels 3) Apply frame difference, using specific
threshold value. Initial experiment is done to get the best threshold value.
4) Apply vertical and horizontal image projection,
to extract the features of the lip image, which will be used as input of classifier. The results of feature extraction for each frame is (27+18) features, or (27+18)x19 features for each video.
5) Apply word recognition using MLP (Multi Layer Perceptron) and SVM (Support Vector Machine) as classifiers.
For MLP classifier, we use three layers, and the number of hidden units is varied to get the best result. We use sigmoid for activation function, and also regularization to prevent overfitting. For SVM classifier, the kernel is varied, namely linear, polynomial, RBF (Radial Basis Function) and sigmoid. We use automatic parameter search [19] to get optimum parameter for learning for each kernel
To evaluate the model of the proposed method, we need a way to estimate the test risk. Because of limitation of the data, we use cross-validation [20] instead of classical approach, separate the data into training and testing part. In this research we use 4-fold cross-validation.
There are many ways to measure the performance of the classifier, such as accuracy and AUC. Some researchers prefer to use the AUC [21], because AUC is a better measure of accuracy based on formal definitions of discriminancy and consistency. On the other hand, some others choose accuracy, because it is more intuitive and easy to understand, especially when the number of data for each class of the same amount. For this study, we used the accuracy and AUC to get the benefits of both.
First experiment for this proposed method is choosing the threshold value. We try several threshold value and evaluate the recognition result to find the best threshold value. Basic steps to find the best threshold value can be seen in Fig. 5. Based on the best threshold value, we conducted experiments using the proposed method. In comparison, we used double difference instead of frame difference.
We also compare two kinds of lip images, namely full lip and folded lip images. Lip folding is based on the symmetry between left and right halves of the lips. Because of the characteristic, (a)
(c)
397 folded lip image should cover the major information, and there should be no distortion of information. Therefore, the data to be processed are reduced in half. Moreover, lip folding can reduce the impact of the illumination mismatch of the left and right lip region. Folded lip image had been studied for automatic lip reading on smartphone environment [22],[23]. Overall experiments for the proposed method can be summarized as in Fig. 6.
We compare the proposed method to 2D-DCT, the method of feature extraction often used for lip reading [24],[25], to measure the performance of the proposed method. For our experiment, we took only the low frequency components of the first 16, 25, and 36 coefficients in zigzag scanning from the left top corner. Thelast method is applied only on folded lip images, because this kind of image results better classification than full lip image. Experiment stages for feature extraction using 2D-DCT can be seen in Fig. 7.
3. RESULTS
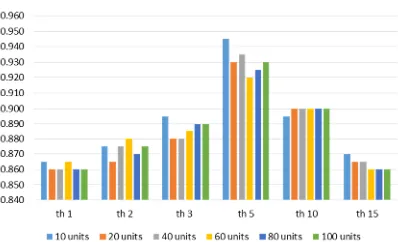
[image:5.612.316.523.69.251.2]The initial threshold values are chosen manually, and then the classification accuracy are evaluated. The chosen values are: 1, 2, 3, 5, 10 and 15. The result of this step is shown in Fig 8. The x axis indicates the threshold values, the y axis indicates the classification accuracy, and bars in several colors indicate the number of hidden unit in MLP. The best accuracy is achieved on threshold value 5, therefore the best threshold value is 5.
[image:5.612.343.470.292.421.2]Figure 5. Basic Steps To Find The Best Threshold Value
[image:5.612.317.516.492.613.2]Figure 6. Overall Experiment For The Proposed Method
Figure 7. Experiment Stages Of Feature Extraction
Using 2D-DCT
Figure 8. Comparison Of Classification Accuracy For Several Threshold Values, Using MLP Classifier For
Several Hidden Units
Based on the best threshold value, we conducted several experiments which are summarized in Fig. 8. The result of overall experiments is shown in Fig. 9 to Fig. 12. Figure 9
Converting to grayscale
Cropping and down sampling
Full lip image; Folding lip image
Frame difference; Double difference
Horizontal-vertical image projection
MLP; SVM
Converting to grayscale
Cropping and down sampling
Frame difference for several threshold values seprately:
1, 2, 3, 5, 10, 15
MLP for some hidden units separately: 10, 20, 40, 60, 80, 100 Horizontal-vertical image projection
Converting to grayscale
Cropping and down sampling
Folded lip image
DCT: 16, 25, 36 coefficients
[image:5.612.123.251.527.680.2]ISSN: 1992-8645 www.jatit.org E-ISSN: 1817-3195
[image:6.612.316.523.69.224.2]398 shows comparison of CA for the proposed method using MLP as classifier. Figure 10 shows comparison of CA for the proposed method using SVM as classifier. Figure 11 shows comparison of AUC for the proposed method using MLP as classifier. Comparison of AUC for the proposed method using SVM as classifier is shown in Fig. 12. Of four combinations of feature extraction method, i.e. (1) full lip image and frame difference, (2) folded lip image and frame difference, (3) full lip image and double difference, (4) folded lip image and double difference, the best CA and AUC is achieved by folded lip image and double difference. The exception occurs when using polynomial kernel for SVM as classifier. The polynomial kernel result is worse than the others.
Figure 9. Comparison Of Classification Accuracy For The Proposed Method, Using MLP for Several Hidden
Units
[image:6.612.316.514.267.406.2]Figure 10. Comparison Of Classification Accuracy For The Proposed Method, Using SVM for Several Kernels
Figure 11. Comparison Of AUC For The Proposed
[image:6.612.97.296.330.445.2]Method, Using MLP As Classifier for Several Hidden Units
Figure 12. Comparison Of AUC For The Proposed
Method, Using SVM As Classifier For Several Kernels
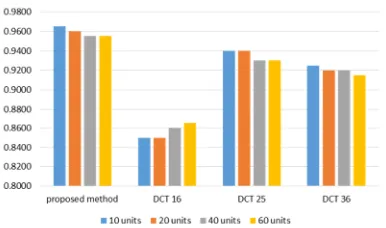
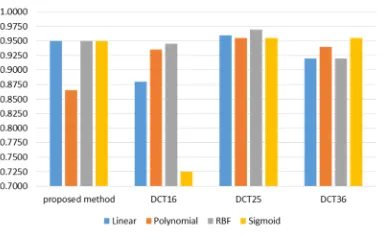
[image:6.612.93.293.491.600.2]The comparison of the proposed method and 2D-DCT shows the proposed method exceeds 2D-DCT in CA and AUC, specifically when using MLP as classifier. The proposed method achieves 96.5% in CA and 0.9993 in AUC, whereas 2D-DCT achieves 94% in CA and 0.9978 in AUC. This comparison is shown in Fig. 14 and Fig 15. Nevertheless, in Fig. 16 and Fig. 17, when using SVM as classifier, 2D-DCT using 25 coefficients slightly exceeds the proposed method.
[image:6.612.320.513.584.698.2]399
Figure 14. Comparison Of AUC For Proposed Method And
[image:7.612.94.289.265.386.2]2D-DCT, Using MLP As Classifier
Figure 15. Comparison Of Classification Accuracy For Proposed Method And 2D-DCT, Using SVM As Classifier
Figure 16. Comparison Of AUC For Proposed Method
And 2D-DCT, Using SVM As Classifier
4. DISCUSSIONS
The proposed method has a small calculation, that is: (1) absolute subtraction between two adjacent frames and apply the threshold value, (2) in each frame, summing the value of the pixel in rows and columns respectively. Because of the simple computation, this method is very suitable to be applied in real time. In addition, input and output methods are in integers, i.e. grayscale value (0 to 255), binary, number of rows and columns,
therefore it is very appropriate to be applied to a device of limited resources such as smartphones. However, the proposed method has limitations and assumptions, i.e. input of this method is simple words, which has two syllables with a maximum duration of 0.75 seconds.
In this research, we used double difference instead of three-frame difference. Actually, double difference algorithm is similar to three-frame difference in processing three consecutive frames. However, double difference apply a threshold on the difference between the frame at time k and k-1 and between the frame at time k-1 and k-2, then combining the results of both using AND logic [26]. Meanwhile, three-frame difference [27] operates threshold difference between the frame at time k and k-1 and between the frame at time k+1 and k, combining them with AND logic. In signal processing perspective, k+1 in input means input in the next sampling, therefore three-frame difference is designed to process recorded data, not in real time.
The threshold value for frame difference and double difference is very sensitive. It is not about threshold value in one frame but for all frame in one video data. The value corresponds to speed of object and frame rate [28]. Applying adaptive threshold method is probably the best choice, but the calculation is very complicated, therefore not suitable for real time. Manually threshold determination may be the right choice, however can not apply in general case. Meanwhile, the methods for calculating optimum threshold have not been studied yet, because this research concentrate on the proposed method.
[image:7.612.93.293.414.539.2]ISSN: 1992-8645 www.jatit.org E-ISSN: 1817-3195
400 On the other hand, when we used SVM as classifier, for overall experiments using CA measurement (see Fig. 10), the best kernel is RBF. In Fig. 12, RBF kernel is the best for two algoritms, and sigmoid kernel is the best for two other ones. In both figures (Fig. 10 and Fig. 12), polynomial kernel is the worst for all algorithms, perhaps because the characteristics of the data does not correspond to the polynomial kernel or due to a failure in the kernel parameter optimization.
To determine which classifier is better for this study, whether MLP or SVM, data in this research is too little. But if we still want to compare the both, especially for the best algorithm, combination of folded lip image and double difference, it appears that the MLP showed better results. In Fig, 9 and Fig. 10, all the results of the MLP is above 95%, while the highest SVM results only 95%. Meanwhile, in the Fig. 11 and Fig. 12, only one of the four results of the MLP is lower than 0.990, whereas three of the four results of the SVM are lower than that value.
In this research, we used 2D-DCT to extract the feature and reduce the dimensionality, therefore we choose 16, 25 and 36 coefficients. This number is chosen in order to get the number of features around 32, because the proposed method results are 32 features. Result of 36 coefficients is not better than 25 coefficients, but increases the number of feature and of course, the computational load.
5. CONCLUSIONS
This paper discusses the use of the proposed method, namely combination of frame difference method and horizontal-vertical image projection for automatic lip reading, in recognizing daily Indonesian words. This proposed method has low computation, also output in integer, therefore very suitable for use in real time using limited resources device like smartphone or microcontroller.
The comparison of the proposed method and 2D-DCT shows that the proposed methods exceed 2D-DCT in CA and AUC, especially when using MLP as classifier. The proposed method achieves 96.5% in CA and 0.9993 in AUC, whereas 2D-DCT achieves 94% in CA and 0.9978 in AUC. Our future work in this area involves
evaluating the proposed method on classifying more words, also using videos recorded outdoors. Other works include studying the use of adaptive or optimum method in determining the threshold value
ACKNOWLEDGEMENT
We would like to express our gratitude to Yosi Kristian and Himawan Wicaksono, due to the meaningful discussion about video processing and machine learning.
REFERENCES
[1] V. Estellers and J.-P. Thiran, “Multi-pose lipreading and audio-visual speech recognition,” EURASIP J. Adv. Signal Process., vol. 2012, no. 1, pp. 1–23, 2012. [2] A. B. Hassanat, “Visual Passwords Using
Automatic Lip Reading,” Int. J. Sci. Basic Appl. Res., pp. 218–231, 2014.
[3] B. Denby, T. Schultz, K. Honda, T. Hueber, J. M. Gilbert, and J. S. Brumberg, “Silent speech interfaces,” Speech Commun., vol. 52, no. 4, pp. 270–287, Apr. 2010.
[4] S. Chen, D. M. Quintian, and Y. L. Tian, “Towards a Visual Speech Learning System for the Deaf by Matching Dynamic Lip Shapes,” in ICCHP’12, Berlin, 2012, pp. 1– 9.
[5] S. L. Wang, A. W. C. Liew, W. H. Lau, and S. H. Leung, “An Automatic Lipreading System for Spoken Digits With Limited Training Data,” IEEE Trans. Circuits Syst. Video Technol., vol. 18, no. 12, pp. 1760–1765, Dec. 2008.
[6] J. Shin, J. Lee, and D. Kim, “Real-time lip reading system for isolated Korean word recognition,” Pattern Recognit., vol. 44, no. 3, pp. 559–571, Mar. 2011.
401 [8] J. Pelemans, K. Demuynck, P. Wambacq, and
others, “Speech recognition web services for Dutch,” Proc. LREC 2014, pp. 3041–3044, 2014.
[9] A. Farag, M. El Adawy, and A. Ismail, “A robust speech disorders correction system for Arabic language using visual speech recognition.,” Biomed. Res., vol. 24, no. 2, pp. 185–192, 2013.
[10] E. Setyati, S. Sumpeno, M. H. Purnomo, K. Mikami, M. Kakimoto, and K. Kondo, “Phoneme-Viseme Mapping for Indonesian Language Based on Blend Shape Animation,” IAENG Int. J. Comput. Sci., vol. 42, no. 3, 2015.
[11] M. Muljono, S. Sumpeno, A. Arifin, D. Arifianto, and M. H. Purnomo, “Indonesian Text to Audio Visual Speech with Animated Talking Head,” Int. Rev. Comput. Softw. IRECOS, vol. 11, no. 3, p. 261, Mar. 2016. [12] A. Nasuha, T. A. Sardjono, and M. H.
Purnomo, “Lip segmentation and tracking based on Chan-Vese model,” in Information Technology and Electrical Engineering (ICITEE), 2013 International Conference on, Yogyakarta, Indonesia, 2013, pp. 155–158. [13] M. Li and Y. Cheung, “A novel motion based
lip feature extraction for lip-reading,” in Computational Intelligence and Security, 2008. CIS’08. International Conference on, 2008, vol. 1, pp. 361–365.
[14] X. Liu, Y. Cheung, M. Li, and H. Liu, “A Lip Contour Extraction Method Using Localized Active Contour Model with Automatic Parameter Selection,” 2010, pp. 4332–4335. [15] G. Potamianos, C. Neti, J. Luettin, and I.
Matthews, “Audio-visual automatic speech recognition: An overview,” Issues Vis. Audio-v. Speech Process., vol. 22, p. 23, 2004.
[16] M. J. Lee and S.-Y. Lee, “Unsupervised Extraction of Multi-Frame Features for Lip-Reading,” in Neural Information Processing, 2006, vol. 10, pp. 97–104. [17] Y. Kameda and M. Minoh, “A human motion
estimation method using 3-successive video frames,” presented at the International
Conference on Virtual Systems and Multimedia, Gifu, Japan, 1996, pp. 135–140. [18] Y. E. Saady, A. Rachidi, M. El Yassa, and D.
Mammass, “Amazigh handwritten charac- ter recognition based on horizontal and vertical centerline of character,” Int. J. Adv. Sci. Technol., vol. 33, no. 17, pp. 33–50, 2011. [19] N.-E. Ayat, M. Cheriet, and C. Y. Suen,
“Optimization of the SVM kernels using an empirical error minimization scheme,” in Pattern Recognition with Support Vector Machines, Springer, 2002, pp. 354–369. [20] G. Seni and J. F. Elder, Ensemble Methods in
Data Mining: Improving Accuracy Through Combining Predictions, vol. 2. Morgan & Claypool, 2010.
[21] J. Huang and C. X. Ling, “Using AUC and accuracy in evaluating learning algorithms,” IEEE Trans. Knowl. Data Eng., vol. 17, no. 3, pp. 299–310, 2005.
[22] Young-Un Kim, Sun-Kyung Kang, and Sung-Tae Jung, “Design and implementa- tion of a lip reading system in smart phone environment,” Inf. Reuse Integr. 2009 IRI 09 IEEE Int. Conf. On, pp. 101–104, Aug. 2009. [23] M. G. Song, M. Tariquzzaman, J. Y. Kim, S.
T. Hwang, and S. H. Choi, “A Robust and Real-Time Visual Speech Recognition for Smartphone Application,” Int. J. Innov. Comput. Inf. Control, vol. 8, no. 4, pp. 2837– 2853, Apr. 2012.
[24] X. Hong, H. Yao, Y. Wan, and R. Chen, “A PCA based visual DCT feature extraction method for lip-reading,” in 2006 Inter- national Conference on Intelligent Information Hiding and Multimedia, 2006, pp. 321–326.
[25] J. F. G. Pérez, A. F. Frangi, E. Lleida-Solano, and K. Lukas, “Lip Reading for Robust Speech Recognition on Embedded Devices.,” in ICASSP (1), 2005, pp. 473–476.
ISSN: 1992-8645 www.jatit.org E-ISSN: 1817-3195
402 [27] Y. Zhang, X. Wang, and B. Qu,
“Three-Frame Difference Algorithm Research Based on Mathematical Morpho- logy,” Procedia Eng., vol. 29, pp. 2705–2709, 2012.