RESEARCH ARTICLE
Maturation of heart valve cell populations during postnatal
remodeling
Alexia Hulin1,2, Luis Hortells1, M. Victoria Gomez-Stallons1, Anna O’Donnell1, Kashish Chetal3, Mike Adam4, Patrizio Lancellotti2,5,6, Cecile Oury2, S. Steven Potter4,7, Nathan Salomonis3,7and Katherine E. Yutzey1,7,*
ABSTRACT
Heart valve cells mediate extracellular matrix (ECM) remodeling during postnatal valve leaflet stratification, but phenotypic and transcriptional diversity of valve cells in development is largely unknown. Single cell analysis of mouse heart valve cells was used to evaluate cell heterogeneity during postnatal ECM remodeling and leaflet morphogenesis. The transcriptomic analysis of single cells from postnatal day (P)7 and P30 murine aortic (AoV) and mitral (MV) heart valves uncovered distinct subsets of melanocytes, immune and endothelial cells present at P7 and P30. By contrast, interstitial cell populations are different from P7 to P30. P7 valve leaflets exhibit two distinct collagen- and glycosaminoglycan-expressing interstitial cell clusters, and prevalent ECM gene expression. At P30, four interstitial cell clusters are apparent with leaflet specificity and differential expression of complement factors, ECM proteins and osteogenic genes. This initial transcriptomic analysis of postnatal heart valves at single cell resolution demonstrates that subpopulations of endothelial and immune cells are relatively constant throughout postnatal development, but interstitial cell subpopulations undergo changes in gene expression and cellular functions in primordial and mature valves.
KEY WORDS: Heart valve, Development, Single cell RNA sequencing, Valve cell lineages, Cardiovascular science
INTRODUCTION
Mature heart valves in vertebrates consist of valve interstitial cells (VICs) and hematopoietic-derived cells (Hulin et al., 2018) embedded in a stratified extracellular matrix (ECM) surrounded by valve endothelial cells (VECs) (Hinton et al., 2006). At birth, heart valves are not yet fully mature, and postnatal ECM remodeling in humans and mice generates distinct ECM layers (Aikawa et al., 2006; Hinton et al., 2006). Heart valve remodeling includes elongation of valve leaflets with increased collagen and elastin production, leading to formation of collagen-, proteoglycan- and elastin-rich layers by postnatal day (P)30 in mice and during childhood in humans (Aikawa et al., 2006; Hinton et al., 2006). Although embryonic heart
valve development is well studied, regulatory mechanisms of postnatal valve ECM remodeling are relatively unknown. Moreover, postnatal VICs transition from minimally proliferative to increasingly quiescent at the transcriptional level in healthy adults (Hinton et al., 2006). In addition to VICs, other cell lineages are present in developing and mature valves, including multiple hematopoietic cell lineages that change after birth (Hulin et al., 2018). Nevertheless, a comprehensive analysis of cell composition and heterogeneity in postnatal heart valve remodeling has not previously been reported.
Endothelial, interstitial, and immune cell lineages have been identified in heart valves, but diversity and subpopulations within these lineages are not well characterized, and VIC differentiation profiles in remodeling heart valves after birth have not been defined. In mature pig aortic valves, VECs on aortic and ventricular surfaces have distinct gene expression profiles, but it is not known when these differences arise during development or how heterogeneous VECs are in actively remodeling valves (Simmons et al., 2005). Diverse populations of hematopoietic-derived cell types, including macrophages and dendritic cells, are present in developing valves, but the full complement of infiltrating cells has not been previously determined (Anstine et al., 2017; Hulin et al., 2018; Visconti et al., 2006). Pigmented cells with characteristics of melanocytes also are evident in mature and diseased mouse valves, but definitive gene expression profiles of these cells have not previously been reported (Balani et al., 2009; Hulin et al., 2017; Mjaatvedt et al., 2005). Finally, it has long been suspected that VICs, the primary ECM-producing cells within heart valves, are heterogenous, with distinct subpopulations producing specific types of ECM in the developing valve strata (Liu et al., 2007), but data on VIC subpopulations and diversity in gene expression profiles in vivo are still missing. Specifically, it is not known whether distinct VIC cell-types are responsible for production of collagen-, proteoglycan-and elastin-rich ECM layers during postnatal heart valve remodeling. Moreover, it is likely that additional cell types are present in remodeling heart valves, necessitating a full unbiased characterization of cell types based on gene expression at the single cell level during the postnatal period.
Using droplet sequencing (DropSeq), we performed single cell RNA sequencing (scRNA-Seq) on heart valves at two distinct developmental stages, comparing premature valve primordia at P7 with fully stratified leaflets at P30, to define an atlas of heart valve cell diversity, and to identify key cell subsets involved in postnatal collagen production and ECM remodeling. Our study confirms and uncovers distinct subpopulations of endothelial, immune and melanocyte cells present both at P7 and P30. For the first time, postnatal differentiation of VICs is shown, with identification of collagen- and proteoglycan-expressing VICs at P7 that are transcriptionally distinct from P30 VICs, which include multiple different subpopulations.
Received 19 October 2018; Accepted 7 February 2019
1The Heart Institute, Division of Molecular Cardiovascular Biology, Cincinnati
Children’s Hospital Medical Center, Cincinnati, OH45229, USA.2Laboratory of
Cardiology, GIGA Cardiovascular Sciences, University of Liège, CHU Sart Tilman, Liège 4000, Belgium.3Division of Biomedical Informatics, Cincinnati Children’s
Hospital Medical Center, Cincinnati, OH45229, USA.4Division of Developmental
Biology, Cincinnati Children’s Hospital Medical Center, Cincinnati, OH45229, USA.
5University of Liège Hospital, GIGA Cardiovascular Sciences, Department of
Cardiology, Heart Valve Clinic, CHU Sart Tilman, Liège 4000, Belgium.6Gruppo
Villa Maria Care and Research, Anthea Hospital, Bari 70124, Italy.7Department of
Pediatrics, University of Cincinnati College of Medicine, Cincinnati, OH45229, USA.
*Author for correspondence ([email protected])
N.S., 0000-0001-9689-2469; K.E.Y., 0000-0002-1444-7124
DEVEL
O
RESULTS
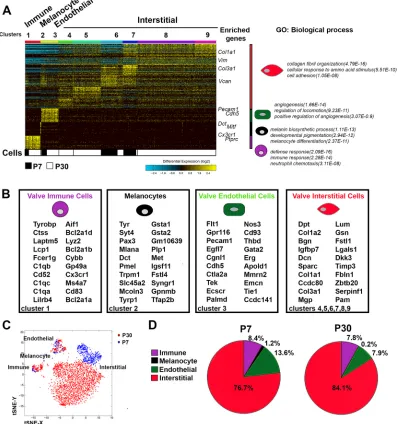
Heterogeneity of P7 and P30 heart cells is revealed by Droplet single cell RNA sequencing and unbiased cell clustering To study heart valve single cell transcriptomes and subpopulations during postnatal valve maturation, two developmental stages were chosen: P7 and P30. At P7, the formation of a collagen layer starts to be detected in valve leaflets (Fig. 1A, black arrowheads), in contrast
[image:2.612.108.506.142.659.2]to its low expression at P1 (Amofa et al., 2017), but the primitive leaflets remain thickened (Fig. 1A). At P30, valve leaflets are elongated with regionalized distribution of fibrillar collagen and proteoglycan (Fig. 1A) (Amofa et al., 2017). Single cell isolations from aortic and mitral valve leaflets were obtained from valves dissected from P7 and P30 mouse pups, which were pooled and dissociated to obtain single cell suspensions. DropSeq was then
Fig. 1. Determination of main heart valve cell populations by droplet sequencing of cells from dissociated mitral and aortic valves at postnatal days P7 and P30.(A) Representative pentachrome staining of murine P7 and P30 aortic and mitral valve leaflets displays an ECM composition of
glycosaminoglycan (blue stain, white arrowheads) and collagen (yellow stain, black arrowheads). P7 and P30 aortic and mitral valve leaflets dissected from murine heart were digested to obtain a single cell suspension. DropSeq was performed and sequences analyzed using AltAnalyze software. (B) Heat map of genes delineated by Iterative Clustering and Guide-gene Selection (ICGS) (n=2840 individual cells). Columns represent cells; rows represent genes. Cell clusters are indicated (top). Text on the right indicates selected genes used as guides. The origin of cells from P7 (white) or P30 (black) heart valves is indicated in the bar at the bottom. (C) t-SNE representation derived from ICGS heatmaps shows the nine cell clusters. (D) Projection of gene expression onto t-SNE plots indicates four main heart valve cell types: immune (Cx3cr1), melanocytes (Dct), endothelial (Pecam1) and interstitial (Col1a1) cells. Scale bars: 100 µm.
DEVEL
O
performed to generate gene expression profiles from individual cells. After initial sequence analysis and exclusion of outliers and low expressing cells, 18,702 transcripts from 594 P7 cells and 2246 P30 cells were analyzed (Fig. 1B). The scRNA-Seq data were subjected to the Iterative Clustering and Guide-gene Selection (ICGS) algorithm from the open-source software AltAnalyze (Fig. 1A) (Magella et al., 2018; Olsson et al., 2016; Salomonis et al., 2009), which allows identification of cell populations based on highly intra-correlated genes in each cell cluster defined by de novo guide genes. ICGS of the entire scRNA-Seq dataset resolved nine clustered cell populations (Fig. 1B). P7 cells are present within five cell clusters and P30 cells are present within seven cell clusters (Fig. 1B). Although cell clusters 1 to 3 are clearly transcriptionally distinct, cell clusters 4 to 9 display some similar guide-genes but with diverse expression levels (Fig. 1B). This initial clustering of cells clearly separates immune,
melanocyte, endothelial and interstitial subpopulations of cells, based on guide gene identity in remodeling valves.
[image:3.612.108.506.258.682.2]The transcriptional separation of different cell clusters is further validated by a t-Distributed Stochastic Neighbor Embedding (t-SNE) dimensional reduction that indicates similarities between individual cells (Fig. 1C). This t-SNE analysis indicates four major distinct cell populations (Fig. 1C). By superimposing expression of known heart valve cell markers in the t-SNE plot, clusters can be distinguished as immune (Cx3cr1, cluster 1), melanocyte (Dct, cluster 2), endothelial (Pecam1, cluster 3) and interstitial cells (Col1a1, clusters 4 to 9) (Fig. 1C,D). We used the MarkerFinder function in AltAnalyze (Fig. 2A) to identify the top enriched genes for each heart valve cell cluster (Fig. 2B). Enriched genes are analyzed with GO-Elite to identify enriched biological processes (Fig. 2A). As expected, the immune cell cluster exhibits functional processes in defense and immune response, whereas endothelial
Fig. 2. Gene expression signatures for the four main heart valve cell populations present in P7 and P30 aortic and mitral valve leaflets.(A) Marker finder from ICGS performed on transcriptomes of P7 and P30 single cells. On the right, characteristic enriched genes and the top three biological processes are shown aligned for major cell populations (n=2840 individual cells). (B) Gene signatures defined as the top 20 correlated genes are shown for major heart valve cell populations present in indicated cell clusters. (C) t-SNE representation derived from ICGS heatmaps shows P7 (blue) or P30 (red) origins of represented cells. (D) Pie charts display percentages of cells in each major heart valve cell cluster at P7 and P30.
DEVEL
O
cells are involved in angiogenesis and locomotion (Fig. 2A). Melanocytes are a small but distinct population characterized by melanin synthesis and pigmentation through expression of Dct, Mitf, Tyr and Pax3 (Fig. 2A,B). During postnatal development, melanocytes undergo differentiation illustrated by decreased Dct expression (Fig. S1A-D), while melanin production is increased from P7 to P30 in AoV and MV leaflets (Fig. S1E-H). Interstitial cells of clusters 4 to 9 express the ECM genesCol1a1,Vim,Col3a1, Vcan,Bgnand Lum, which is indicative of enriched processes of collagen fibril organization and cell adhesion (Fig. 2A). Although closely related when compared with endothelial cells, immune cells and melanocytes (Figs 1C and 2A), interstitial cells display increased heterogeneity relative to other cell types. Interestingly, heart valve cells cluster in the four major cell populations independently of their diverse developmental origins (Fig. 2C). The relative proportions of melanocytes, interstitial, endothelial and immune cells are similar at P7 and P30; however, the percentage of interstitial cells is increased at P30, which is reflected in decreased proportions of the other cell types (Fig. 2D).
As our single cell preparation is a mixture of female and male heart valve cells, we assessed possible sexual dimorphism in gene expression. Cells were segregated as female if expressing Xist
or as male if expressingDdx3y, Eif2s3y,Erdr1, Kdm5d orUty. Unspecified cells were classified based on expression of neither or both classes of genes (Skelly et al., 2018). Female and male cells are equally distributed in cell clusters (Fig. S2A,B), and similar clustering patterns are observed at P7 (Fig. S2C) and P30 (Fig. S2D) between male and female cells. When comparing overall gene expression between female and male for each developmental stage, the vast majority of differentially expressed genes in males versus females are below a twofold change, with a median relative fold change close to 1.1 (Fig. S2E,F). Thus, heart valve cell clustering is not significantly altered by sex. Together, DropSeq and unbiased ICGS identify major heart valve cell populations as immune, melanocyte, endothelial and interstitial cells with relatively more heterogeneity and developmental maturation of interstitial cells.
Heart valve immune cells are composed of five distinct populations that undergo maturation with postnatal development
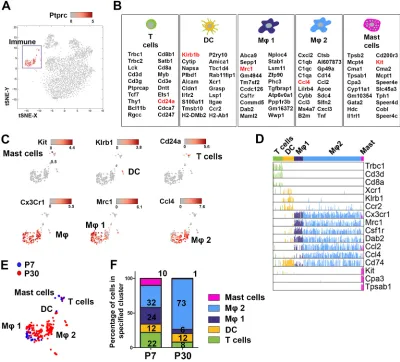
[image:4.612.105.505.314.676.2]To explore the cell clusters in more detail, immune, endothelial and interstitial cell clusters were further analyzed. ICGS of immune cells, illustrated by Ptprc expression (Fig. 3A), highlights five distinct immune cell subpopulations (Fig. S3A), which display different gene
Fig. 3. Heart valve immune cells consist of five populations, including two different macrophage subpopulations.(A) t-SNE representation derived from ICGS heatmaps shows immune cell populations defined byPtprcexpression. (B) Gene signatures of the top 20 correlated genes are shown for immune cell subpopulations (genes highlighted in red are projected on t-SNE plots). (C) Magnification of immune t-SNE plots displays immune subpopulations illustrated by expression ofKit(mast cells),Klrb1[dendritic cells (DCs)],Cd24a(T cells) andCx3cr1(macrophage, Mϕ), including two macrophage subpopulations illustrated by increasedMrc1expression (Mϕ1) andCcl4expression (Mϕ2). (D) Comb plot for immune cell markers. (E) t-SNE plot showing P7 (blue) or P30 (red) origins of immune cells. (F) Histogram displays percentages of cells in immune cell populations for each developmental stage.
DEVEL
O
signatures (Fig. 3B,C) and enriched biological processes (Fig. S3A). The five populations have gene expression characteristics of T cells (Cd24a,Trbc1,Cd3d,Cd8a), dendritic cells (DCs) (Klrb1,Xcr1), mast cells (Kit, Cpa3, Tpsab1) and macrophages, including two distinct subsets: Mϕ1 (Mrc1) and Mϕ2 (Ccl2,Ccl4) (Fig. 3C,D). Mϕ2 exhibit higher expression of the chemokinesTnfandCd74(Fig. 3D), whereas Mϕ1 express genes involved in macrophage differentiation (e.g. Dab2, Maf, Csf1r) and CD206 (Mrc1) (Fig. 3D). During postnatal heart valve development, mast cells and T-cell populations decrease from P7 to P30, with a switch from naïve towards effector memory T cells (Fig. 3E,F; Fig. S3C, Table S1). While the relative number of dendritic cells remains unchanged, the Mϕ1 population is decreased, whereas Mϕ2 represent almost 75% of immune cells, in P30 heart valve leaflets (Fig. 3E,F). During development, immune cell function matures toward antigen presentation (Fig. S3D, Table S2), immune and defense response (Fig. S3E,F, Tables S3 and S4). Therefore, scRNA-Seq of developing heart valves indicates that T cells, mast cells, dendritic cells and macrophages account for immune cells found in heart valves.
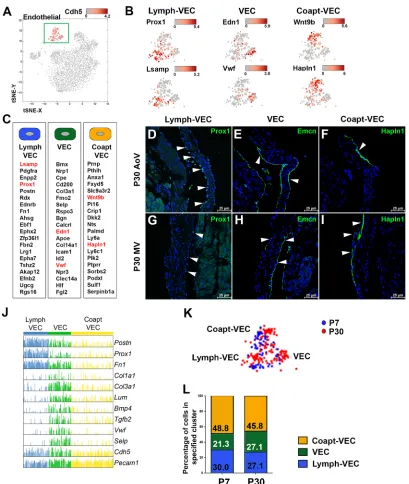
The endothelial cell population includes three spatially distinct subpopulations that are similar at P7 and P30 ICGS analysis was performed on the endothelial cell cluster, exemplified byCdh5expression (Fig. 4A). As a result, endothelial cells can be separated into three endothelial subclusters (Fig. S4A) shown in higher magnification of t-SNE plots (Fig. 4B). The lymph-VECs are characterized by a gene signature includingProx1, which is involved in lymph vessel development and is specific to lymphatic VECs (Fig. 4C, Fig. S4A). Cells expressing Prox1, as detected by immunostaining, are located on the fibrosa side, away from blood flow, in both AoV and MV leaflets, with 22.2±13.7% of endothelial cells expressing Prox1 (Fig. 4D,G; Fig. S4B,E). The second cluster was characterized as VECs due to high expression of typical endothelial cells markers, e.g.Emcn,Edn1,Vwf(Fig. 4B,C; Fig. S4A). Endomucin-expressing cells are located close to Prox1-expressing lymph-VECs in the AoV, as well as in the proximal part of the atrialis side of the MV at P30, with 59.8±13.1% of endothelial cells expressing Emcn (Fig. 4E,H, Fig. S4C,F). These VECs also express several growth factors (Bmp4andTgfb2), as well as ECM genes (Fig. 4J). The third endothelial cell subcluster displays a gene signature (Fig. 4C) related to cell migration and actin filament polymerization (Fig. S4A), and is characterized by expression of Hapln1and genes related to Wnt-βcatenin signaling, such asWnt9b and Dkk2(Fig. 4B). Interestingly, the cells identified by Hapln1 immunostaining are in the area where leaflet coaptation occurs, with 29.1±5.6% of endothelial cells expressing Hapln1 (Fig. 4F,I, Fig. S4D,G), and are therefore named coapt-VECs. Similarly, the three endothelial cell subsets can be found and exhibit similar location in adult murine (Fig. S5A-F), porcine (Fig. S5G-I) and human (Fig. S5J-L) AoVs. Diversification of endothelial cells in distinct regions of the valves occurs by P7, as the percentage of cells in each subset is similar between P7 and P30 (Fig. 4K,L). During development, some differentially expressed genes (DEGs) are observed for each endothelial subcluster, mostly involved in response to calcium and cAMP (Fig. S4H-J). Specifically, P30 lymph-VECs display genes characteristic of increased interaction with immune cells (Fig. S4H, Table S5), P30 VECs have increased levels of genes required for ribogenesis (Fig. S4I, Table S6) and P30 coapt-VECs have increased expression of genes involved in response to extracellular stimulus (Fig. S4J, Table S7). Altogether, three endothelial cell populations that display specific spatial location are identified in P7 and P30 heart valve leaflets.
Valve interstitial cells are heterogenous, with highly synthetic subsets at P7 and distinct gene expression profiles at P30 More than 75% of heart valve cells express Col1a1 (Fig. 2D, Fig. 5A) at P7 (76.7%) and P30 (84%), and thus are classified as interstitial cells. Unlike endothelial and immune cells, interstitial cells from P7 and P30 valves do not cluster together (Fig. 5B), indicative of ongoing interstitial cell differentiation during the first month after birth. P7 VICs display higher synthetic activity, with enriched biological processes involved in collagen fibril organization, peptide cross-linking and bone formation (Fig. 5C, Table S8). Gene expression profiles of interstitial cell populations at P7 were analyzed to identify cell populations responsible for collagen production and ECM remodeling active at this stage. Based on gene expression, P7 VICs are clustered into two subsets (Fig. S6A). The Col-VIC subpopulation highly expressesCol1a1 (Fig. S6A; Fig. 5D,E) and represents about 50% of P7 VICs (Fig. 5F). DEGs between the two clusters (Table S9) reaffirm that Col-VICs not only express fibrillar collagen genes, but also genes involved in fibril organization and ECM maturation, e.g.Prelp,Fmod, Ctgf, Dcn(Fig. 5G). The other P7 interstitial subset is, in contrast to Col-VIC, named GAG-VIC, as illustrated by glycosaminoglycan (GAG)-related Lum, Fbln2 and Vcan expression (Fig. 5D,G). Interestingly,PostnandSox9expression, which is associated with the development of collagen-rich and proteoglycan-rich tissues, does not differ between the two clusters (Fig. S6B). In heart valve leaflets, Col-VICs are in the fibrosa, as illustrated by Col1a1 immunoreactivity (55.6% of leaflet area), whereas GAG-VICs expressing versican are mostly found in the tip of leaflet (44.4% of leaflet area) and are absent in the hinge (Fig. 5H-K). A specific elastin-producing VIC cluster was not identified, although expression ofEln(1.49-fold change) is higher in P7 VICs than in P30 VICs (Fig. S6B,C). Still,Elnis expressed in both P7 Col- and GAG-VICs (Fig. S6B). These analyses define two major heterogeneous subpopulations of VICs that are responsible for compartmentalized ECM stratification during active valve remodeling at P7.
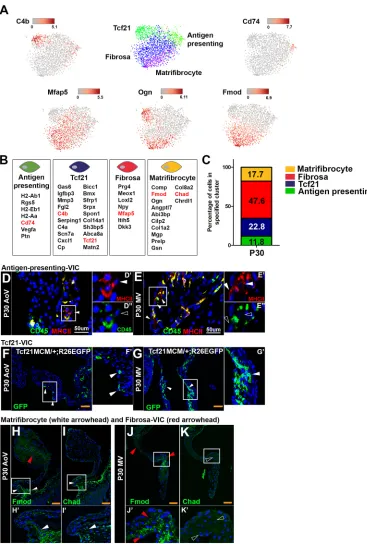
The major events of heart valve stratification and morphogenesis are complete at P30, when interstitial cells are subdivided into four subsets with gene expression distinct from P7 VICs (Fig. S6C). Matrifibrocytes, a recently described fibroblast subpopulation present after cardiac injury (Fu et al., 2018), express numerous interstitial cell markers with characteristic higher expression of Comp,FmodandChad(Fig. 6A,B; Fig. S6C), which are related to collagen fibril organization, wound healing and endochondral bone formation (Fig. S6D). Nearly 50% of VICs are characterized as fibrosa-VICs, which have typical fibroblast characteristics and express established interstitial cells markers such asPostnandVim, and additional genes involved in ECM and collagen organization (Fig. S6D). However, these cells have lower levels of osteogenic gene expression than matrifibrocytes. An additional previously unreported cell type (Tcf21-VIC) expresses multiple complement genes involved in defense response,C4b,C4aandCp, as well as Tcf21 (Fig. 6A,B; Fig. S6C,D). Finally, antigen-presenting VICs express genes involved in antigen processing and presentation via MHCII, such as Cd74 (Fig. 6A,B; Fig. S6D). These two VIC clusters also expressSox9andPostn, but notScx(Fig. S6C), which is a marker of early postnatal interstitial cells (Levay et al., 2008) expressed in almost all P7 VICs (Fig. S6B). Together, these analyses demonstrate the presence of at least four subpopulations of VICs at P30.
Immunohistochemistry and cell lineage analysis were used to localize and determine MV versus AoV specificity of VIC
DEVEL
O
subpopulations in P30 valves. Localization of antigen-presenting VICs is confirmed by expression of MHCII (Fig. 6D′,E′) in CD45-negative (Fig. 6D″,E″) cells, although at lower percentages, in the AoV (2.6±1.1%) and MV (1.4±0.5%) leaflets (Fig. 6D,E). Tcf21-VICs, detected using a tamoxifen-inducible Tcf21Cre-dependent GFP reporter (Acharya et al., 2011a), are found mostly in the non-collagenous part of MV (33.1±5.5%) (Fig. 6F), while only few complement-VICs are detected in the AoV (3.7±1.1%) (Fig. 6E). Conversely, matrifibrocytes, as illustrated by co-expression of Fmod and Chad, are found predominantly in the
[image:6.612.102.511.53.537.2]hinge region only in AoV (Fig. 6G,H, white arrowheads) but not in MV (Fig. 6I,J). Finally, fibrosa-VICs, illustrated by Fmod staining, but lacking Chad expression, can be found in the fibrosa in both the AoV and MV (Fig. 6G,I, red arrowheads). Interestingly,Postn and Sox9 are not definitive gene markers for specific interstitial cell subpopulations, but are found in multiple subpopulations (Fig. S6C,D). Thus, multiple interstitial subpopulations are present in P30 valves with distinct functional processes and predominance in the AoV versus MV. Altogether, this study depicts heart valve cell populations found in aortic and mitral valve leaflets, including Fig. 4. Endothelial cells include three subpopulations with spatially distinct localization in mitral and aortic valves.(A) t-SNE representation derived from ICGS heatmaps showing endothelial cells defined byCdh5expression. (B) Magnification of endothelial t-SNE plots with three subpopulations defined byProx1andLsampexpression (lymph-VEC),Edn1andVwf(VEC), andWnt9bandHapln1(coapt-VEC). (C) Gene signatures for endothelial cell subsets with genes highlighted in red projected onto t-SNE plots or studied by immunofluorescence staining. (D-I) Representative immunofluorescence (arrowheads, green) of Prox1 (D,G; lymph-VEC), Emcn (E,H; VEC) and Hapln1 (F,I; coapt-VEC) in P30 mouse AoV and MV leaflets. Nuclei are stained with DAPI (blue). Images are representative of five animals. Scale bars: 25 µm. (J) Comb plot for ECM and endothelial markers. (K) Endothelial t-SNE plot with P7 (blue) or P30 (red) cellular origins indicated. (L) Histogram displays percentages of cells in endothelial cell subpopulations at each developmental stage.
DEVEL
O
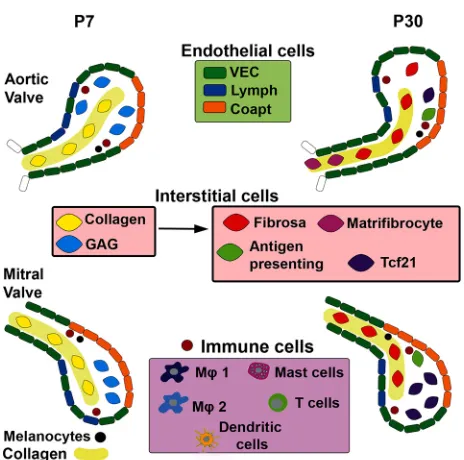
differentiation of interstitial cell populations during postnatal heart valve development (Fig. 7).
DISCUSSION
Although heart valve cells are responsible for production and remodeling of ECM during development, as well as for homeostasis during adult life, few studies have focused on the cellular heterogeneity of valve cells and their putative functions. We took advantage of DropSeq, a technology for the determination of transcriptomes of individual valve cells, to investigate the gene expression profiles of distinct cell populations in postnatal remodeling heart valve leaflets. Interestingly, subpopulations of endothelial and immune cells are relatively constant during postnatal development, but interstitial cell subpopulations undergo
significant changes in gene expression and cellular functions in primordial and mature valves. Moreover, the diversity in interstitial cell subpopulations demonstrates an unappreciated heterogeneity of cell types in valve ECM production and homeostasis after birth. Novel matrifibrocyte and complement-expressing populations in mature valves are suggestive of specific cell contributions to valve homeostasis and calcific disease mechanisms. Together, this study is the first unbiased transcriptomic analysis of heart valve cells to highlight heart valve cell heterogeneity and transitions in interstitial cells in heart valve remodeling after birth (Fig. 7).
[image:7.612.48.404.52.569.2]Here, we confirm that CD45-expressing cells of hematopoietic origin are present in developing valves (Hulin et al., 2018) and demonstrate the presence of macrophage subpopulations, dendritic cells, T cells and mast cells in remodeling valves. While infiltrating
Fig. 5. Valve interstitial cells at P7 are distinct from P30 and consist of collagen- and glycosaminoglycan-expressing subpopulations.(A) t-SNE representation derived from ICGS heatmaps showing interstitial cell cluster illustrated byCol1a1expression. (B) Cell origins of interstitial cell clusters are separated for P7 (blue) and P30 (red) valves. (C) At least twofold differentially expressed genes (DEGs) between P30 and P7 interstitial cells along with enriched biological processes for P7 VICs. (D) Magnification of P7 interstitial t-SNE plots with two P7 VIC subpopulations defined by high expression ofCol1a1, FmodandPrelp(Col-VIC) orLum (GAG-VIC).Postnis expressed in both VIC clusters. (E) Gene signatures of P7 VIC clusters with genes highlighted in red projected onto t-SNE plots. (F) Percentages of P7 interstitial cells in each subpopulation are indicated. (G) At least 1.5-fold DEGs between P7 Col-VIC and GAG-VIC subclusters and relative gene expression. (H-K) Representative Col1a1 (H,J) and Vcan (I,K) staining (green) performed in P7 AoV (H-I) and MV (J-K) leaflets. Valve leaflet ECM compartments are outlined in white (H-K). Boxed regions indicate areas magnified in H′-K′, with separation of VIC populations indicated by red lines. Nuclei are stained with DAPI (blue). Images are representative of five animals. Scale bar: 100 µm.
DEVEL
O
immune cell lineages have been noted in mature heart valves for many years, their functions in normal valve homeostasis and disease have not yet been determined (Hulin et al., 2018, 2017). The presence of T cells and mast cells in remodeling valves has not been reported previously, and they may have important, yet uncharacterized, roles in valve maturation. Similarly, pigmented cells have been noted previously in developing and diseased heart valves, but their specific origins and functions are not known (Mjaatvedt et al., 2005). Here, we show that these cells express definitive melanocyte markers, including Dct, confirming their cell identity as melanocytes. As these cells are often misidentified as
calcification by von Kossa staining, investigators should be aware of the presence of melanocytes in mouse models of valve disease. Together, our detailed single cell analysis demonstrates multiple cell types and lineages present in remodeling valves beyond multiple VEC and VIC subpopulations.
[image:8.612.49.416.55.599.2]Although previous studies have shown differences in valve endothelial cells on the fibrosa or elastin-rich sides of valve leaflets (Simmons et al., 2005), our study indicates that endothelial heterogeneity extends beyond side specificity. The VEC subset, which is characterized by classic endothelial markers, seems to correspond to endothelial cells described on the aortic side of
Fig. 6. P30 valve interstitial cells include four subpopulations with diverse biological processes and localization.(A) Magnification of interstitial t-SNE plots identifies P30 interstitial subpopulations defined by expression ofC4bandOgn (Tcf21-VIC),Cd74(antigen presenting-VIC), Mfap5(fibrosa-VIC), andFmodand Ogn(matrifibrocyte).Ognis expressed in Tcf21-VICs and Fmod-VICs. (B) Gene signatures for P30 VIC subsets with genes highlighted in red projected onto t-SNE plots or examined by immunofluorescence staining. (C) Percentage of P30 interstitial cells in each subpopulation is indicated. (D,E) Representative MHCII (CD74) and CD45 staining on P30 AoV (D) and MV (E) leaflets. White arrowheads indicate MHCII+CD45−cells. Black
arrowheads indicate absence of CD45 staining. (D′-E″) Channels for MHCII staining (D′,E′) and CD45 staining (D″, E″). (F-G′) GFP staining on AoV (F,F′) and MV (G,G′) leaflets from P30 Tcf21MCM/+;R26EGFPmice after neonatal (P0-P2) induction of Cre recombinase (representative ofn=3). (H,J) Fmod staining indicates matrifibrocytes (Chad+, white
arrowheads) and fibrosa-VICs (Chad−, red arrowheads) in the AoV hinge region (H,H′) and MV (J,J′) leaflets. (I,K) Chad staining indicates matrifibrocytes in the AoV (I,I′, arrowheads) and is not detected in MV leaflets (K,K′, arrowheads). Images are representative of five animals. Boxed regions in D-K are shown at higher magnification in D′-K′. Scale bars: 50 µm (white); 100 µm (orange).
DEVEL
O
porcine aortic valves described with higher Vwf and Selp expression, but we show that these cells can be found on both sides of the valve leaflets. Lymph-VECs are exclusively located away from pulsatile blood flow in a similar proportion to that reported in adult porcine aortic valves (Blancas et al., 2016). The presence of VICs with a lymphatic gene expression signature in developing valves has not been previously reported, and the specific functions of these cells in valve remodeling and homeostasis is unknown. The coaptation-VECs, which display enriched gene expression involved in cytoskeletal organization, are present in regions of high mechanical stress, where valve leaflets are exposed to high shear when open and compressive forces when closed (Thubrikar et al., 1980). Likewise, a recent study demonstrated restricted Wnt9b expression in endothelial layer of developing zebrafish heart valves in response to fluid forces (Goddard et al., 2017). These findings highlight potential contributions of biomechanical forces in valve biology, which could be important in establishing and maintaining VEC diversity in different parts of the valves.
By studying developing heart valves at P7 compared with P30, we have identified multiple subpopulations of ECM-expressing VICs, and these populations change from P7 to P30. During development, VICs arise from distinct embryonic origins. The majority of VICs are derived from the endocardial cushions, which arise by endothelial-to-mesenchymal transition at the AV canal and outflow tract (Gomez-Stallons et al., 2016). Additional valve interstitial cells of the semilunar valves are of neural crest origin and contribute to VICs (Gomez-Stallons et al., 2016) and melanocytes. Differences in neural crest versus endocardial cushion-derived VICs have not been detected, and it is not known whether the specific subpopulations of VICs detected in the current report have distinct embryonic origins. However, one population of VICs in the MV expresses Tcf21 and is likely derived from Tcf21-expressing epicardial cells that migrate into the parietal leaflets of the AV valves during fetal development (Lockhart et al., 2014). Interestingly, these cells also express multiple complement and enriched defense biological process genes at P30, with unknown
implications for valve homeostasis or disease. Similarly, transcriptome data from global murine valve tissue showed enrichment of the defense response in mature heart valves (Nordquist et al., 2018), and complement factors have been detected in humans with calcific aortic valve disease (CAVD) (Dikhoff et al., 2015; Schlotter et al., 2018). Still, the roles of Tcf21-VICs and valvular defense response are completely unknown.
We further sought to identify cell populations involved in collagen production and stratification of the ECM. Our analysis distinguished a specific VIC subset producing fibrillar collagens, in addition to genes related to collagen fiber assembly necessary to form the fibrosa layer at P7. As valve maturation and stratification proceeds, interstitial cells differentiate, collagen production decreases and VICs are become quiescent. At P30, fibrosa-VICs might differentiate from collagen-VICs present at P7. These cell populations display similar gene expression, although with lower levels and they are found in the fibrosa layer, consistent withScx cell lineage-tracing data (Levay et al., 2008). These collagen-producing cells are likely to play crucial roles in valve matrix organization and morphogenesis. Future investigations are needed to determine the onset and molecular mechanisms recruiting VIC progenitors to a collagen-producing subpopulation and inducing differentiation into mature fibrosa-VICs. Postn and Sox9 are expressed in multiple VIC subpopulations, consistent with their expression in embryonic valve progenitors (Lincoln et al., 2007; Snider et al., 2008), and thus may be less restricted than VIC subcluster genes induced during valve remodeling after birth. Still, PostnandSox9might display different role in VIC subpopulations upon post-transcriptional modifications and binding partners.
A subpopulation of VICs with properties of matrifibrocytes is localized in the hinge regions of AoVs, but is not detected in MVs. Interestingly, the hinge region of mouse AoVs is prone to calcification, as observed in the Klotho mouse model of premature aging (Cheek et al., 2012). The valve matrifibrocytes display a gene signature similar to fibrosa-VICs, as well as chondrocytes and osteoblasts, notably involved in maintaining collagenous environment. Matrifibrocytes represent a specialized subpopulation of cardiac fibroblasts that remain within the mature scar of an injured heart (Fu et al., 2018). Thus, matrifibrocytes in heart valves may have a role in pathologic calcification, supported by increased expression of the matrifibrocyte marker, Chad, in human bicuspid AoVs, which are susceptible to calcification (Padang et al., 2015). Together, our findings shown that VICs exhibit a complexity and heterogeneity that continues to mature during postnatal heart valve remodeling. Our study focusses on healthy developing aortic and mitral leaflets from P7 to P30, indicating that postnatal valve leaflets are not yet quiescent. Interstitial cell subpopulations and specific biological processes, including wounding and defense response, likely contribute to valve postnatal remodeling and homeostasis. Further exploration will define their specific functions in valve development, physiology and potentially pathophysiology, as activation of developmental pathways has been found to be reactivated during heart valve diseases.
[image:9.612.58.290.52.282.2]Some potential limitations of our single cell transcriptomic analysis exist. One possible limitation is that the cell isolation protocol underrepresents or over-represents specific cell populations. We acknowledge that our approach might miss putative small populations due to developmental stage, low gene expression or low cell number. Known heart valve cell populations were detected in this study, and even small populations of T cells and melanocytes in P30 heart valve leaflets were present in our cell isolations. Moreover, comparative relative percentages of CD31+
Fig. 7. Summary of mouse heart valve cell populations found in aortic and mitral valve leaflets, including differentiation of interstitial cells during postnatal development.
DEVEL
O
endothelial and CD45+hematopoietic cells were detected by flow cytometry and confirmed by immunohistochemistry using similar isolation protocols (Hulin et al. 2018). In both studies,∼80-85% of cells were CD31−CD45−, representing interstitial cells, with 5-7% endothelial cells and ∼10% immune cells. These relative proportions of cell types were maintained during postnatal heart valve remodeling. Moreover, quantification of immunostaining is consistent with the percentages obtained with our single cell RNA sequencing. It is interesting to note our study did not identify a specific VIC subcluster responsible for producing theEln-rich layer. Eln expression is higher in P7 VICs, when compared with P30 VICs, but a specificEln-expressing VIC cluster was not identified. To identify such cluster, additional studies need to be performed in larger animals that have a more predominant elastin layer than murine heart valves (Hinton et al., 2006). In addition, timing of elastin deposition during heart valve development is not clear and might precede P7. Pooling aortic and mitral valves in this study allowed us to obtain sufficient cell numbers but hindered detection of the putative differences between leaflets. Immunostaining supported the hypothesis that VIC subpopulations are found differentially in valve leaflets. Although Tcf21-VICs are located mainly in MV, matrifibrocytes are detected exclusively in aortic valve leaflets. Future studies will decipher whether VIC clusters and their associated enriched biological processes might predispose leaflets to calcification versus myxomatous degeneration.
In summary, this study highlights the diversity of cells present in remodeling heart valves and confirms that postnatal leaflets are still undergoing differentiation supported by interstitial cell plasticity and collagen layer formation after birth. The specific genetic markers and functionally distinct cell subpopulations identified here will be useful tools for heart valve tissue engineering optimization and open novel avenues to investigate molecular and cellular mechanisms of heart valve homeostasis and disease.
MATERIALS AND METHODS
Mice
All mouse experiments conform to NIH guidelines (Guide for the Care and Use of Laboratory Animals) and were performed with protocols approved by the Institutional Animal Care and Use Committee at Cincinnati Children’s Hospital Research Foundation. C57BL/6J mice were used and were obtained from Jackson Laboratory. Tcf21MerCreMer(MCM) mice
(Acharya et al., 2011a) were crossbred with aR26EGFPreporter line to
obtainTcf21MCM/+;R26EGFPmice. Perinatal induction of Cre recombinase
was achieved in Tcf21MCM/+;R26EGFP mice by intragastric injections of
50 µl of tamoxifen (Sigma-Aldrich) in corn oil at 1 mg/ml at P0, P1 and P2. Mice were sacrificed under isoflurane inhalation followed by cervical dislocation at the specific time point for each experiment. Male and female mice were used together for all analyses.
Heart valve single cell suspension preparation and droplet sequencing
Murine aortic and mitral valve leaflets were isolated and pooled from 13 (P7) and 10 (P30) animals, and collected in PBS on ice. Tissues were then digested using digestion buffer a previously described (Hulin et al., 2018). Leaflets were incubated in digestion buffer at 37°C for 3×20 min with gentle rocking. Cell suspensions were filtered using a 35 µm filter and washed with 0.1% BSA in 1× PBS. The concentration of cell suspension was adjusted to 10 cells/µl using a hemocytometer. Droplet sequencing was performed as previously described (Macosko et al., 2015). Dissection and droplet sequencing for each developmental stage were performed on separate days.
Data analysis
The data analysis was performed similarly to a previous report (Magella et al., 2018). Paired-end sequences were tagged for the unique molecular
identifier (UMI) and cell/bead barcode. Reads were aligned to the mm10 mouse genome using Bowtie2 v2.27. Genes that successfully aligned to an exon were tagged with the corresponding gene name. Reads were sorted by the cell barcode and UMIs for each gene were counted. A digital expression matrix of raw reads for each gene was created from the selected cells. A QC step consisted of filtering cells and retaining cells that expressed a minimum of 500 genes. These raw reads were normalized by dividing each gene count by the total number of reads from that cell and multiplying by 10,000, and the matrices from P7 and P30 were merged. The resulting data have been deposited in GEO under accession number GSE117011. To identify and annotate populations of cells from the P30 valve, we performed an unsupervised analysis of the gene-level UMI counts with the algorithm Iterative Clustering and Guide-gene Selection (ICGS) the software AltAnalyze version 2.1.1., which utilizes the pairwise correlation of dynamically expressed genes and iterative clustering with pattern-specific guide genes to delineate coherent gene-expression patterns, was used to predictde novocell populations, as previously described (Olsson et al., 2016). ICGS was performed using the default options for Drop-Seq data (rho>0.3, restrict to protein-genes, at least four cells with a fourfold difference in expression, exclude cell-cycle effects). Gene expression clusters were generated in AltAnalyze using the hierarchical-ordered partitioning and collapsing hybrid (HOPACH) algorithm. Following the initial identification of nine cell clusters, ICGS was re-run with the same options on each of the major heart valve cell population, endothelial, immune and interstitial cells, to identify additional subpopulations. From all ICGS analysis, cell subpopulation restricted genes were identified using MarkerFinder, which generates 60 specific genes for each cell cluster determined by Pearson correlation coefficient. The top 20 correlated genes determined with MarkerFinder with at least a 0.3 Pearson correlation coefficient were selected as the gene signature for each cell cluster. In order to name our immune cell clusters, immune cell gene signatures were compared with the mouse immune cell database Immunological Genome Project (ImmGen). t-SNE plots were generated through AltAnalyze. Gene Ontology terms associated with differentially expressed genes were evaluated using GO-Elite in AltAnalyze. Similarly, genes that were differentially expressed between developmental stages for each cell clusters were determined and analyzed using AltAnalyze by indicating corresponding development origin for each cell prior to analysis (empirical Bayes moderatedt-testP<0.05 and fold>2). Cells were classified as of female or male origin using expression of Xist (female) or five Y chromosome genes, Ddx3y, Eif2s3y, Erdr1,Kdm5dor Ut (male) in the dataset as previously described (Skelly et al., 2018). Female cells express
Xistand no Y chromosome genes, male cells express Y chromosome genes, but notXist, and unspecified cells express neither or both classes of genes. Evaluation of genes showing sexually dimorphic gene expressing was performed using AltAnalyze by indicating corresponding sex origin, and differentially expressed genes were determined using the empirical Bayes moderatedt-test. UMAP plots were generated through AltAnalyze. In heat maps, yellow indicates high relative gene expression, and blue or black indicate low or no gene expression, respectively, of the associated genes (rows).
Histology and immunofluorescence
Murine hearts were harvested at indicated time points. Porcine aortic valve leaflets were isolated from pigs aged from 6 months to 3 years. Human aortic valves from donors with no history of cardiovascular medical conditions were obtained postmortem from the National Disease Research Interchange (NDRI). Human studies were approved by the Institutional Review Boards at Cincinnati Children’s Hospital Medical Center. Hearts and aortic valve leaflets were processed for paraffin wax embedding and sectioned at 5 or 7 µm, as described previously (Hulin et al., 2018). Tissues were fixed in 4% paraformaldehyde (PFA) for 2 h at room temperature or overnight at 4°C, dehydrated through a graded ethanol series, cleared in xylenes and embedded in paraffin wax. For immunofluorescence studies, slides were incubated at 60°C for 1 h and placed in distilled H2O. All slides were treated either with a citric acid antigen retrieval reagent (Vector Laboratories) in a pressure cooker for 5 min or with Proteinase K (Thermo Scientific) for 15 min. For Vcan and Col1a1, the slides were treated for 45 min with
DEVEL
O
0.2 U/ml chondroitinase ABC (Sigma-Aldrich) at 37°C. For Prox1 and Hapln1 staining, slides were pre-treated with 0.025% Triton X-100 in 1× TBS for 10 min. The primary antibodies used were against: Prox1 (Abcam, ab199359; 1:500), Hapln1 (DSHB, 9/30/8-A-4; 1:75), Endomucin (eBioscience, 14-5851-82; 1:250), Vcan (Abcam, ab1033; 1:400), Col1a1 (Abcam, ab34710; 1:25), Dct (Abcam, ab74073; 1:100), pHH3 (Abcam, ab14955; 1:100), Chad (Sigma-Aldrich, HPA018241; 1:100) and Fmod (Kerafast, ENH085; 1:50). DAB staining was performed according to the Ultra-Sensitive mouse or rabbit ABC Peroxidase Staining Kit user guides (32052, 32054, Thermo Fisher Scientific). For fluorescent detection of antibody staining, Alexa Fluor-488-, AlexaFluor-568- and Alexa Fluor-647-conjugated secondary antibodies (Abcam, Life Technologies) were used at 1:200 dilution. Nuclei were counterstained with 4′, 6-diamidino-2-phenylindole, DAPI (Life Technologies, 1:10,000). Movat’s pentachrome staining was performed according to the manufacturer’s protocols (American MasterTech). Images were captured using a Nikon A1-R confocal system with NIS-Elements D 3.2 software. The percentage of cells positive for the specified staining was determined as the number of positively stained cells/total number of nuclei per valve leaflet section determined by DAPI staining. The percentage of areas stained were calculated as the positively stained area/total area of the valve leaflet section using NIS Elements Basic Research software (Nikon). A minimum of four mice per timepoint were analyzed.
Acknowledgements
We thank Andrew Kim and Christina Alfieri for technical assistance. Sequencing was performed by the CCHMC DNA Sequencing Core.
Competing interests
The authors declare no competing or financial interests.
Author contributions
Conceptualization: A.H., K.E.Y.; Methodology: A.H, L.H., M.V.G.-S. A.O., M.A., S.S.P., N.S.; Software: N.S.; Validation: N.S.; Formal analysis: A.H.,L.H., M.V.G.-S., K.C., S.S.P., N.S., K.E.Y.; Investigation: A.H., L.H., M.V.G.-S., A.O., M.A., K.C.; Data curation: K.C., M.A., N.S.; Writing - original draft: A.H., K.E.Y.; Writing - review & editing: A.H., L.H., M.V.G.-S., A.O., P.L., C.O., S.S.P., N.S., K.E.Y.; Visualization: A.H., L.H., M.V.G.-S., A.O.,N.S.; Supervision: N.S., K.E.Y.; Project administration: K.E.Y.; Funding acquisition: K.E.Y.
Funding
Support for this work was provided by grants from the National Institutes of Health (HL094319 and HL143881 to K.E.Y.) and by an American Association of Anatomists Postdoctoral Fellowship Award and Interreg V grant to A.H. Deposited in PMC for release after 12 months.
Data availability
The reported data have been deposited in GEO under accession number GSE117011. AltAnalyze (http://altanalyze.org) is a freely available software.
Supplementary information
Supplementary information available online at
http://dev.biologists.org/lookup/doi/10.1242/dev.173047.supplemental
References
Acharya, A., Baek, S. T., Banfi, S., Eskiocak, B. and Tallquist, M. D.(2011). Efficient inducible Cre-mediated recombination in Tcf21cell lineages in the heart and kidney.Genesis49, 870-877.
Aikawa, E., Whittaker, P., Farber, M., Mendelson, K., Padera, R. F., Aikawa, M. and Schoen, F. J. (2006). Human semilunar cardiac valve remodeling by activated cells from fetus to adult: implications for postnatal adaptation, pathology, and tissue engineering.Circulation113, 1344-1352.
Amofa, D., Hulin, A., Nakada, Y., Sadek, H. A. and Yutzey, K. E.(2017). Hypoxia promotes primitive glycosaminoglycan-rich extracellular matrix composition in developing heart valves.Am. J. Physiol. Heart Circ. Physiol.313, H1143-H1154. Anstine, L. J., Horne, T. E., Horwitz, E. M. and Lincoln, J.(2017). Contribution of extra-cardiac cells in murine heart valves is age-dependent.J. Am. Heart Assoc. 6, e007097.
Balani, K., Brito, F. C., Kos, L. and Agarwal, A.(2009). Melanocyte pigmentation stiffens murine cardiac tricuspid valve leaflet.J. R. Soc. Interface6, 1097-1102. Blancas, A. A., Balaoing, L. R., Acosta, F. M. and Grande-Allen, K. J.(2016).
Identifying behavioral phenotypes and heterogeneity in heart valve surface endothelium.Cells. Tissues. Organs201, 268-276.
Cheek, J. D., Wirrig, E. E., Alfieri, C. M., James, J. F. and Yutzey, K. E.(2012). Differential activation of valvulogenic, chondrogenic, and osteogenic pathways in mouse models of myxomatous and calcific aortic valve disease.J. Mol. Cell. Cardiol.52, 689-700.
Dikhoff, M. J., ter Weeme, M., Vonk, A. B. A., Kupreishvili, K., Blom, A. M., Krijnen, P. A. J., Stooker, W. and Niessen, H. W. M.(2015). C4b-binding protein deposition is induced in diseased aortic heart valves, coinciding with C3d.J. Heart Valve Dis.24, 451-456.
Fu, X., Khalil, H., Kanisicak, O., Boyer, J. G., Vagnozzi, R. J., Maliken, B. D., Sargent, M. A., Prasad, V., Valiente-Alandi, I., Blaxall, B. C. et al.(2018). Specialized fibroblast differentiated states underlie scar formation in the infarcted mouse heart.J. Clin. Invest.128, 2127-2143.
Goddard, L. M., Duchemin, A.-L., Ramalingan, H., Wu, B., Chen, M., Bamezai, S., Yang, J., Li, L., Morley, M. P., Wang, T. et al.(2017). Hemodynamic forces sculpt developing heart valves through a KLF2-WNT9B paracrine signaling axis. Dev. Cell43, 274-289.e5.
Gomez-Stallons, M. V., Wirrig-Schwendeman, E. E., Hassel, K. R., Conway, S. J. and Yutzey, K. E.(2016). BMP signaling is required for aortic valve calcification.Arterioscler. Thromb Vasc Biol.36, 1398-1405.
Hinton, R. B., Lincoln, J., Deutsch, G. H., Osinska, H., Manning, P. B., Benson, D. W. and Yutzey, K. E.(2006). Extracellular matrix remodeling and organization in developing and diseased aortic valves.Circ. Res.98, 1431-1438.
Hulin, A., Moore, V., James, J. M. and Yutzey, K. E.(2017). Loss of Axin2 results in impaired heart valve maturation and subsequentmyxomatous valve disease. Cardiovasc. Res.113, 40-51.
Hulin, A., Anstine, L. J., Kim, A. J., Potter, S. J., DeFalco, T., Lincoln, J. and Yutzey, K. E.(2018). Macrophage transitions in heart valve development and myxomatous valve disease.Arterioscler. Thromb. Vasc. Biol.38, 636-644. Levay, A. K., Peacock, J. D., Lu, Y., Koch, M., Hinton, R. B., Kadler, K. E. and
Lincoln, J. (2008). Scleraxis is required for cell lineage differentiation and extracellular matrix remodeling during murine heart valve formation in vivo.Circ. Res.103, 948-956.
Lincoln, J., Kist, R., Scherer, G. and Yutzey, K. E.(2007). Sox9 is required for precursor cell expansion and extracellular matrix oragnization during mouse heart valve development.Dev. Biol.2007, 120-132.
Liu, A. C., Joag, V. R. and Gotlieb, A. I.(2007). The emerging role of valve interstitial cell phenotypes in regulating heart valve pathobiology.Am. J. Pathol. 171, 1407-1418.
Lockhart, M. M., Boukens, B. J. D., Phelps, A. L., Brown, C.-L. M., Toomer, K. A., Burns, T. A., Mukherjee, R. D., Norris, R. A., Trusk, T. C., van den Hoff, M. J. B. et al.(2014). Alk3 mediated Bmp signaling controls the contribution of epicardially derived cells to the tissues of the atrioventricular junction.Dev. Biol. 396, 8-18.
Macosko, E. Z., Basu, A., Satija, R., Nemesh, J., Shekhar, K., Goldman, M., Tirosh, I., Bialas, A. R., Kamitaki, N., Martersteck, E. M. et al.(2015). Highly parallel genome-wide expression profiling of individual cells using nanoliter droplets.Cell161, 1202-1214.
Magella, B., Adam, M., Potter, A. S., Venkatasubramanian, M., Chetal, K., Hay, S. B., Salomonis, N. and Potter, S. S.(2018). Cross-platform single cell analysis of kidney development shows stromal cells express Gdnf.Dev. Biol. 434, 36-47.
Mjaatvedt, C. H., Kern, C. B., Norris, R. A., Fairey, S. and Cave, C. L.(2005). Normal distribution of melanocytes in the mouse heart.Anat. Rec. A. Discov. Mol. Cell. Evol. Biol.285, 748-757.
Nordquist, E., LaHaye, S., Nagel, C. and Lincoln, J.(2018). Postnatal and adult aortic heart valves have distinctive transcriptional profiles associated with valve tissue growth and maintenance respectively.Front. Cardiovasc. Med.5, 30. Olsson, A., Venkatasubramanian, M., Chaudhri, V. K., Aronow, B. J.,
Salomonis, N., Singh, H. and Grimes, H. L.(2016). Single-cell analysis of mixed-lineage states leading to a binary cell fate choice.Nature537, 698-702. Padang, R., Bagnall, R. D., Tsoutsman, T., Bannon, P. G. and Semsarian, C. (2015). Comparative transcriptome profiling in human bicuspid aortic valve disease using RNA sequencing.Physiol. Genomics47, 75-87.
Salomonis, N., Nelson, B., Vranizan, K., Pico, A. R., Hanspers, K., Kuchinsky, A., Ta, L., Mercola, M. and Conklin, B. R.(2009). Alternative splicing in the differentiation of human embryonic stem cells into cardiac precursors.PLoS Comput. Biol.5, e1000553.
Schlotter, F., Halu, A., Goto, S., Blaser, M. C., Body, S. C., Lee, L. H., Higashi, H., DeLaughter, D. M., Hutcheson, J. D., Vyas, P. et al.(2018). Spatiotemporal multi-omics mapping generates a molecular atlas of the aortic valve and reveals networks driving disease.Circulation138, 377-393.
Simmons, C. A., Grant, G. R., Manduchi, E. and Davies, P. F.(2005). Spatial heterogeneity of endothelial phenotypes correlates with side-specific vulnerability to calcification in normal porcine aortic valves.Circ. Res.96, 792-799. Skelly, D., Squiers, G., McLellan, M., Bolisetty, M., Robson, P., Rosenthal, N.
and Pinto, A.(2018). Single-cell transcriptional profiling reveals cellular diversity and intercommunication in the mouse heart.Cell Rep.22, 600-610.
Snider, P., Hinton, R. B., Morenow-Rodriguez, R. A., Wang, J., Rogers, R., Lindsley, A., Li, F., Ingram, D. A., Menick, D., Field, L. et al.(2008). Periostin is
DEVEL
O
required for maturation and extracellular matrix stabilization of noncardiomyocyte lineages of the heart.Circ. Res.102, 752-760.
Thubrikar, M., Piepgrass, W., Deck, D. and Stanton, P.(1980). Stresses of natural versus prosthetic aortic valve leaflets in vivo.Ann. Thorac. Surg.30, 230-239.
Visconti, R. P., Ebihara, Y., LaRue, A. C., Fleming, P. A., McQuinn, T. C., Masuya, M., Minamiguchi, H., Markwald, R. R., Ogawa, M. and Drake, C. J. (2006). An in vivo analysis of hematopoietic stem cell potential: hematopoietic origin of cardiac valve interstitial cells.Circ. Res.98, 690-696.