BIROn - Birkbeck Institutional Research Online
Nuthmann, A. and Smith, Tim J. and Engbert, R. and Henderson, J.M.
(2010) CRISP: a computational model of fixation durations in scene viewing.
Psychological Review 117 (2), pp. 382-405. ISSN 0033-295X.
Downloaded from:
Usage Guidelines:
Please refer to usage guidelines at or alternatively
CRISP: A Computational Model of Fixation Durations in Scene Viewing
Antje Nuthmann (1), Tim J. Smith (1), Ralf Engbert (2), John M. Henderson (1)
(1) University of Edinburgh, UK
(2) University of Potsdam, Germany
Running Head: Modeling Fixation Durations in Scenes
Keywords: computational modeling; eye movements; naturalistic scenes; fixation
durations; onset delay
Corresponding Author:
Antje Nuthmann
University of Edinburgh
Psychology Department
7 George Square
Edinburgh, EH8 9JZ, UK
E-Mail: [email protected]
Abstract
Eye-movement control during scene viewing can be represented as a series of
individual decisions about where and when to move the eyes. While substantial
behavioral and computational research has been devoted to investigating the placement of
fixations in scenes, relatively little is known about the mechanisms that control fixation
durations. Here we propose a computational model (CRISP) that accounts for saccade
timing and programming and thus for variations in fixation durations in scene viewing.
First, timing signals are modeled as continuous-time random walks. Second, difficulties
at the level of visual and cognitive processing can inhibit and thus modulate saccade
timing. Inhibition generates moment-by-moment changes in the random walk’s transition
rate and processing-related saccade cancellation. Third, saccade programming is
completed in two stages: an initial, labile stage that is subject to cancellation, and a
subsequent, non-labile stage. Several simulation studies tested the model’s adequacy and
generality. An initial simulation study explored the role of cognitive factors in scene
viewing by examining how fixation durations differ under different viewing task
instructions. Additional simulations investigated the degree to which fixation durations
are under direct moment-to-moment control of the current visual scene. The present work
further supports the conclusion that fixation durations, to a certain degree, reflect
perceptual and cognitive activity in scene viewing. Computational model simulations
contribute to our understanding of the underlying processes of gaze control.
Introduction
Looking at a scene typically involves active visual sampling, with observers
moving their eyes approximately three times each second via saccadic eye movements
(Buswell, 1935; Yarbus, 1967; for recent reviews see Henderson, 2003; Henderson, 2007;
Rayner, 1998, 2009b). Two important aspects of gaze control during scene perception are
where fixations are directed (fixation position), and how long they typically remain in a
given location (fixation duration). Current computational models of gaze control in
scenes exclusively consider the “where” decision; they predict fixation locations but do
not account for fixation durations (see Henderson, 2003; Rayner, 2009b). Furthermore,
current models do not attempt to explain the mechanisms underlying saccade
programming and thus ignore the restrictions that arise from the operation of the
oculomotor system. The present paper begins to address this shortcoming by introducing
a timer (C)ontrolled (R)andom-walk with (I)nhibition for (S)accade (P)lanning model.
CRISP is a theoretical approach and a computational model that, based on minimal
assumptions, accounts for variations in fixation durations during scene viewing.
Where viewers fixate in a scene is an overt behavioral manifestation of selective
attention. Therefore, most studies of attention allocation during scene viewing focus on
explaining the processes that determine fixation location rather than fixation duration
(e.g., Baddeley & Tatler, 2006; Henderson, Malcolm, & Schandl, 2009; Itti & Koch,
2000; Parkhurst & Niebur, 2003; Reinagel & Zador, 1999; Tatler, Baddeley, & Vincent,
2006; Torralba, Oliva, Castelhano, & Henderson, 2006; Underwood & Foulsham, 2006).
Theoretical models of visual attention allocation can be contrasted as primarily bottom-up
2003; Henderson, Brockmole, Castelhano, & Mack, 2007, for discussion). The dominant
view in the computational vision literature has been the visual saliency hypothesis
according to which bottom-up stimulus-based information generated from the image
drives the allocation of visual attention and thus the placement of fixations in a scene
(e.g., Itti & Koch, 2000, 2001; Itti, Koch, & Niebur, 1998). A model combining both
bottom-up and top-down information is the Contextual Guidance model for object search
in real-world scenes (Torralba et al., 2006). In this model, fixation selection is driven
from a bottom-up salience computation modulated by contextual priors or task
constraints. More recent proposals have suggested that top-down guidance plays the
primary role in eye guidance and replace the concept of salience with an unprioritized
input representation (Henderson et al., 2007; Henderson et al., 2009).
When people inspect a scene, they not only generate considerable variability in
fixation locations but also in fixation durations. The average fixation duration during
scene viewing is about 300 ms, but there is substantial variability around this mean both
within an individual and across individuals (Castelhano & Henderson, 2008; Henderson
& Hollingworth, 1998; Rayner, 1998, 2009b) (see also Figure 3). In the literature on
human gaze control, the influence of visual and cognitive factors on fixation duration is
widely acknowledged. In reading, such relationships have been extensively investigated
over the past 30 years and are now explicitly incorporated within computational models
of eye-movement control (e.g., Engbert, Nuthmann, Richter, & Kliegl, 2005; Reichle,
Rayner, & Pollatsek, 2003). Fixation durations in reading are influenced by low-level
nonlinguistic factors (e.g., word length, within-word fixation position) but also by various
fixation durations are shorter on words that are highly predictable from the context of the
narrative (e.g., Balota, Pollatsek, & Rayner, 1985).
In the scene perception literature, however, the relationship between fixation
durations and visual-perceptual and cognitive influences is less well established. A
compelling demonstration of top-down influences on eye movements in scene viewing
originates from task effects. While early studies highlighted the role of viewing task on
the choice of fixation locations (Buswell, 1935; Yarbus, 1967), recent studies have also
considered task effects (such as searching for an object in the scene or memorizing the
scene) on fixation durations. Individual fixation durations (i.e., the duration of each
discrete fixation) are typically found to be shorter during visual search than memorization
(Henderson, Weeks, & Hollingworth, 1999; Võ & Henderson, 2009; but see Castelhano,
Mack, & Henderson, 2009). Furthermore, there is some evidence that factors associated
with the currently fixated scene region affect fixation duration. Specifically, fixation
durations are sensitive to global image degradation. For example, reducing the luminance
of a scene leads to increased fixation duration (Loftus, 1985; Loftus, Kaufman,
Nishimoto, & Ruthruff, 1992). Mannan, Ruddock, and Wooding (1995) showed that
low-pass filtered images produce longer fixation durations than either high-low-pass or unfiltered
images. First-pass gaze durations1 are also influenced by object and scene semantics, with
longer gaze durations on semantically informative (i.e., less consistent) than
uninformative (i.e., more consistent) objects (De Graef, Christiaens, & D'Ydewalle, 1990;
Friedman, 1979; Henderson et al., 1999; Hollingworth, Williams, & Henderson, 2001;
Loftus & Mackworth, 1978; Underwood & Foulsham, 2006; Võ & Henderson, 2009).
than the sum of durations) on an object or a region in a scene is less clear (see Henderson
& Hollingworth, 1998, for discussion). In sum, there is preliminary evidence that some of
the observed variability in individual fixation durations is controlled by visual and
cognitive factors associated with the currently fixated scene region. We will term this
evidence for direct control.
A powerful paradigm for testing whether fixation duration is under direct control
of the current stimulus is the stimulus onset delay paradigm. During the saccade prior to a
pre-specified critical fixation, the stimulus (e.g., a text, a scene, or a visual search
display) is removed from view. Following a manipulated delay period, the stimulus
reappears. If fixation durations are directly controlled by the current visual input, then the
critical fixation durations should systematically increase with the delay. A now classic
study applied the stimulus onset delay paradigm to text reading (Morrison, 1984; see also
Rayner & Pollatsek, 1981). Fixation durations showed as two populations. One
population indeed increased with stimulus onset delay, indicating that fixation duration is
under direct control. There was, however, a second population of fixations that ended
while the mask was still present, suggesting that their preparation already started on the
previous fixation. Morrison (1984) interpreted the results in terms of partially parallel
saccade programming. This notion is part of Morrison’s qualitative model of
eye-movement control in reading where sequential shifts of attention from one word to the
next form the link between word recognition and eye-movement control. The sequential
attention shift model underwent several modifications and extensions (e.g., Henderson &
Ferreira, 1990), which culminated in the development of the E-Z Reader model as the
Pollatsek, Fisher, & Rayner, 1998; Reichle et al., 2003).
Recently, a series of experiments utilized the stimulus onset delay paradigm to
investigate the control of individual fixation durations in scene viewing (Henderson &
Pierce, 2008; Henderson & Smith, 2009; see also Shioiri, 1993; van Diepen, Wampers, &
d'Ydewalle, 1998). In the scene onset delay (SOD) paradigm, participants examine
photographs of real-world scenes while engaged in a viewing task (e.g., scene
memorization, visual search). During the saccade just prior to a pre-specified critical
fixation, the entire scene is replaced with a mask, which delays the onset of the scene.
Following the delay period, which is variable in time, the scene reappears. If there is
direct control of the critical fixation duration, one would expect programming of the eye
movement to be delayed until there is scene information present on which to base the
programming. The results from these experiments consistently demonstrate that fixation
durations in scene viewing comprise two fixation populations. One population increases
with scene onset delay, whereas the second population remains relatively constant across
delays. The qualitative pattern of results is consistent with the results from studies of
reading. The scene onset delay studies have allowed different theoretical ideas about the
control of fixation durations during scene viewing to be contrasted (Henderson & Pierce,
2008; Henderson & Smith, 2009).
Present Work
The aim of the present work was to develop a theoretical framework and a
computational model that accounts for variations in fixation durations in scene viewing.
We first introduce the basic architecture of the CRISP model. This is followed by
by three further simulation studies. In particular, model assumptions are tested using data
from (1) a viewing task manipulation, (2) a scene onset delay paradigm, and (3) a mask
onset delay paradigm. We note that the model, in its current implementation, does not
perform an analysis of scene content. Although this is a limitation, the key point of the
paper is to provide a general computational framework for exploring the extent to which
fixation durations are under perceptual and cognitive control during scene viewing. We
will demonstrate that investigating global effects of viewing task and/or effects of global
scene processing difficulty on the control of fixation duration is a suitable starting point
for this endeavor.
Basic Model Architecture
The present work is motivated by the idea that eye movements in scene perception
represent a special case of a more general theory of eye movements and action. In
particular, our modeling efforts draw inspiration from a group of models of
eye-movement control sharing certain core assumptions on saccade timing (Engbert et al.,
2005; Findlay & Walker, 1999; Yang & McConkie, 2001). Findlay and Walker (1999)
proposed a very general qualitative model of saccade generation, based on parallel
processing in “when” and “where” streams and inhibition. The model is built on the
neurophysiologically motivated assumption of two separate pathways concerned with the
spatial (“where”) and the temporal (“when”) programming of eye movements. Findlay
and Walker proposed that the timing of saccade initiation is determined mainly by the
“conflict resolution” competitive push-pull interaction between a fixation centre and a
move centre. In their Competition-Inhibition Theory, Yang & McConkie (2001) extended
observed in reading (see Yang, 2006, for an implementation). The SWIFT model of
saccade generation (Engbert, Longtin, & Kliegl, 2002; Engbert et al., 2005) represents a
dynamical systems approach to eye-movement control in reading. For the “when”
decisions, SWIFT postulates a random saccade timer, which can be modulated by the
cognitive load imposed by foveal visual and lexical processing.2
Here, we propose and implement a random-walk process with inhibition plus
two-stage saccade programming model to account for fixation durations in scene viewing.
First, a random walk process generates inter-saccadic intervals and thus variations in
fixation durations. Second, we assume that difficulties in moment-by-moment visual and
cognitive processing immediately inhibit (i.e., delay) saccade initiation, essentially
leading to longer fixation durations. The random-walk architecture of the saccade timer
allows for a continuous crosstalk between saccade preparation and visual-cognitive
processing. Third, saccade programming is completed in two stages: an initial, labile
stage that is subject to cancellation, and an ensuing, non-labile stage (Becker & Jürgens,
1979; Reichle et al., 1998). In the following, these three modeling principles will be
discussed in detail.
Rhythmic Timing
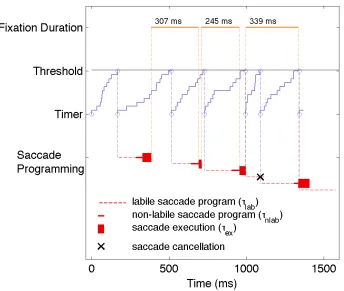
In the CRISP model, a rhythmic saccade timer generates variations in fixation
durations (Figure 1). The underlying intuition is that we initiate saccade programs
according to some preferred mean rate (Engbert et al., 2002; Engbert et al., 2005). There
is growing support for the concept that the control of motor activity by the central
nervous system may be autonomous (Engbert & Kliegl, 2001) or rhythmic in nature (see
is concerned, in a study by McAuley et al. (1999) anticipatory eye movements were
generated by having participants track an intermittently obscured sinusoidally moving
target. The results suggest that rhythmic activity originating in the central nervous system
may modulate human eye movements.
---
Insert Figure 1 about here
---
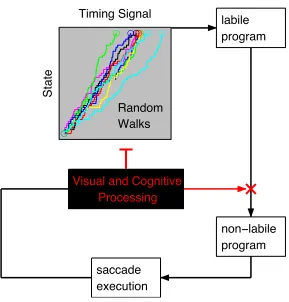
In CRISP, the saccade timer is implemented as a random walk process. This basic
idea is shared by a group of information accumulator models. These models come in
many different flavors and have a long and successful history in accounting for data in
simple manual or saccadic decision tasks (see Smith & Ratcliff, 2004, for a review and
taxonomy). Note that, in our model, the random walk process controls the generation of
intervals between two decisions to start the programming of new saccades, not saccade
execution.3 The random walk timing signal accumulates towards a positive response
boundary (i.e., a threshold). Once the threshold is reached, a new saccade program is
initiated (see below). The random walk timing signal creates a trajectory over time, which
can be modulated at any point by visual-cognitive events (Figure 1). As a consequence,
inhibitory influences from the visual-cognitive module will delay the point in time when
the threshold is reached and a new saccade program is triggered. The threshold is
constant and the variability in timing signals arises from randomness in the rate of growth
of the accumulator (cf., Carpenter & Williams, 1995; Ratcliff & Rouder, 1998). There is
neurophysiological evidence in favor of such a fixed-threshold, variable-growth
(Hanes & Schall, 1996).
Implementation of the Random Walk Process
In CRISP, saccade timing is implemented as a discrete-state continuous-time
random walk process with exponentially distributed waiting times between elementary
transitions. The main parameter is the transition rate for the random walk’s increments
(i.e., the elementary jumps toward threshold), which is modulated by visual-cognitive
processing (Figure 1) and determines how fast the process of saccade timing operates.
We define the transition rate r1 as
€
r1= N tsac
, (1)
where N is the number of states the process can adopt, and tsac is the mean duration of the
timing signal. We assume that the transition probability from the current state to the next
state depends on the past only through the current state, so that the random walk
introduced here falls into the broad category of Markov processes (Gardiner, 2004). As
an efficient method for the numerical simulation of Markov processes we use the minimal
process method (Gillespie, 1976, 1978), which represents an exact simulation procedure.
This algorithm has been applied to theoretical models in areas as diverse as physiology
(Fricke & Schnakenberg, 1991), molecular biology (Elowitz & Leibler, 2000), and
reading (Engbert & Kliegl, 2003). Let us consider a system in state Sm, having arrived
there at time t, which performs the next step to an adjoined state Sn at time
€
t+τ. The
waiting time τ is defined as the time interval to the next transition. For a Markov process
with N adjoined states to the current state Sm, the probability distribution ρ(τ) of the
€
ρ(τ)=Wme−Wmt with
€
Wm = Wnm
n≠m
∑
, (2)where Wm is the total transition probability, i.e., the sum of transition probabilities Wnm to
all adjoining states Sn (i.e., all states to which the process can make a transition). The
random walk process implemented here is a one-step process with a single possible
transition
€
mm+1 from a given state Sm to its adjoined state Sm+1. In this case, all
components of the matrix of transition probabilities Wnm are zero except for Wm+1,m = r1,
i.e., Wn = Wm+1,m = r1. The mean waiting time in a given state Sm is given by the inverse of
the total transition probability, i.e.,
€
τ = 1 Wm
= 1
w0
(3)
Since the waiting time is an exponentially distributed variable, it can be transformed from
a uniformly distributed random number by
€
τ =− 1 w0
log(1−r), (4)
where r is a random number with equal probability in 0 ≤ r < 1 (cf., Gillespie, 1978). It is
important to note that the proportion between standard deviation σ1 and mean µ1 of the
saccade timer is monotonically related to the number of states N of the random walk
process by
€
σ1
µ1
= 1
N (5)
Thus, the value of N, i.e., the threshold of the random walk process, is a free parameter
for adjusting the noise level of the saccade timer (see Appendix A). A high N leads to
We further assume that processing difficulty can inhibit and thus modulate
saccade timing and programming. According to the model architecture, the
visual-cognitive processing module can (1) inhibit the random walk’s transition rate and/or (2)
cancel labile saccade programs (inhibitory elements are marked in red in Figure 1).
Conceptualizing the timer as a random walk process allows for a continuous crosstalk
between visual-cognitive processing and saccade timing: The random walk creates a
trajectory over time, which can be modulated at any point by visual-cognitive events.
Generally put, as processing demands increase the processing speed decreases, which will
slow down the random walk saccade timer. Intuitively, greater processing difficulty
increases the time needed to reach the completion threshold. This delays the initiation of
a new saccade program, and eventually leads to longer fixation durations.
Two-Stage Saccade Programming
Once the implemented random walk process reaches threshold, a new saccade
program is initiated. We assume that saccade programming is completed in two stages: an
initial, labile stage that is subject to cancellation, and an ensuing, non-labile stage in
which the program can no longer be cancelled (Becker & Jürgens, 1979; adopted by
Reichle et al., 1998; Findlay & Walker, 1999; Engbert et al., 2005). Evidence for these
mechanisms is provided by a series of experiments by Becker and Jürgens (1979) who
used a much simpler situation than scene viewing. In the double step paradigm a target
makes two successive movements in a quick sequence. Participants are asked to follow
the target with their eyes. The paradigm allows investigation of how saccade initiation is
controlled and how saccade targets are selected by measuring the effects of the second
variable is the time D elapsing between the initial saccade and the second target step.
Participants’ performance is stochastic and, depending on D, shows three principal
outcomes. First, if D is short (i.e., when the two shifts of the target are close to one
another in time), participants make only one eye movement to the second, final location
of the target. Here, the oculomotor system begins programming a saccade to the second
target location while the saccade program related to the first target location is still in its
labile stage of development. In such a case, the first program is cancelled and only the
second program is executed. Second, when D is long (i.e., when the two steps are
relatively far apart in time) participants make two saccades. The first saccade is directed
to the first shifted target location and the second to the second shifted location, with the
first of these fixations being relatively short (about 50 ms). Here, the second saccade
program is initiated while the first program is already in its non-labile stage and can no
longer be altered. In such a case, both saccades will be executed, which typically results
in a short fixation between the two saccades. Third, an intermediate range of D values
(i.e., if the time between the two shifts of the target were intermediate) results in
compromise saccades with endpoints landing between the two positions occupied by the
target. Becker and Jürgens (1979) proposed that double step saccade performance could
be understood as the outcome of a race between the processes producing saccades to the
initial and final target locations (see Camalier et al., 2007, for an implementation of such
a race model, and Ludwig, Mildinhall, & Gilchrist, 2007, for an alternative stochastic
accumulator model).
Using a saccade stop-signal task, recent work has examined the neural basis of
the frontal eye field and superior colliculus show different activation when saccades are
executed versus cancelled, and these differences in activation occur within the time that
the saccade is cancelled (Hanes, Patterson, & Schall, 1998; Paré & Hanes, 2003). During
saccade preparation, neurons with movement-related activity begin to increase toward a
saccade execution trigger threshold. When partially prepared saccades are cancelled,
these neurons fail to reach the threshold activation level. Instead, the saccade-related
activity decreases rapidly after the stop signal is presented.
In sum, existing research suggests that saccade programming is completed in
different stages and that saccade programs can partly overlap in time (see also Findlay,
Brown, & Gilchrist, 2001; McPeek, Skavenski, & Nakayama, 2000; Walker & McSorley,
2006). CRISP incorporates these principles (see also Engbert et al., 2005; Findlay &
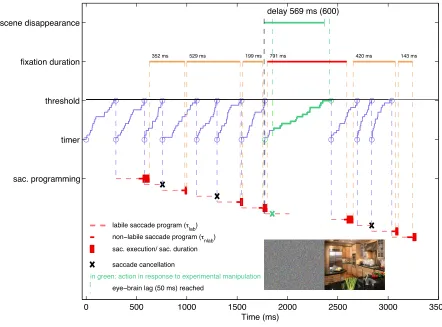
Walker, 1999; Reichle et al., 1998). Figure 2 visualizes how random walk timing and the
saccade-programming module work together. Once the random walk process reaches
threshold, a new saccade program is initiated. It enters a preliminary labile stage with an
average duration τlab. If another saccade program is initiated during the labile stage, the
first program will be cancelled and only the second program will be executed. Thus, the
new labile saccade program will always override an old one, if there is one (see Figure 2
for an example). At the end of the labile stage, a point of no return is reached and the
saccade can no longer be cancelled – the program is now non-labile (average duration
τnlab). Consequently, if a second program is initiated during the non-labile stage of the
first one, both will be executed. At the end of the non-labile saccade programming stage,
the saccade is executed (average duration τex).
Insert Figure 2 about here
---
Generation of Fixation Durations
When viewing a scene, our eyes alternate between fixations and saccades.
Saccade latency is defined as the time needed to program an eye movement. In the model,
we derive saccade latency lsac as the sum of the implemented saccade programming
stages, i.e.,
lsac = τlab + τnlab, (6)
where τlab and τnlab denote the average duration of the labile and non-labile phase,
respectively. Fixation durations are the time intervals between successive saccades
(excluding saccade execution). In the model, a random walk process delivers the time
intervals between two subsequent decisions to initiate a new saccade program and thus
influences fixation durations. Figure 2 visualizes the interplay of the different timelines of
saccade timing and programming for a string of saccades realized by the model. We
highlight two relations: First, due to the autonomous nature of the random walk timing
signal, fixation duration does not equate to saccade latency. Second, the time interval
between two commands to initiate a saccade program does not translate directly into
fixation duration. However, the relationship between the duration covered by the random
walk timing signal (see Eq. 1), saccade latency (Eq. 6) and fixation duration is such that
increasing the mean duration of the timing signal (tsac) will also lead to prolonged fixation
In the next section, we will further elaborate on how the model architecture obeys
the restrictions arising from our knowledge about the timeline of saccade programming
and information processing.
On the Timeline of Information Processing
Our working assumption is that fixation durations at least partly reflect
moment-to-moment cognitive processes during scene viewing. Mean fixation durations in scene
viewing approach 300 ms. It takes roughly 50-60 ms for information about the fixated
element to travel from the retina to higher cortical areas (McConkie, 1983). This
eye-brain lag and the minimum latency of saccadic eye movements place constraints on the
direct-control assumption. Mean estimates for the minimum saccade latency range
between 175-250 ms (e.g., Salthouse & Ellis, 1980); a lower boundary of 150-175 ms has
been reported for instances where uncertainty about when or where to move the eyes was
eliminated (Rayner, Slowiaczek, Clifton, & Bertera, 1983). If we accept the assumption
that results from simple visual tasks used in these studies generalize to dynamic tasks like
scene viewing, search, or reading, the decision to initiate a new saccade program must be
made sufficiently early in the fixation (e.g., Reichle et al., 1998, for reading). In sum, we
are left with a very narrow time window during which a sufficient degree of processing of
scene elements must be achieved. As an alternative, and this is the approach we adopt
here, one could make the case for a somewhat weaker coupling between eye-movement
programming and processing of the currently fixated object (e.g., Engbert et al., 2005, for
reading). Specifically, the initiation of saccade programs is not intimately tied to a narrow
time window within the current fixation. Rather, saccade programs can also be initiated
speaking, this proposition is the logical consequence of the hypothesis that the last
stimulus information that can influence the programming of the next saccades must occur
at least 150 ms (i.e., the minimal saccade latency) before the end of the current fixation.
Such a hypothesis implies that fixations shorter than 150 ms reflect instances of saccadic
programming beginning before the processing of information from the current fixation
(Morrison, 1984; Shioiri, 1993).
Short vs. Long Fixation Durations
Short duration fixations commonly occur in reading (Radach, Heller, & Inhoff,
1999), scanning and visual search (Findlay et al., 2001; McPeek et al., 2000), and scene
perception (Henderson & Pierce, 2008; Henderson & Smith, 2009). Generally, the
functional role of brief fixations is poorly understood (e.g., Inhoff & Radach, 1998). Our
assumption of rhythmic timing and stochasticity in saccade programming suggests that
saccades of different latencies and/or fixations across the whole range of durations
principally share the same preparatory processes. In empirical research on eye-movement
control in visual-cognitive tasks, fixation durations shorter than around 80 ms are
frequently discarded from data analysis (see Inhoff & Radach, 1998, for a discussion of
cutoff values). The rationale here is that these fixation durations are too short to be
controlled by the visual stimulus. Saccades with a latency below 80 ms are commonly
classified as anticipatory saccades, i.e., expectancy-driven movements prepared in
advanced and executed shortly after target onset. The fastest visually guided saccades,
often labeled express saccades, have a latency of around 100 ms (see Fischer & Weber,
1993, for a debate about the properties and significance of express saccades). The
basic oculomotor studies employing some form of a target-elicited saccade paradigm. In a
typical experiment, the participant is asked to make a saccadic orienting movement to a
target that appears in some location in the peripheral visual field. An extensively studied
version of this type of experiment is the gap paradigm where a temporal gap separates the
offset of the central fixation point from the onset of the eccentric target (e.g., Kalesnykas
& Hallett, 1987). These paradigms present well-defined tasks with well-defined saccade
targets. In comparison, the location of the target location for the next saccade during
scene viewing is less well-defined because of the large set of potential candidate targets.
In scene viewing, the functional role of anticipatory saccades is thus less clear.
Generalization from standard oculomotor aiming tasks to a dynamic situation like scene
viewing is further complicated by the fact that in the latter, saccade latency does not
necessarily equate to fixation duration because saccade programming may not begin until
some time after fixation onset.
With the modeling approach taken here, we propose that fixations across the
whole range of durations principally share the same preparatory processes. However, they
differ in that fixations with long durations are most likely to reflect instances of direct
control whereas those with short durations are less likely to do so (Henderson & Pierce,
2008; Henderson & Smith, 2009). In the present model, variations in fixation durations
are generated by a continuous-time random walk. Furthermore, the model takes into
account the fact that saccades can be programmed in parallel, i.e., the preparatory
processes of two different saccades can overlap in time (Becker & Jürgens, 1979). As a
consequence of both assumptions, two cases can be distinguished. First, the program for
instances of saccade programming that are based on the processing of visual-cognitive
information from the current fixation. In other words, these are instances of direct
control. Second, the model will also generate instances in which the program for the next
saccade has already been initiated before the start of the current fixation. These are
instances of saccade programming in which visual-cognitive information from the current
fixation has limited or no influence at all (as the random walk’s transition rate is initially
adjusted to the processing difficulty of the region fixated at the previous fixation and/or
saccade programming has already proceeded to the non-labile or execution stage). In
Simulation Study 1, we numerically investigate the prevalence of these two cases and
how they relate to fixation duration. Simulation Study 3 is an in-depth demonstration of
how direct control is realized in the model.
Simulation Studies
Four simulation studies were conducted. The goal of Study 1 was to reproduce the
features of a typical empirical fixation duration distribution observed in scene viewing. A
further goal of this study was to exemplify some features of the basic model architecture
that were of particular relevance for Simulation Studies 3 and 4. Simulation Study 2
explored an important aspect of cognitive control: the global effect of task instruction on
the control of fixation durations in scene viewing. Specifically, we compared two tasks
that are widely used in the literature, a memorization task and a visual search task. In
Simulation Study 3 we focused on the degree to which (and how) fixations in scene
viewing are controlled ‘on line’ by the current visual scene input (Henderson & Pierce,
2008; Henderson & Smith, 2009). Finally, the goal of Simulation Study 4 was to further
mean fixation durations observed in another paradigm (the mask onset delay paradigm)
designed to investigate the accrual of scene information during fixations (Rayner, Smith,
Malcolm, & Henderson, 2009).
Simulation Study 1: The Baseline Model
For the most part, fixation duration analyses in the scene perception literature
occur at the level of the means. However, changes in mean duration (or the lack thereof)
may reflect distinct patterns at the level of underlying distributions. Thus, the primary
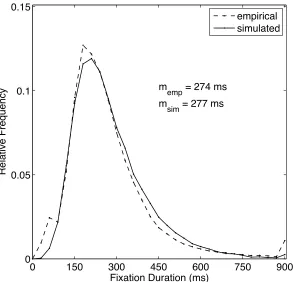
goal of Simulation Study 1 was to go beyond the mean and reproduce a typical empirical
fixation duration distribution observed in scene viewing (Figure 3). The empirical data
came from a new scene onset delay experiment replicating Henderson and Pierce (2008;
Henderson & Smith, 2009; see Simulation Study 3). Twelve participants each viewed 40
photographs of real-world scenes. During critical fixations the scene only appeared after a
manipulated delay. The critical fixations with delays occurred every sixth fixation.
Baseline performance was derived from a control condition where the scene was
presented without a mask (0-ms delay), and these were the data used for the baseline
model simulations.
Based on the basic model architecture outlined above, 12 statistical subjects
viewed 40 arbitrary scenes each. Our goal was to determine whether the model could
capture the global trends in the experimental data (Figure 3). Therefore, for simplicity
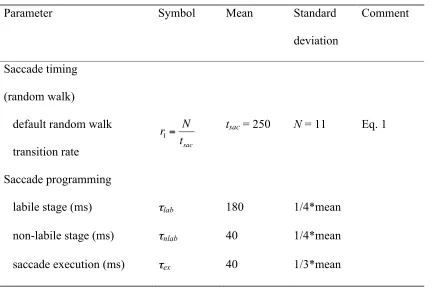
model parameters were fit by eye (Table 1). The mean parameter values were informed
by findings from basic oculomotor research, which ensured their psychological and/or
neurophysiological plausibility. We assume that saccade-programming processes are
the different saccade programming phases (τlab, τnlab, and τex) were drawn from gamma
distributions with means and standard deviations as listed in Table 1 (see Appendix B for
details). The mean time interval between two commands to initiate a saccade program,
tsac, was set to 250 ms. Parameter N, which determines the variance of the timing signal,
was set to 11. The relation between the mean and variance of the timing signal (Eq. 1)
yields a random walk change rate of 0.044. In its implementation, the model generated
sequences of saccades and fixations, and the simulated fixation duration data were
analyzed in the same way as the empirical data. The simulated data captured the overall
trend in the empirical data very well (Figure 3). Specifically, they reproduced the
characteristic positive skew in fixation duration distributions, with the mode lying below
the mean.
---
Insert Figure 3 about here
---
---
Insert Table 1 about here
---
In Simulation Studies 3 and 4 we will utilize saccade cancellation as a mechanism
contributing to prolonged fixation durations. We investigated the groundwork for this
concept first using the baseline model. In particular, we explored how the duration of a
fixation relates to the timing of the saccade program terminating that particular fixation.
In Figure 4a, fixation duration is plotted as a function of the saccade program’s start time
values indicate that the next saccade program was launched during the current fixation
(65% of all cases). Negative time values reflect the instances where saccadic
programming began before the processing of information from the current fixation (35%
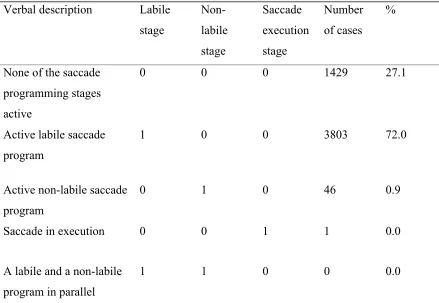
of all cases). Data points are plotted with different symbols, which designate the number
of saccade program cancellations involved. Black circles represent the default of no
saccade program cancellation during the fixation (79%). In 16.5% of all simulated
fixations the corresponding saccade program was cancelled once (red squares), and 3.5%
were cancelled twice (blue diamonds); all other cases are negligible. One cancellation
means that two labile programs were actually involved in generating the fixation
duration, but the second more recent one overrode (cancelled) the first one. Figure 4a
shows the start time of the labile program that was eventually executed (and thus not
cancelled). Saccade cancellation moves the start (time) of the saccade program that
eventually terminates the fixation further into that fixation (Figure 4a and c) and prolongs
fixation duration (Figure 4a and b). The three distributions in Figure 4c are offset by a
value approaching mean saccade latency (Eq. 6, Table 1). As a consequence, the
corresponding fixation duration distributions are shifted in a similar manner (Figure 4b).
(Note that these are relative frequency distributions, and no saccade cancellation is the
default.) Subtracting the saccade program start time t (x value in Figure 4a) from the
fixation duration (y value) yields the saccade latency (cf., Eq. 6). For t = 0, fixation
duration equals saccade latency. Of course, saccade latency distributions do not differ
across the cancellation conditions (inset plot in Figure 4a).
In sum, we observed a strong correlation between the launch time of the next
duration (r = .95, p < .001). Importantly, short fixation durations originated from
instances where the corresponding saccade program was started before the onset of that
particular fixation (Figure 4a). Furthermore, the simulations demonstrate that saccade
cancellation prolongs fixation durations, which accords with empirical findings (e.g.,
processing of letter stings: Vergilino-Perez & Beauvillain, 2004; sentence reading: Yang
& McConkie, 2001).
---
Insert Figure 4 about here
---
Simulation Study 2: Modeling Viewing Task Influences on Fixation Durations in Scene
Viewing
The second simulation study was directed toward exploring, at a global level, the
role of cognitive factors on saccade timing and programming in scene viewing. This
study also addressed a possible concern with the empirical data for the baseline
simulation in Study 1, which were taken from the control condition in the scene onset
delay paradigm. Therefore, another objective of Study 2 was to model data from a natural
viewing task without gaze-contingent manipulations.
In Simulation Study 2, we explored one particular aspect of cognitive control: the
influence of viewing task on the control of fixation durations during scene viewing. Such
task effects on eye-movement control parameters were first highlighted in two classic eye
movement studies (Buswell, 1935; Yarbus, 1967). Though ahead of their time, these
controlled manner. Furthermore, neither of these studies highlighted task differences on
fixation durations. In a study by Võ and Henderson (2009), task instructions were
manipulated across experiments, and average fixation durations were significantly longer
in a memorization experiment than in a visual search experiment (see also Henderson et
al., 1999). In another study, viewing task was manipulated within subjects (Castelhano et
al., 2009). Viewing task did not affect the average duration of individual fixations.
However, longer gaze durations were found on objects in the scenes during memorization
than search. Given the findings from these studies, it is currently not clear whether and
under what conditions task instructions influence measures of fixation time. Therefore,
we set out to reexamine how task instruction influences fixation durations with high
statistical power (36 participants, 45 scenes per viewing task). Furthermore, to control for
stimulus-based sources of input to the gaze control system, we rotated the images across
viewing tasks. If individual fixation durations are sensitive to task instructions, with more
encoding time needed for memorization (Henderson et al., 1999; Võ & Henderson,
2009), then fixation durations should be longer for memorization than for search.
Methods
Thirty-six participants (12 males; mean age = 22.2 yrs) were presented 135 unique
full-color photographs (800 × 600 pixels) of real-world scenes from a variety of scene
categories. Scenes were presented on a 21-inch CRT monitor at a distance of 90 cm for 8
s each. During scene presentation, participants’ eye movements were recorded using an
SR Research EyeLink 1000 eye tracker. Viewing was binocular, but only the right eye
was tracked. The 135 scenes were divided into three blocks of 45 scenes. In each block,
the three tasks were analyzed: Search and Memorization.4 In the Search task participants
were presented with a target word prior to scene presentation and pressed a button as
soon as the object was located in the scene. Only eye movements up to the button press
were included in the analysis. In the Memorization task the participants had to encode the
scene to prepare for an old/new recognition test administered at the end of the
experiment. Eye movements from the full 8 s presentation period were analyzed during
Memorization. Scenes were rotated through task and order across groups of participants.
Behavioral Data
Fixations were excluded if they were preceded by or co-occurred with blinks,
were the first or last fixation in a trial, or had durations less than 50 ms or longer than
1200 ms. In the Search task, participants indicated that they had localized the target after
an average of 3618 ms (SD = 2335 ms). In this period of time, they made on average 12.4
fixations (SD = 8.2). In the Memorization task, participants made on average 24.7
fixations (SD = 4.2) during the 8-s scene presentation time. A paired two-sample t-test
revealed that the mean fixation duration during Memory Encoding (M = 267 ms, SD =
126 ms) was significantly longer than during Search (M = 232 ms, SD = 96 ms; t(35) =
12.0, p < .001). An analysis of ordinal fixation number confirmed that this difference was
present throughout the entire trial, indicating that it was not an artifact of the longer
analysis period in the Memorization task. The influence of viewing task was also evident
in the fixation duration distributions (Figure 5a). For the Memorization task, the modal
portion of the distribution shifted slightly towards longer fixation durations, and the tail
of the distribution increased somewhat.
Insert Figure 5 about here
---
Simulation Data: Model Adjustments
Modeling the effect of task instructions on fixation duration within the context of
CRISP rests on the following basic assumption: The global characteristics of fixation
durations in both viewing tasks can be explained by a single model architecture, with
task-specific influences realized by different parameter settings. According to the model
architecture, the following components contribute toward systematic differences in
fixation durations: (1) the mean (tsac) and variance (i.e., number of states N) of the
random walk timing signal, (2) the mean duration of the labile saccade program (τlab), (3)
the mean duration of the non-labile saccade program (τnlab), and (4) the mean duration of
saccade execution. The stochastic saccade cancellation mechanism constitutes an
additional source of variance in fixation durations. We will now discuss, from a
theoretical and empirical point of view, which model parameters may vary or may be
held constant across viewing tasks. Put another way, do task instructions influence
saccade timing or saccade programming, or both? First, it is reasonable to assume that the
mean and variance of the random walk process underlying the initiation of a new saccade
program can vary across viewing tasks. Specifically, implementing a more conservative
saccade planning strategy (e.g., to ensure sufficient encoding time in a memorization
task) would be captured by the model as a higher mean value for the random walk timing
signal. Furthermore, task instructions could affect saccade-programming parameters, i.e.,
saccade latency (Eq. 6). In standard oculomotor aiming tasks, saccade latency can be
sensitive to various bottom-up processes arising from changes in sensory information in
the visual field (e.g., Kalesnykas & Hallett, 1987). In addition, it has been shown that a
top-down process, arising from specific task instructions, can also affect SRTs (Trottier
& Pratt, 2005). In natural scene viewing, saccade latency cannot be directly measured,
and experimental research needs to establish whether findings from standard oculomotor
aiming tasks generalize to natural scene viewing. For the moment, as a working
hypothesis we assume that the duration of the labile stage of saccade programming is
sensitive to task differences. Finally, the duration of the non-labile stage of saccade
programming (also known as saccadic dead time, SDT) is often assumed to remain
relatively constant (e.g., Van Loon, Hooge, & Van den Berg, 2002). Therefore, for the
simulations reported below the non-labile saccade programming parameter was fixed at
40 ms. Thus, while incorporating some variability in the duration of the non-labile stage
of saccade programming (see Table 2), we assume that the distribution is constant across
viewing tasks, meaning that the non-labile stage will not contribute to systematic
differences in fixation durations. The same is true for saccade execution. Here, the mean
parameter value was estimated from the empirical data: The mean saccade duration
across viewing tasks was 37 ms, with no significant difference between Memory
Encoding and Search (t(35) = 1.39, p = .17).
Modeling Results
Based on these considerations, numerical simulations were run to determine the
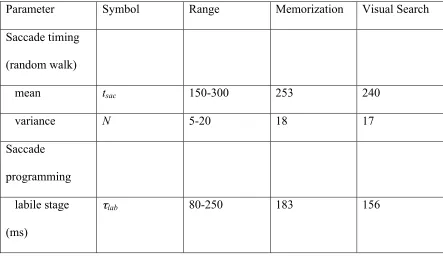
best-fitting values for the three free parameters in the CRISP model. The ranges for the
parameter values (Table 2) were constrained by findings from basic oculomotor research,
parameter estimation, a genetic algorithm (GA) optimization technique was used. The
GA minimized a goodness-of-fit measure, which quantified for a given viewing task how
much the simulated fixation duration distribution and average fixation duration deviated
from the experimentally observed data. The details of the fitting procedure are presented
in Appendix B. The obtained minimal values for the deviation measure, Eq. (B3), were Δ
= 0.30 (Memorization) and Δ = 0.34 (Search). The corresponding best-fitting parameter
values are listed in Table 2. For each viewing task, simulated sequences of fixation
durations were obtained from 36 statistical subjects and 45 arbitrary scenes per subject,
using the best-fitting values for model parameters.
---
Insert Table 2 about here
---
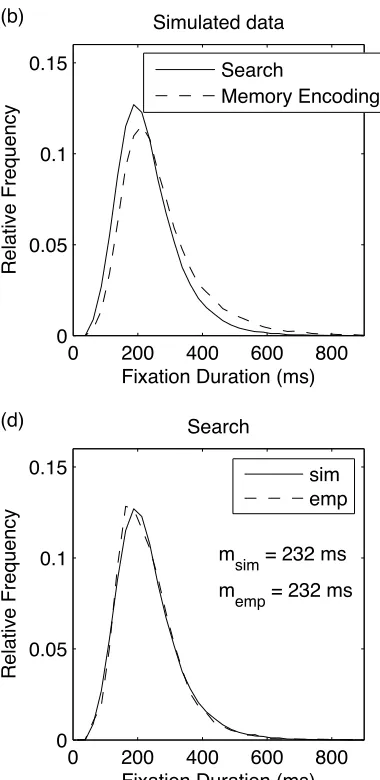
The results of these simulations are summarized in Figure 5. The simulations
precisely reproduced the longer mean fixation durations that were observed in
Memorization versus Search. They also reproduced the characteristic positive skew in
fixation duration distributions, with modal values below the means. Importantly, CRISP
captured the global effect of viewing task on fixation durations well: The Search
distribution exhibits a somewhat earlier mode and a shallower tail than the distribution
for Memory Encoding. On closer inspection, this difference is mainly due to a lower
mean value of the random timer and a shorter labile stage of saccade programming in
Search than Memorization (Table 2). We offer the following psychological interpretation
for the model’s prediction of a shorter labile stage of saccade programming in the search
the nature of the target and its relationship to the scene can be used to constrain the
number of potential target locations competing for selection (Torralba et al., 2006).
Assuming that the decision about where to move the eyes next is made towards the end of
the labile stage (cf., Becker & Jürgens, 1979; Engbert et al., 2005), simplified target
selection would be associated with a shorter labile stage of saccade programming (cf.,
Rayner et al., 1983). Finally, both the absolute range and the shape of the fixation
distribution observed under the memorization instruction in the present study (Figure 5)
are in good agreement with the data presented in Study 1 (Figure 3), supporting the
validity of these data.
To summarize, Study 2 was concerned with the influence of viewing task on the
distribution of fixation durations in scene viewing. We proposed that participants
implement different global parameter settings as they examine scenes under different task
instructions. We showed that viewing task could be captured by CRISP by allowing task
to influence the random walk timer of the saccade generator and the labile stage of
saccade programming.
Simulation Study 3: Modeling Mixed Control of Fixation Durations in the Scene Onset
Delay Paradigm
Simulation Study 3 concerns a question that is at the heart of current research on
fixation durations in scene viewing: Are the decisions about when to move the eyes under
direct moment-to-moment control of the current visual scene? We approached this
complex question by simulating data from an experiment that selectively manipulated
global scene processing difficulty by delaying scene presentation during critical fixations
developed to assess direct control of fixation durations in sentence reading (Morrison,
1984; Rayner & Pollatsek, 1981) and was part of the inspiration for the development of
the E-Z Reader model of eye-movement control in reading (Reichle et al., 1998). The
general principles of the interaction between visual-cognitive processing and saccade
timing represent an open research problem. In the context of this simulation study we
propose and test a small set of simple rules for the modulation of saccade timing and
saccade programming by visual-cognitive processing. The presentation of this study is
organized as follows: We first describe the experiment and provide a short summary of
key findings. We then outline how CRISP was modified for the simulation study. This is
followed by comparing the obtained simulated data with the empirical data. Finally, we
will discuss how the model architecture generates the distinct data pattern observed in the
experiment.
Behavioral Data: The Scene Onset Delay Paradigm
Simulation Study 3 was closely patterned after a variant of the scene onset delay
paradigm. In the behavioral experiment, 12 participants viewed 40 photographs of
real-world scenes in preparation for a later memory test. Every sixth5 saccade was
manipulated in the following way: During the saccade, i.e., periods of visual blindness
(Ross, Morrone, Goldberg, & Burr, 2001), the scene was removed from the monitor and
replaced by a pattern mask. Therefore, when the eyes landed in the critical fixation
following this saccade, the scene was no longer visible. For purposes of analysis and
simulation, the critical fixation was the first fixation following replacement of the scene
with the mask. After a specified amount of time, called the delay, the scene reappeared.
were chosen pseudorandomly for each critical fixation within each scene. In the 0-ms
delay control condition, the scene image was replaced with itself so that phenomenally it
was continuously present but the computer code generating changes in the other
conditions was controlled. The present experiment differed from previously reported
experiments (Henderson & Pierce, 2008; Henderson & Smith, 2009) in that it also
included an infinite delay condition in which the scene only reappeared when participants
moved their eyes to end the critical fixation. Within each scene, delay values were chosen
pseudo-randomly for each critical fixation. For details on the stimuli, procedure, and
implementation see Henderson and Pierce (2008). If the duration of eye fixations was
directly controlled by the current visual input, then fixation durations should
systematically scale with the delay. Simply put, the longer the scene is removed from
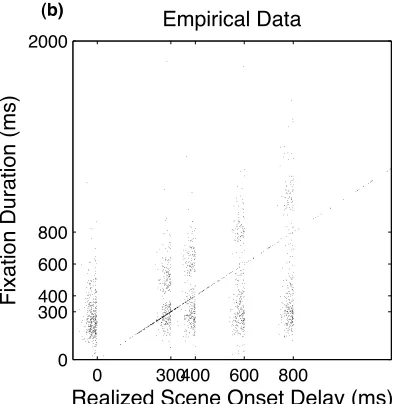
view, the longer the eyes should remain where they are. Figure 6b visualizes the duration
of the critical fixation as a function of the realized scene onset delay. The realized scene
onset delay takes the exact time point of scene disappearance into account; for example,
if the display change was completed 8 ms before the beginning of the critical fixation, the
resulting scene onset delay for a 400 ms delay trial would amount to 400 – 8 = 392 ms. In
Figure 6, the diagonal line represents the ‘infinite delay’ where fixation duration equals
scene onset delay. For the other delay conditions, the empirical data show as two
populations (Figure 6b), suggesting that the underlying distributions are bimodal (Figure
9). First, we observed an “early” population of fixations that terminated during scene
absence. It appears that these fixation durations line up largely independent of the delay
condition. This was confirmed by fitting 2-term Gaussian distributions to the empirical
(slope = 0.05, intercept = 243.89, p > .05; see Henderson & Pierce, 2008). In addition, we
observed a second, “late” population of fixation durations. Here, the fixation duration was
longer than the actual delay, meaning that subjects waited for the scene to re-appear.
These “waited out” durations linearly increased as the delay increased, which was
corroborated by a regression analysis over the second modes of the fitted distributions
(slope = 1.06, intercept = 185.71, p < .01). This latter population of fixations indicates
that fixation durations are, at least partly, influenced by the current visual stimulus.
Together, the two populations of fixation durations are indicative of mixed control
involving both direct and indirect control of fixation durations. The global pattern of
results is consistent with prior results from studies of scene viewing (Henderson &
Pierce, 2008; Henderson & Smith, 2009) and reading (Morrison, 1984; Rayner &
Pollatsek, 1981).
The two populations of fixation durations appear to be separated by a gap, which
is due to saccadic inhibition: The reappearance of the scene creates a motion transient,
which inhibits the generation of saccades (Reingold & Stampe, 2002, 2004). Saccadic
inhibition has been observed in a broad range of eye-movement tasks including simple
saccade programming paradigms (Reingold & Stampe, 2002), reading (e.g., Reingold &
Stampe, 2004), visual search (e.g., Reingold & Stampe, 2004; Stampe & Reingold,
2002), and picture viewing (Graupner, Velichkovsky, Pannasch, & Marx, 2007;
Pannasch, Dornhoefer, Unema, & Velichkovsky, 2001). In addition, it has been observed
as part of the microsaccade-rate signature in various fixation tasks investigating the
allocation of attention (see Rolfs, Kliegl, & Engbert, 2008, for a review). In the
information is briefly presented at random intervals during fixation. Note that the
scenario in our experiment is somewhat different in that the drop in saccadic activity is
observed when we reinstate the scene and thus present useful information. In sum, the
entire pattern of data replicates in essential details the data reported by Henderson and
Pierce (2008) and Henderson and Smith (2009).
---
Insert Figure 6 about here
---
Simulation Data: Model Adjustments
Our simulation efforts set out to qualitatively reproduce the key behavioral
findings. In the implementation, the sequence of events was closely modeled on the
experiment (Figure 7). Every sixth saccade, the scene was removed from view for the
duration of the delay condition (e.g., 600 ms). Variability in the realized scene onset
delay (Figure 6a) was generated based on simulated variations in saccade durations. In
order to capture the specific pattern typically shown in SOD experiments, the CRISP
baseline model was furnished with a few additional assumptions. They reflect our
hypotheses about how the cognitive-oculomotor system might respond to the scene
disappearance and subsequent reappearance. Specifically, we assume that (1) current
processing demands modulate the random walk’s transition rate, and (2) processing
difficulty can lead to saccade cancellation. We discuss the details of these assumptions
next.
First, we assume that processing difficulties can inhibit and thus modulate saccade
quality of the stimulus (i.e., the amount of information that can be extracted from the
stimulus per unit of time) will affect the saccade timer by modulating the statistics of the
random walk. Thus, visual-cognitive processing demands automatically adjust saccade
timing, although saccade timing itself is not coupled to certain stages of cognitive
processing. How plausible is a modulation of the random walk’s transition rate? The
assumption is consistent with neurophysiological findings. For example, varying the
information content of a stimulus (e.g., the signal-to-noise ratio in a motion coherence
stimulus) changes the rate of accumulation in neurons in the lateral intraparietal (LIP)
area (Roitman & Shadlen, 2002). Accordingly, in our implementation, when the scene is
removed from view in the scene onset delay paradigm, the mean random walk transition
rate r1 is considerably reduced. Here, we take an eye-brain lag of 50 ms into account, so
50 ms following scene offset the mean transition rate is reduced from r1 to r0 (Table 3).
Thus, we slow down the random walk process, which delays the initiation of the next
saccade program. Fifty milliseconds after the scene reappears, the rate recovers to its
default value r1 (see Figure 7 for visualization). We assume that information
accumulation drops to a low non-zero value because although perceptual uptake ceases
during the delay, cognitive processes including conceptual analysis and memory
consolidation continue to operate (Potter, 1976). According to the model architecture, no
new saccade program would be launched during scene absence if r0 had a value of 0. The
empirical data suggest that this is not the case. Each discrete time step dt was simulated
according to Eq. (4), with w0 = r1 when the scene was visible, and w0 = r0 if the scene was
removed from view. This adds a new free parameter to the model, i.e., the fraction r0/ r1
---
Insert Figure 7 about here
---
We posit saccade cancellation as a second mechanism contributing to prolonged
fixation durations in the SOD paradigm. The underlying rationale is that removing the
scene from view might interrupt the preparation of eye movements. At the time point of
scene disappearance, if there is a labile saccade program active, it is subject to
cancellation. Here, noise was added to the cancellation process ensuring that not every
cancellation was successful (p1canc = 0.5). A similar cancellation mechanism was
implemented as response to the scene reappearance to reflect saccadic inhibition
(Reingold & Stampe, 2002, 2004). Again, in the simulations the probability of aborting a
labile saccade program is smaller than 1 (p2canc = 0.67). Note that the impact of such a
cancellation mechanism depends on the baseline probability of active labile saccade
programs at the time of scene disappearance or reappearance (see Table 4 below for a
numerical examination). In sum, the model comprises six parameters related to saccade
timing and programming (tsac, N, r0/ r1, τlab, τnlab, τex) as well as two cancellation
probabilities, all of which are summarized in Table 3.
---
Insert Table 3 about here
---
Modeling Results
Several features of the empirical data pose particular challenges for modeling.
as those produced by human participants. Second, fixation durations in the experiment
are not globally increased, but increase only when the scene is removed from view, i.e.,
in response to the experimental manipulation. Thus, the empirical data cannot be
accounted for by a mere change in mean and variance of the random walk process as
global model parameters as was the case in Study 2. Relatedly, the first mode of the
bimodal distribution of critical fixation durations shows little variation across the
different delay conditions (see Figure 9); instead, the effect of delay condition mainly
manifests in the tail of the distributions. Third, while we cannot rule out the possibility
that participants anticipated delays, the duration of the delay for a given critical fixation
was not predictable. Consequently, the obtained data pattern cannot be explained by a
global strategy in which the visuo-oculomotor system adjusts to a constant delay duration
(see also Henderson & Pierce, 2008, and Henderson & Smith, 2009, for direct evidence
against such a global strategy). Fourth, inclusion of very long delays is a challenge
because the model must generate a number of extremely prolonged fixation durations.
Finally, the infinite delay condition forms an important boundary condition. In all other
experimental conditions, the delay is randomly chosen from a fixed set of delay durations
(see above). In the infinite delay condition, however, participants determine the time
point of scene reappearance themselves since the scene only reappears when they move
their eyes away from the current location to end the critical fixation (theoretically, not
making any eye movements would thus lead to an infinite delay). Note that participants
are typically not aware of this relationship.
Mean probabilities and durations. Mimicking the experiment, simulated data
simulated data qualitatively reproduced the two populations of fixation durations
observed in the empirical data (Figure 6). Data points below the diagonal represent
fixation durations that were terminated before the scene returned to view. Data points
above the diagonal reflect fixation durations that waited until the scene returned. There is
also a hint of a saccadic inhibition gap, separating the two populations.
We translated this overall pattern into fixation probabilities and durations (Figure
8). Figure 8a shows the probability of “waiting out the mask” as a function of scene onset
delay. Across the different delay conditions, CRISP reproduces these probabilities very
well. Furthermore, Figure 8b depicts the mean fixation durations across the different
delay conditions, separately calculated for the two populations of fixation durations.
Again, data points below the diagonal reflect mean fixation durations for all instances
where the critical fixation was terminated during the mask. Data points above the
diagonal reflect the data points where the duration of the critical fixation was longer than
the delay. The figure also shows the empirically observed mean fixation duration
observed for the 0-ms delay control condition. This mean duration is well reproduced by
CRISP (cf., Simulation Study 1). In addition, CRISP qualitatively reproduces the
empirically observed data pattern for the SOD conditions (Figure 8b), but not in a
quantitatively exact way - for some of the delay conditions, the observed mean fixation
durations are somewhat overestimated or underestimated.
---
Insert Figure 8 about here
---
in the scatter plot (Figure 6), the underlying frequency distributions must be bimodal.
Figure 9 plots the corresponding distributions of fixation durations, separately for each
scene onset delay condition. Distributions for the (normal scene viewing) control data are
additionally presented. CRISP captured the bimodal fixation duration distributions
remarkably well (note that they were generated by a simple processing model rather than
resulting from a curve fitting procedure). Because of this qualitative agreement, we did
not further optimize the model’s goodness-of-fit by implementing an advanced fitting
procedure.
---
Insert Figure 9 about here
---
Note that in all non-infinite delay conditions, the second peak of the distribution
rises about 100 ms following scene reinstatement. The dip in fixation duration
distribution is likely due to saccadic inhibition. It has been suggested that saccadic
inhibition is due to low-level reflex-like oculomotor processes in response to visual
display changes (Reingold & Stampe, 2002, 2004; but see Pannasch et al., 2001).
Reingold and Stampe (2002) relate saccadic inhibition effects to inhibitory processes in
the superior colliculus. It is further suggested that saccadic inhibition may function to
provide the perceptual system with more time to process changes in visual input by
delaying the execution of saccades (Reingold & Stampe, 2004). Within the framework of
CRISP, we translate this reasoning into a tangible and numerically testable hypothesis.
We propose that, in response to the critical event, a large proportion of currently labile