study. International Journal of Nursing Studies, 53. pp. 219-227. ISSN 1873-491X DOI: https://doi.org/10.1016/j.ijnurstu.2015.09.003
Link to Leeds Beckett Repository record: http://eprints.leedsbeckett.ac.uk/3261/
Document Version: Article
The aim of the Leeds Beckett Repository is to provide open access to our research, as required by funder policies and permitted by publishers and copyright law.
The Leeds Beckett repository holds a wide range of publications, each of which has been checked for copyright and the relevant embargo period has been applied by the Research Services team.
We operate on a standard take-down policy. If you are the author or publisher of an output and you would like it removed from the repository, please contact us and we will investigate on a case-by-case basis.
Abstract
Background: Chronic pain is predominantly managed in primary care, although often
ineffectively. There is growing evidence to support the potential role of nurses and
pharmacists in the effective management of chronic pain.
Objective: To evaluate the effectiveness of a pain clinic jointly managed by a nurse and pharmacist.
Design: A mixed-methods design consisting of qualitative interviews embedded within a
quasi-experimental study.
Settings: A community-based nurse-pharmacist led pain clinic in the north of England.
Participants: Adult chronic pain (non-malignant) patients referred to the pain clinic.
Methods: Pain intensity was the primary outcome. Questionnaires (The Brief Pain Inventory (BPI), the Hospital Anxiety and Depression scale (HADS), the SF-36 and the
Chronic Pain Grade (CPG) questionnaire) were administered at the baseline, on
discharge and at 3-months post discharge (BPI and HADS only). Patient satisfaction
was explored using face-to-face, semi-structured qualitative interviews.
Results: Seventy nine patients with a mean age of 46.5 years (SD ±14.4) took part in the quasi-experimental study. Thirty-six and nine patients completed the discharge and
3-month follow-up questionnaires respectively. Compared to baseline, statistically
significant reductions were noted for two of the outcome measures: pain intensity
the service. Nineteen patients participated in qualitative interviews. The patients were,
in general, satisfied with the quality of service. Four contributing factors to patient
satisfaction were identified: ample consultation time; in-depth specialised knowledge; listening and understanding to patients’ needs; and a holistic approach.
Conclusion: Nurse and pharmacist managed community-based pain clinics can effectively deliver quality pain management services as they offer an interdisciplinary
holistic approach to pain management. Such services have the potential not only to
reduce the burden on secondary care but also decrease long waiting times for referral
to secondary care. Further research is required to support the development of evidence
based referral guidelines to such services.
Keywords: Chronic Pain; Primary care; Pharmacists; Nurse; Mixed-methods
Introduction:
Chronic (non-malignant) pain affects millions of adults globally, disrupting their
personal, social and professional lives, and contributing significantly to the overall
burden on healthcare systems and society. Chronic pain patients utilize significantly
more healthcare resources than patients with other long term conditions [1, 2]. In the
US, the overall annual cost associated with chronic pain has been estimated to range
from $560 to $635 billion (£ 341 billion to £387 billion), more than the annual costs of
heart disease ($309 billion; £188 billion), cancer ($243 billion; £148 billion), and
In most instances, chronic pain patients are managed within primary care. However,
issues like under treatment of chronic pain [4], abuse of opioid analgesics [5], lack of monitoring of repeat prescriptions leading to deteriorating patients’ quality of life [6], and
increasing burden on secondary care have been well documented in the literature,
necessitating development of specialised community-based pain management services.
There is growing evidence to support the role of nurses and pharmacists in chronic pain
management [7, 8, 9]. Pharmacist-led interventions have been shown to reduce pain
intensity, improve physical functioning and reduce adverse events among chronic pain
patients [7]. Similarly, nurse-led interventions have been shown to reduce the chronic
use of non-steroidal anti-inflammatory drugs (NSAIDs) [8], and improve physical
functioning [9] and self-management skills.
Keeping in view the potential usefulness of nurses and pharmacists in chronic pain
management and the limited capacity of general practitioners (GPs) in managing
chronic pain, the Leeds Community Healthcare NHS Trust, part of the UK National
Health Service, initiated a nurse-pharmacist managed pain clinic for patients with
chronic pain in the community setting. The working of the clinic has been described in
detail elsewhere [10]. Briefly, the role of the pharmacist, who spent one day per week at
the pain clinic, was to conduct medication review with the aim of ensuring safe and
effective use of analgesics. The nursing intervention focused on educating patients
about pain, clarifying any misconceptions, and encouraging patients to develop
self-management skills. A retrospective study reported a significant reduction in pain
intensity (P < 0.001) [11]. However, the small sample size and the use of pain scores
was designed to further build on the existing research evidence on the effectiveness of
the pain clinic using a mixed-methods approach.
Methods
Among various mixed-methods designs available, an embedded design
consisting of a quasi-experimental (quantitative) study and a descriptive qualitative
study was chosen [12]. In embedded design there is one principal method (qualitative or
quantitative) and it is given priority depending on the purpose of the research and the
other method provides supportive data [12]. The embedded design is particularly useful
when a single dataset is not sufficient and different questions requiring different
methodologies need to be answered within a single study [12]. The rationale for
choosing an embedded design has been discussed in detail elsewhere [13]. The study
was conducted at a pain clinic, situated in the north of England. The ethics approval
was obtained from the local NHS ethics committee (Ref no. 11/YH/0415)
All patients referred to the pain clinic were assessed for eligibility to participate in
this study by the first author (MAH) and/or clinical nurse specialist (KM). Patients
meeting the following inclusion criteria were invited to participate: age >18 years, history
of pain for >3 months and adequate ability to read and understand English. Pregnant
women and patients with malignant pain, psychiatric disorders or requiring acute
medical/surgical intervention for their pain relief were excluded. The required sample
size was calculated to be 79, with 80% power, a 95% confidence interval, a minimum
clinically important difference of 1.1 points (on 0-10 Numerical Rating Scale for pain
difference was considered for sample size calculation so that the study was powered
sufficiently to at least detect minimum clinically important differences.
Outcome measures
Outcome measures included: pain intensity (primary), physical functioning,
emotional functioning, quality of life and chronic pain grade. Pain intensity and physical
functioning were assessed using the Brief Pain Inventory (BPI) – a valid and reliable
tool which assesses pain intensity (average, least, worst, pain right now) and pain
interference with 7 daily life activities, including general activity, walking, work, mood,
enjoyment of life, relations with others and sleep [15]. The 14-item Hospital Anxiety and
Depression Scale consisting of 2 subscales: Anxiety A) and Depression
(HADS-D) was used to assess emotional functioning [16]. The mean cut-off score for HADS-A
and HADS-D was 8, to indicate anxiety and depression, respectively [16]. The SF-36, a
generic valid and reliable questionnaire, was used to assess quality of life [17]. Pain
severity was assessed using the chronic pain grade (CPG) questionnaire, a 7-item
questionnaire that classifies chronic pain patients into one of the four hierarchical categories according to pain severity: grade I, low disability–low intensity; grade II, low
disability–high intensity; grade III, high disability–moderately limiting; and grade IV, high
disability–severely limiting [18].
Demographic and clinical data were collected using a standardized, pilot-tested,
and structured questionnaire by reviewing case notes and patient interviews (by MAH).
The patients completed four self-administered questionnaires (mentioned above) 1) on
after discharge. The 3-month follow-up questionnaires (only the Brief Pain Inventory and
the Hospital Anxiety and Depression Scale) were mailed to the respondents in a prepaid
self-addressed return envelope, limited to the first 30 discharged patients only.
Qualitative phase
For the descriptive qualitative study, semi-structured, face-to-face interviews
were conducted using an interview guide. The patients were interviewed within 2 weeks
of their discharge by MAH either at patients’ homes or at the pain clinic, depending on
their preference. A combination of two purposive sampling techniques, convenience
sampling and maximum variation sampling [19], were used to recruit patients. Initially for
the first five interviews, convenience sampling was used and patients meeting the
inclusion/exclusion criteria and consenting for an interview were recruited. In order to
ensure representation of different types of patients referred to the clinic, the remaining
14 interviewees were recruited using maximum variation sampling. Patients of different
ages, sexes and pain scores (baseline and discharge) were interviewed to ensure diversity. “Data saturation”— whereby no new themes emerged from the data guided
sample size [19]. Interviews were audio-recorded using an electronic audio recorder.
The interview topic guide was designed to cover the following areas: expectations from
the service; efficacy of the service (did it help? how?); interaction with nurse and
pharmacist (time given for consultation, engaging patient in discussion and designing of
therapeutic plan, listening to and understanding the problem); understanding of chronic
compared to other services in past, aspects of the service which need improvement
etc.).
Data analysis
The quantitative data were analysed using Statistical Package for Social Sciences
(SPSS) for Windows version 20. For scoring SF-36, a scoring software provided by the
Quality Metric Incorporated (QM), Lincoln RI, USA was used. Since data were paired,
either the paired t-test or the Wilcoxon Signed-Rank test was used as appropriate. To
improve clinical interpretation of the results, based on the recommendations of the
IMMPACT group on benchmarks for interpreting clinically important change [20], the
number of patients demonstrating a minimum clinically important difference was also
highlighted.
Thematic analysis was used to analyze the qualitative data [19]. Each interview was
transcribed verbatim by a professional transcriber and each transcript was checked
against the original recording by the first author (MAH) for accuracy. Following this,
each transcript was coded manually line by line by the first author (MAH). The initial
coding framework was checked by another two authors (MB, SJC) for accuracy and
completeness by reviewing two coded interview transcripts. Once all the interviews
were coded, a list of all the codes was generated after removing duplicates and different
codes were sorted into potential themes. The relevant data extracts were collated within
these potential themes. As the new themes emerged, old ones were reviewed and
sometimes renamed in the light of the emergence of new themes. The process
To ensure the credibility and transferability of qualitative findings, peer review/debriefing
and providing rich thick description were used [21]. Peer review/debriefing was carried
out by two senior qualitative researchers (SJC and MB). A detailed description of the
study settings, participants, sampling technique, and data analysis method has been
provided to ensure transparency of the findings.
Results:
Quantitative Phase
Sociodemographics
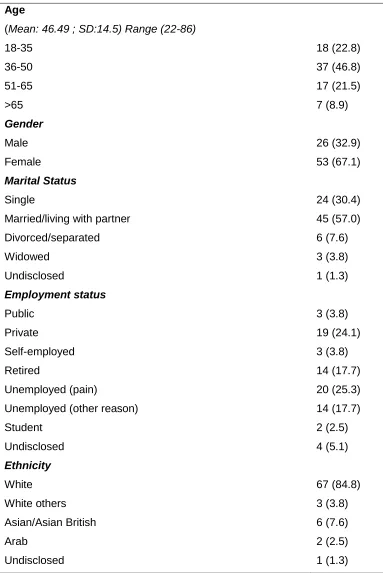
In total, 79 patients were enrolled in the quantitative phase with a mean age of 46.5
years SD ± 14.5 (range 22-86). Approximately, two thirds (67.1%) of the patients were
female and more than half of the patients (57.0%) were married or living with partner.
Slightly more than a quarter of the patients (25.3%) were unemployed due to pain
(Table 1). Low back (68.4%) followed by lower limb (58.2%) were the most commonly
reported pain sites. The majority of patients 56 (70.9%) reported to have never been
referred to a pain clinic/ pain consultant in the past.
The follow-up (discharge) data were available for 36 patients only as the data collection
had to be stopped because the service was unexpectedly decommissioned by the local
Primary Care Trust. For the 3-month follow-up, of the 30 patients invited, only nine
completed and returned the questionnaires. Therefore, keeping in view poor response
analyzed statistically as it would have been misleading. The implications of early
cessation of data collection have been discussed in the limitations section.
Outcome measures
Pain intensity was the primary outcome. Pain intensity scores were available for 79
and 35 patients at baseline and discharge respectively. Upon discharge, there was a
statistically significant reduction for worst pain (P = 0.02) and average pain (P = 0.02).
However, for least pain and pain right now the reduction in pain intensity score was not
statistically significant (P = 0.12) and P=0.06 respectively (Table 3). Thirteen (37.1%)
patients achieved a minimum clinically important difference (10-20% decrease in pain intensity [20]) while two (5.7%) each achieved a moderately important (≥ 30% decrease
[20]) and substantially important differences (≥50% decrease [20]) as per the
recommendations of IMMPACT group on interpreting clinically important changes.
The overall interference of pain with physical activity scores were available for 79
and 36 patients respectively. There was a significant reduction (P = 0.02) in overall
interference of pain with physical functioning upon discharge compared to the baseline
score. Fourteen (40%) patients achieved a minimum clinically important difference, at
least one point improvement on a 0 to 10 NRS, as per the recommendations of
IMMPACT group on benchmarks for interpreting clinically important changes for
physical functioning [20].
For quality of life (SF-36), there were no statistically significant differences in the
summary (MCS) scores (P=0.08). For individual domain scores, compared to the
baseline score, statistically significant improvements were found in physical role (RP)
(P= 0.01), bodily pain (BP) (P=0.01) and social functioning (SF) (P=0.03) at discharge.
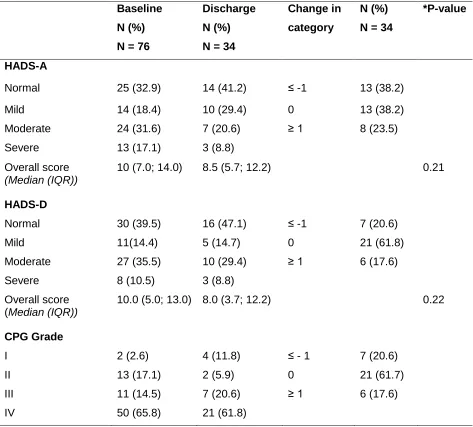
For anxiety and depression, both HADS-A and HADS-D were divided into four
ranges: normal (0-7); mild (8-10); moderate (11-15); and severe (16-21). Almost
two-thirds of the patients (67.1%) had HADS-A scores more than 7, i.e. were likely to have
an anxiety disorder (Table 3). Compared to the baseline, there was no statistically
significant reduction in the median HADS-A (P= 0.21) or HADS-D scores (P = 0.22).
However, for 13 (38.2%) and seven (20.6%) patients there was a reduction in the
severity of anxiety and depression respectively by at least one category (e.g. moderate
to mild or severe to moderate etc.).
For the CPG, the median pain intensity score was 76.66 (total score 100) (IQR
66.67; 83.33) and the median for disability score was 70 (60.00; 90.00) at baseline.
Compared to the baseline, there was a statistically significant reduction in pain intensity
(Median 73.33; IQR 55.00; 83.33) at discharge (P = 0.02). However, no statistically
significant improvement in disability score was found (P = 0.89) at the discharge
(Median 73.33; IQR 51.66; 91.67). In terms of change in chronic pain grade, 7 (20.6%)
patients reported improvement by at least one grade. However, the majority of the
patients, 21 (61.7%) did not report any improvement (Table 3).
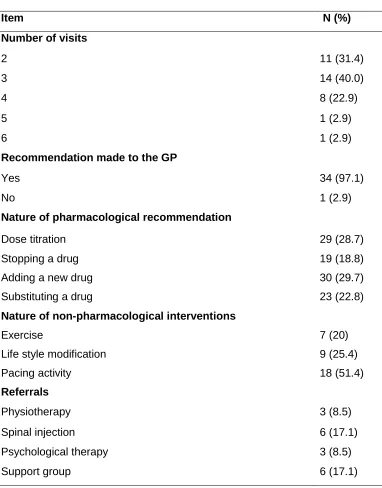
Nature of intervention
Data on the nature of the intervention were available for 35 patients (Table 4). The
(Range 2 to 6). Fourteen (40%) of the patients were discharged after 3 visits (Table 4).
In total, 101 medicine-related recommendations were made to the GP with a mean of
2.9 (range 1 to 6) recommendations per patient. For most of the patients [22 (62.8%)] 3
to 5 medicine-related recommendations were made to their GPs. Adding a new drug (n
= 30) followed by titrating the dose (n = 29) were the most commonly made
pharmacological recommendations. In addition, 34 non-pharmacological
recommendations were made in total with a mean of 1.3 (range 1 to 3) per patient.
Among non-pharmacological recommendations, pacing of activities (n = 18) was the
most common.
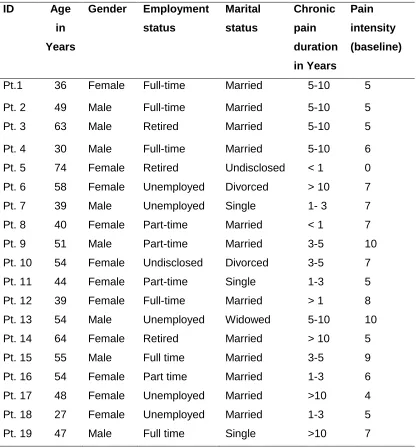
Qualitative Phase
In total, 19 participants recruited from the quantitative study sample, including eight men
and eleven women were interviewed. The age of the participants ranged from 27 to 74 years. Ten interviews were conducted at patients’ homes, eight at the pain clinic and
one at the patient’s office (during their lunch break). Interviews lasted between 25 and
45 minutes. The sociodemographic characteristics of the participants are given in Table
5.
Satisfaction with the service
In general, the majority of the patients were satisfied with the quality of care that they
received at the pain clinic. Four factors were identified during the data analysis which
contributed towards positive patient experience with the service: ample consultation
time, listening and understanding individual patients’ needs, in-depth specialised
“I think it’s a good little service that they’ve got going on there; I really,
really do.” [Pt. 12, 39 years old female]
a. Ample consultation time
The patients felt that they were given full freedom and time to express their views. In
contrast to the ten minute consultation slot with the GP, the patients had one hour for
the initial consultation and 30 to 45 minutes for the follow-up appointments which
allowed them to discuss their problems more openly and freely.
“You’re very conscious of the amount of time you have with your GP and it
was knowing that I was going to see somebody who actually is a pain specialist,
you just feel more confident and that because you feel they will take time with
you and listen to you and understand…” [Pt. 16, 54 years old female]
“When you come here you don’t feel that pressure, so you can be a bit
more open and a bit more frank and you can be a bit more descriptive.” [Pt. 8, 40
years old female]
b. In-depth specialised knowledge
The in-depth specialised knowledge of both the nurse and pharmacist in terms of
chronic pain management was quickly recognized by the patients.
“I think there’s also that knowledge base here. They’re obviously treating
kind of route to take when it comes to pain management and so on.” [Pt. 8, 40
years old female]
“[The clinical nurse specialist] explained what’s going off, how it affects
me, and then [Pharmacist] we’ve been sat down and we’ve been balancing all
my medications out, how much there is to take and how much… and what to take
and what not to take, you know. So it’s been a real…to me it has, it’s been a
really good thing to have been coming up here to the pain clinic.” [Pt. 13, 54
years old male]
The pharmacist focused on optimising the use of analgesics and other medicines
involved in pain management. The patients were informed about the side effects and
negative impact of over/under dosing.
“I felt she was very professional and she knew what she was doing, which is
comforting. I’ve seen the pharmacist on Tuesday and the way she sort of looked at my
medication and she knows what everything’s doing, she knows what it should be doing,
and she probably knows what I can do without, hence the tramadol [was taken off].” [Pt.
10, 54 years old female]
c. Listening and understanding individual patients needs
The patients found that both the nurse and the pharmacist expressed their interest in listening to patients’ views, in contrast to the GPs who the patients perceived as not
face-to-face interviews, the nurse and pharmacist developed a therapeutic plan in
consultation with the patients.
“She [the clinical nurse specialist] was very good at listening. She was,
very good. It was lovely having somebody to talk to who understood what pain
does to people and you could talk to her, she were a person that you could talk
to, some you can’t [ slight pause] can you, you know? Some people, they just
give off that aura, they don’t really care, you know. But she were very good, she
was yes.” [Pt. 14, 64 years old female]
“I think it’s because there’s a sympathetic ear and people will listen. And
there seems as if this understanding and they’re offering advice that we’ll take on
board, whereas we’ve not really had that… we’ve not felt that comfortable with
the GP because she openly admitted that she didn’t really know anything about
fibromyalgia and therefore she didn’t really know how to treat it.” [Pt. 8, 40 years
old female]
d. Holistic approach
The clinic offered a more holistic approach towards pain management compared to the
GP. Both pharmacological and non-pharmacological therapeutic options were explored
for each patient and individualized therapeutic plans were developed.
“Well really I suppose here they go through absolutely everything you
know so it’s a lot more in-depth and looking at the whole picture rather than
refer you to physio etc. It’s……..[Pauses]. Here it’s a much more holistic
approach really and they try and cover absolutely everything for you and see
what other services they may be able to refer you to or ask your GP to refer you
to. So I think really it’s a complete programme so it’s good in that way.” [Pt.11, 44
years old female]
After assessing individual patient’s needs, the patients were also referred to other
services such as the expert patient groups, musculoskeletal services, and psychological
services if required. The patients also found these referrals beneficial, contributing to an
overall satisfaction with the service.
“They have taken steps to help the emotional side, which that’s, you
know, sort of getting out and meeting people. And [the CNS] picked up on that
very quickly, very, very quickly.”[Pt. 10, 54 years old female]
“They [pain clinic] referred me to a physiotherapist who specialised in
chronic pain. And so through seeing that physiotherapist I’ve learnt different
ways of managing the pain which I found to be more effective than the
medication I was on.” [Pt. 18, 27 years old female]
Issues with the pain clinic
The patients also highlighted some negative issues with this service. They were not
pleased by the fact that the pain clinic did not prescribe medicines to them and they had
to go to their GPs to get the medicines. Patients felt that this caused unnecessary delay
“When I found that I was going to have to go back to him for the
prescription I was a bit in shock really. I’m thinking what? He’s referred me to
you for you to... saying that you’ll be able to look at these things and I’ve come
here hopefully to get these things and then you’re saying I’ve got to wait another
two weeks while you send a letter to my doctor and then he’ll just write a
prescription....[Pt. 19, 47 years old male]
Some of the patients also felt that they were not appropriate for this service and should
not have been referred here. They considered that they had pain for quite a long time
and knew about the various self-management strategies discussed at the pain clinic
including being active, exercise and pacing activities.
“I think it [the service] was more aimed at getting people re-motivated past
their pain, so we did talk a little bit about painkillers and modified those a bit, but
the main part of pain clinic to me seemed to be about getting people to get up
and go and take additional steps that maybe they weren’t already doing, which
really wasn’t kind of suitable for me I don’t think. I don’t ever sit down; I don’t
have time, so I think maybe I wasn’t really their target audience.” [Pt. 1, 36 years
old female]
Discussion:
Over the past few years, there has been growing interest in the use of mixed-methods
approaches in health services evaluation, as they allow the use of multiple methods to
mixed-methods approach which generated both effectiveness and satisfaction data
within a single study, thus providing a holistic evaluation of the service.
The majority of the patients were women and predominantly middle aged (36-50 years).
Chronic pain is more prevalent among women and they have been reported to use
more healthcare resources than men, which may explain the higher number of female
patients in the sample. More than a half (56.5%) of the patients had had chronic pain for
more than 3 years and, more importantly, for 70% of the patients this was their first visit
to a specialised pain service/clinic. The interplay of a number of factors including patients’ medical help seeking behavior, GPs’ lack of willingness to refer patients to a
specialised pain service and, lack of awareness among the GPs and patients about the
existence of such clinics may partly explain the delay in referral [25]. Importantly, during
the qualitative interviews quite a few patients highlighted that they had had to repeatedly
ask their GPs for referral before they were eventually referred.
Almost two thirds of the patients in our study had anxiety and depression. Anxiety and
depression are common comorbidities and are associated with poorer prognosis among
chronic pain patients [26]. Patients in the qualitative interviews highlighted the
significant impact of chronic pain on their mental and physical functioning and described
a two way relationship between pain and depression. The National Health Survey in the
UK reported that participants in chronic pain grade IV (high disability-severely limiting)
were more likely to be anxious and depressed than the participants with grade I (low
disability-low intensity) and II (low disability-high intensity) [27]. In the present study,
explaining a high incidence of anxiety and depression among patients referred to the
clinic.
The recommendations made by the IMMPACT group guided the selection of outcome measures [20]. These were statistically significant changes in the “worst pain”, “average
pain” and pain interference with physical functioning. It has been suggested that the
population distribution of pain scores do not usually have a normal distribution and are ‘U-shaped’; therefore, merely reporting changes in the means/medians for continuous
data (e.g. pain intensity) can be misleading as patients tend to have either very good or
very poor pain relief [28]. To avoid this limitation and to improve clinical interpretation of
the results, percentages of patients responding to treatment have been reported as well
for two of the outcome measures: pain intensity and physical functioning, as IMMPACT
group recommendations were available for these two outcomes measures only [20]. No
statistically significant reductions were noted for anxiety (P=0.21), depression (P=0.22),
the physical component summary (PCS) score or the mental component summary
(MCS) score. The lack of intervention effect in terms of anxiety, depression, and quality
of life might be attributed to the small sample size. It is also possible that the
intervention was not effective or the outcome measures were not sensitive enough to
detect a difference. These issues require further exploration.
Patient satisfaction was explored using face-to-face qualitative interviews. Patients were
generally satisfied with the quality of care provided by the nurse and the pharmacist at
factors contributing to patients’ satisfaction. Non-pharmacological alternatives were
suggested in instances where the patient had: adherence problems; issues related to
the side effects/tolerance; or non-pharmacological interventions were considered
helpful. The holistic approach was evident from the nature of recommendations made at
the clinic. For 35 patients, 101 medicine-related (mean 2.9; range 1 to 6) and 42
non-pharmacological recommendations (mean 1.3; range 1 to 3) were made to the GPs and
patients, suggesting that both pharmacological and non-pharmacological needs were
assessed and addressed.
Limitations
The major limitation of the present study was the inability to meet the desired sample
size. Discharge data were available for 36 patients only as the service was
unexpectedly decommissioned by the local primary care trust (PCT). Subsequently, the
services of the clinical nurse specialist were absorbed into a musculoskeletal service at
the same community health center and the services of the pharmacist were
discontinued. Since there were structural changes in the provision of service, collecting
further follow-up data would not have been appropriate. The inability to gain the
required sample size (i.e. the study was underpowered) could lead to Type II error,
explaining a lack of intervention effect on the quality of life, anxiety and depression
outcomes in the present study. On the other hand, the significant intervention effect on
pain intensity and physical functioning, might be due to Type I error, a false positive.
Therefore, the results should be interpreted with care. However, during the qualitative
intensity, physical functioning and quality of life. Integrating qualitative and quantitative data helped to overcome the sample size limitation by providing patients’ perspectives
to complement the numerical data. It was deemed inappropriate to employ statistical
methods to impute missing data, fearing data artificiality, as it accounted for more than
50% of the data. Another associated limitation was poor response to 3-month follow-up
questionnaires despite the fact that personalised letters were sent to patients to improve
the response rate. Consequently the 3-month follow up data were not statistically
analysed.
Conclusion
Interdisciplinary community based pain clinics jointly run by nurses and pharmacists
have the potential to improve chronic pain management in the community. In addition to
reducing pain intensity and improving physical functioning, such community-based
clinics can not only improve access to specialised pain service but also reduce burden
on the secondary care. The cost-effectiveness of such services should be evaluated as
it would aid service commissioners in the design and implementation of such services in
future. The ample consultation time with patients allowed the nurse and the pharmacist
to obtain a full medication and medical history and develop an individualised
management plan addressing both the pharmacological and non-pharmacological needs of the patients. In terms of the patients’ perspective, they felt that they were
treated with respect and empathy and were generally satisfied with the quality of
service. There is a need to develop evidence-based referral guidelines for such
community based clinics to ensure that only the patients who are likely to benefit from
services early during the course of the treatment as GPs’ lack of specialised knowledge
References:
1. Blyth FM, March LM, Brnabic AJM et al. Chronic pain and frequent use of
health care. Pain 2004;111:51-58
2. Breivik H, Collett B, Ventafridda V et al. Survey of chronic pain in Europe:
prevalence, impact on daily life, and treatment. Eur J Pain 2006;10: 287-333.
3. Gaskin DJ, Richard P. The economic costs of pain in the United States. J Pain
2012; 13:715-724.
4. Hanlon JT, Fillenbaum GG, Studenski SA, et al. Factors associated with
suboptimal analgesic use in community-dwelling elderly. Ann Pharmacother
1996;30:739-44.
5. Couto JE, Romney MC, Leider HL, et al. High rates of inappropriate drug use
in the chronic pain population. Popul Health Manag 2009;12:185-190
6. The Accounts Commission for Scotland. Supporting prescribing in general
practice. Edinburgh, UK: Accounts Commission; 1999. Available:
www.audit-scotland.gov.uk/ docs/health/1999/nr_9909_prescribing_general_practice .pdf
(accessed Apr. 22, 2013).
7. Hadi MA, Alldred DP, Briggs M et al. Effectiveness of pharmacist-led
8. Jones AC, Coulson L, Muir K et al. A nurse-delivered advice intervention can
reduce chronic non-steroidal anti-inflammatory drug use in general practice: A
randomized controlled trial. Rheumatology 2002;41: 14-21
9. Ryan S, Hassell AB, Lewis M et al. Impact of a rheumatology expert nurse on
the wellbeing of patients attending a drug monitoring clinic. J Adv Nurs 2006;
53:277-286.
10. Hadi MA, Alldred DP, Closs SJ, et al. A combined nurse-pharmacist managed
pain clinic: joint venture of public and private sectors. Int J Clin Pharm
2012;34:1-3.
11. Briggs M, Closs SJ, Marczewski K, et al. A feasibility study of a combined
nurse/pharmacist-led chronic pain clinic in primary care. Qual Prim Care
2008;16:91-4
12. Creswell WJ, Plano-Clark VL. Designing and Conduction Mixed Methods
Research, 2nd edn. Thousand Oaks, CA: Sage Publications, 2011
13. Hadi MA, Alldred DP, Closs SJ et al. A mixed-methods evaluation of a
nurse-pharmacist-managed pain clinic: Design, rationale and limitations. Can Pharm
J 2013; 146: 197-201
14. Eng J. Sample size estimation: how many individuals should be studied?
Radiology 2003;227:309-13.
15. Cleeland CS, Ryan KM. Pain assessment: global use of the Brief Pain
16. Zigmond AS, Snaith RP. The Hospital Anxiety and Depression Scale. Acta
Psychiatr Scand 1983;67:361-70.
17. Ware JE, Sherbourne CD. The MOS 36-item Short-Form Health Survey
(SF-36): conceptual framework and item selection. Med Care 1992;30:473-83.
18. Von Korff M, Ormel J, Keefe FJ, et al. Grading the severity of chronic pain.
Pain 1992;50:133-49.
19. Green J, Thorogood N. Qualitative Methods for Health Research, 2009,
London, Sage.
20. Dworkin RH, Turk DC, Wyrwich KW, et al. Interpreting the Clinical Importance
of Treatment Outcomes in Chronic Pain Clinical Trials: IMMPACT
Recommendations. J Pain 2008; 9: 105-121
21. Strauss A. Qualitative analysis for social scientists, 1987, New York,
Cambridge University Press.
22. O'cathain A, Murphy E, Nicholl J. The quality of mixed methods studies in
health services research. J Health Serv Res Policy 2008; 13: 92-98.
23. Hadi MA, Alldred DP, Briggs M, et al. Mixed methods research in pharmacy
practice: Basics and beyond (Part 1). Int J Pharm Pract 2013;21:341-345
24. Hadi MA, Alldred DP, Briggs M, et al. Mixed-methods research in Pharmacy
Practice: Recommendations for quality reporting (Part 2). Int J Pharm Pract
2014; 22:96-100
25. Glachen M. Chronic pain: Treatment barriers and strategies for clinical
26. Boersma K, Linton S. Expectancy, fear and pain in the prediction of chronic
pain and disability: a prospective analysis. Eur J Pain 2006;10:551-7
27. Bridges S. Health Survey for England - 2011: Chapter 9, Chronic pain.
Available at:
https://catalogue.ic.nhs.uk/publications/public-health/surveys/heal-surv-eng-2011/HSE2011-Ch9-Chronic-Pain.pdf [Accessed
6 November 2014].
28. Mcquay H, Carroll D, Moore A. Variation in the placebo effect in randomised
controlled trials of analgesics: all is as blind as it seems. Pain
Table 1. Sociodemographic characteristics of the patients
Characteristic N (%)
Age
(Mean: 46.49 ; SD:14.5) Range (22-86)
18-35 18 (22.8)
36-50 37 (46.8)
51-65 17 (21.5)
>65 7 (8.9)
Gender
Male 26 (32.9)
Female 53 (67.1)
Marital Status
Single 24 (30.4)
Married/living with partner 45 (57.0)
Divorced/separated 6 (7.6)
Widowed 3 (3.8)
Undisclosed 1 (1.3)
Employment status
Public 3 (3.8)
Private 19 (24.1)
Self-employed 3 (3.8)
Retired 14 (17.7)
Unemployed (pain) 20 (25.3)
Unemployed (other reason) 14 (17.7)
Student 2 (2.5)
Undisclosed 4 (5.1)
Ethnicity
White 67 (84.8)
White others 3 (3.8)
Asian/Asian British 6 (7.6)
Arab 2 (2.5)
Education level
Undisclosed 10 (12.7)
GCSE/O-Level 29 (36.7)
A-level/NVQ 19 (24.1)
Diploma 5 (6.3)
Degree 10 (12.7)
Pain Sites*
Head, Face and Neck Upper shoulder Thoracic region Abdominal region Low back Lower Limb Pelvic region Anal, perineal
Pain Duration (Years)
39 (49.4) 28 (35.4) 7 (8.8) 5 (6.3) 54 (68.3) 46 (58.2) 7 (8.8) 2 (2.7)
< 1 year 13 (16.5)
1 to 3 21(26.6)
3-5 19 (24.1)
5-10 17 (21.5)
>10 9 (11.4)
Number of comorbidities
None 34 (43.0)
1 19 (24.1)
2 15 (19.0)
3 10 (12.7)
4 1(1.3)
Past visit of pain clinic/consultant
No 56 (70.9)
Yes 23 (29.1)
Table 2. Comparison of pain intensity, pain interference with physical functioning scores
at baseline and discharge.
N N* Median (IQR) Z **P-value
BPI Pain intensity
Worst Pain
Baseline 79 35 8.0 (7.0;9.0) - 2.4 0.02
Discharge 35 7.5 (5.0; 8.0)
Least Pain
Baseline 79 35 5.0 (3.0; 7.0) -1.5 0.12
Discharge 35 4.0 (2.0; 6.0)
Average pain
Baseline 79 35 7.0 (5.0; 8.0) -.2.3 0.02
Discharge 35 6.0 (4.0;7.0)
BPI Pain interference
Baseline 79 35 7.1 (5.7;8.2) -2.3 0.02
Discharge 36 6.1 (4.0; 8.7)
QoL (SF-36) Mean (SD) T
PCS
Baseline 74 33 28.8 (11.0) 1.4 0.15
Discharge 35 30.8 (12.9)
MCS
Baseline 74 33 36.3 (15.1) 1.8 0.08
Discharge 35 41.2 (14.6)
Table 3: Comparison of Anxiety, Depression and Chronic pain Grade at baseline and discharge.
Baseline
N (%)
N = 76
Discharge
N (%)
N = 34
Change in
category
N (%)
N = 34
*P-value
HADS-A
Normal 25 (32.9) 14 (41.2) ≤ -1 13 (38.2)
Mild 14 (18.4) 10 (29.4) 0 13 (38.2)
Moderate 24 (31.6) 7 (20.6) ≥ 1 8 (23.5)
Severe 13 (17.1) 3 (8.8)
Overall score
(Median (IQR))
10 (7.0; 14.0) 8.5 (5.7; 12.2) 0.21
HADS-D
Normal 30 (39.5) 16 (47.1) ≤ -1 7 (20.6)
Mild 11(14.4) 5 (14.7) 0 21 (61.8)
Moderate 27 (35.5) 10 (29.4) ≥ 1 6 (17.6)
Severe 8 (10.5) 3 (8.8)
Overall score
(Median (IQR))
10.0 (5.0; 13.0) 8.0 (3.7; 12.2) 0.22
CPG Grade
I 2 (2.6) 4 (11.8) ≤ - 1 7 (20.6)
II 13 (17.1) 2 (5.9) 0 21 (61.7)
III 11 (14.5) 7 (20.6) ≥ 1 6 (17.6)
IV 50 (65.8) 21 (61.8)
Table 4. Nature of recommendations made at the pain clinic
Item N (%)
Number of visits
2 11 (31.4)
3 14 (40.0)
4 8 (22.9)
5 1 (2.9)
6 1 (2.9)
Recommendation made to the GP
Yes 34 (97.1)
No 1 (2.9)
Nature of pharmacological recommendation
Dose titration 29 (28.7)
Stopping a drug 19 (18.8)
Adding a new drug 30 (29.7)
Substituting a drug 23 (22.8)
Nature of non-pharmacological interventions
Exercise 7 (20)
Life style modification 9 (25.4)
Pacing activity 18 (51.4)
Referrals
Physiotherapy 3 (8.5)
Spinal injection 6 (17.1)
Psychological therapy 3 (8.5)
Table 5. Demographics of patients participated in qualitative interviews
ID Age
in
Years
Gender Employment
status Marital status Chronic pain duration in Years Pain intensity (baseline)
Pt.1 36 Female Full-time Married 5-10 5
Pt. 2 49 Male Full-time Married 5-10 5
Pt. 3 63 Male Retired Married 5-10 5
Pt. 4 30 Male Full-time Married 5-10 6
Pt. 5 74 Female Retired Undisclosed < 1 0
Pt. 6 58 Female Unemployed Divorced > 10 7
Pt. 7 39 Male Unemployed Single 1- 3 7
Pt. 8 40 Female Part-time Married < 1 7
Pt. 9 51 Male Part-time Married 3-5 10
Pt. 10 54 Female Undisclosed Divorced 3-5 7
Pt. 11 44 Female Part-time Single 1-3 5
Pt. 12 39 Female Full-time Married > 1 8
Pt. 13 54 Male Unemployed Widowed 5-10 10
Pt. 14 64 Female Retired Married > 10 5
Pt. 15 55 Male Full time Married 3-5 9
Pt. 16 54 Female Part time Married 1-3 6
Pt. 17 48 Female Unemployed Married >10 4
Pt. 18 27 Female Unemployed Married 1-3 5