load carriage on oxygen consumption, posture and gait characteristics. European Journal of Applied Physiology, 117 (3). ISSN 1439-6319 DOI: https://doi.org/10.1007/s00421-016-3531-7
Link to Leeds Beckett Repository record:
http://eprints.leedsbeckett.ac.uk/3422/
Document Version: Article
Creative Commons: Attribution 4.0
The aim of the Leeds Beckett Repository is to provide open access to our research, as required by funder policies and permitted by publishers and copyright law.
The Leeds Beckett repository holds a wide range of publications, each of which has been checked for copyright and the relevant embargo period has been applied by the Research Services team.
We operate on a standard take-down policy. If you are the author or publisher of an output and you would like it removed from the repository, please contact us and we will investigate on a case-by-case basis.
ORIGINAL ARTICLE
The effect of temperature, gradient, and load carriage on oxygen
consumption, posture, and gait characteristics
Katrina Hinde1 · Ray Lloyd2 · Chris Low1 · Carlton Cooke2
Received: 5 May 2016 / Accepted: 29 December 2016 / Published online: 2 February 2017 © The Author(s) 2017. This article is published with open access at Springerlink.com
significantly higher than in warm conditions. The increased V̇O2 in colder temperatures at the same exercise intensity is predicted to ultimately lead to earlier onset of fatigue and cessation of exercise. These results highlight the need to consider both appropriate clothing and fitness during cold exposure.
Keywords Load carriage · Cold exposure · Oxygen consumption · Stride length
Abbreviations
ANOVA Analysis of variance BAT Brown adipose tissue HR Heart rate
MST Mean skin temperature NST Non-shivering thermogenesis V̇O2 Oxygen consumption
SL Stride length TFL Trunk forward lean
Introduction
Recreational trekking and mountaineering is becoming increasingly popular and affordable and activities, such as these, alongside numerous occupational tasks, usu-ally require external loads to be carried. Loads can be carried in various ways, but in mountaineering, trekking and military operations, the backpack is recommended as the most versatile, appropriate, and economical method of manual load carriage (Knapik et al. 1996). The rela-tionship between load carried and energy expenditure has been extensively researched. The general consensus regarding energy expenditure when carrying loads on the back is that as load increases, oxygen consumption and Abstract
Purpose The purpose of this experiment was to evalu-ate the effect of load carriage in a range of temperatures to establish the interaction between cold exposure, the magnitude of change from unloaded to loaded walking and gradient.
Methods Eleven participants (19–27 years) provided written informed consent before performing six randomly ordered walking trials in six temperatures (20, 10, 5, 0, −5, and −10 °C). Trials involved two unloaded walking bouts before and after loaded walking (18.2 kg) at 4 km · h−1, on 0
and 10% gradients in 4 min bouts.
Results The change in absolute oxygen consumption (V̇O2) from the first unloaded bout to loaded walking was similar across all six temperatures. When repeating the sec-ond unloaded bout, V̇O2 at both −5 and −10 °C was greater
compared to the first. At −10 °C, V̇O2 was increased from
1.60 ± 0.30 to 1.89 ± 0.51 L · min−1. Regardless of
temper-ature, gradient had a greater effect on V̇O2 and heart rate
(HR) than backpack load. HR was unaffected by tempera-ture. Stride length (SL) decreased with decreasing tem-perature, but trunk forward lean was greater during cold exposure.
Conclusion Decreased ambient temperature did not influ-ence the magnitude of change in V̇O2 from unloaded to
loaded walking. However, in cold temperatures, V̇O2 was
Communicated by George Havenith.
* Katrina Hinde
1 Leeds Beckett University, Headingley Campus, Leeds,
West Yorkshire LS6 3QS, UK
2 Leeds Trinity University, Brownberrie Lane, Horsforth,
thus energy expenditure increase in an approximately proportional manner (Quesada et al. 2000; Lloyd and Cooke 2000; Faghy and Brown 2014). However, new evi-dence suggests that during very heavy load carriage (up to 45 kg), the increases in oxygen consumption (V̇O2) are not proportional to the load mass (Phillips et al. 2016a). The energy cost of carrying such loads not only depends on the weight of the load, but also varies depending on the age, ethnicity, body mass of the participant, speed, terrain, and biomechanical factors (Givoni and Goldman
1971; Hainsman 1988; Phillips et al. 2016b).
It has been widely reported that V̇O2 increases during submaximal exercise in the cold compared to a moderate ambient temperature (Sandsund et al. 1998; Oksa et al.
2004; Jett et al. 2006). Doubt (1991) concluded that there were two possible reasons for higher exercise V̇O2 in the cold. The first is non-exercising thermogenesis (shiver-ing), and in the absence of shivering, an elevated V̇O2
suggests non-shivering thermogenesis (NST). NST, a fac-ultative form of thermogenesis, includes muscle tensing, feeling of stiffness and enhanced metabolism (Parsons
2003) being closely linked with brown adipose tissue (BAT) activity (Nedergaard et al. 2007). It is unknown at what environmental temperatures, NST becomes active. The second mechanism, not independent from the first, for higher exercise V̇O2 in the cold is the potential
decrease in mechanical efficiency (Doubt 1991; Oksa et al. 2004).
There is considerable literature surrounding load car-riage, but most of this work is laboratory based in thermo-neutral environments. There is little known about the inter-active effects of cold exposure and load carriage which is surprising given both factors are commonly experienced together. The literature surrounding cold exposure mainly focuses on cycling performance and a comparison between two temperatures (warm and cold), although some stud-ies compare three temperatures. There have only been two other investigations using a range of six ambient tempera-tures (Sandsund et al. 2012; Renberg et al. 2014), but these were concerned with running performance, employing higher exercise intensities (67–100% V̇O2max) with par-ticipants wearing adequate winter (ski) clothing. This is the first investigation into the effects of a range of decreas-ing temperatures on physiological variables durdecreas-ing walk-ing. In addition, there are very few studies assessing the effect of temperature on biomechanical variables, in par-ticular, stride parameters. Limited evidence suggests that cold exposure elicits an increase in stride frequency and a decrease in stride length (SL, Folland et al. 2006). Further-more, there are equivocal findings associated with stride parameters and walking on a gradient. Much of the exist-ing literature involves studies that focus solely on the bio-mechanical or physiological effects of load carriage, with
very few taking a combined factor approach (Simpson et al.
2011), ignoring the reality that such effects can interact. The purpose of the present study was to investigate the effect of load carriage in a range of temperatures to estab-lish the interaction between cold exposure and the mag-nitude of change from unloaded to loaded walking when studying V̇O2, heart rate (HR) and skin temperature. In
addition, the interaction between gradient and load was evaluated to establish which stressor has a greater effect on oxygen consumption and whether the combined effect is equal to, less than or greater than the individual stressors.
We hypothesised that oxygen consumption would increase as temperature decreased and thus the change in V̇O2 when going from unloaded to loaded walking would
be greater during cold exposure. Skin temperature and, therefore, HR would be significantly reduced during cold exposure. It was also hypothesised that a combination of increased gradient, load and decreased temperature would all interact to create a greater associated oxygen consump-tion and increases in SL.
Methods
Participants
University students (n = 11; seven males, four females) volunteered to participate in the study (age, 22 ± 3 years; height, 173.9 ± 8.6 cm; body mass, 71.31 ± 10.44 kg). The experimental procedures were approved by the Local Research Ethics Committee of the Carnegie Faculty at Leeds Beckett University. Prior to testing, participants were all informed of the procedures and potential risks of the experiments. All participants gave written informed consent.
Participants were apparently healthy, aged 18+ years and assessed as “low-risk” individuals by the ACSM (2013) Guidelines for cardiovascular, pulmonary, and met-abolic diseases. If after answering questions on risk factors, signs, symptoms, and history of disease, participants had no risk factors or a maximum of one then they were classed as low risk. Areas assessed for risk factors were age, family history, smoking status, lifestyle, obesity, and hypertension. Participants were habitually active, completing 3–5 ses-sions of moderate exercise a week and were able to easily tolerate 2 h of submaximal exercise relative to their fitness levels.
Exercise protocol
Hampshire, UK) at Leeds Beckett University. Environmen-tal conditions were kept constant and controlled at 50 ± 5% humidity, ~160 mmHg partial pressure of oxygen and with a wind speed of 2.9 m · s−1. Participants completed six
tri-als, one at each temperature (20 ± 0.5, 10 ± 0.5, 5 ± 0.5, 0 ± 0.5, −5 ± 0.5, and − 10 ± 1.0 °C). Participants’ exposure to the different environmental temperatures was assigned using a Counter-balanced Latin square and at least 24 h separated trials. Participants wore shorts, t-shirt, and train-ers for all trials, and for trials at 0 °C and below, hat and gloves were worn.
Before any exercise took place, participant’s resting blood pressure and resting heart rate were measured to ensure that they were apparently healthy and safe to test. Resting blood pressure was measured using the Boso Medi-cus (Bosch, Jungingen, Germany) manual blood pressure device, whilst resting heart rate was measured using a Polar T31 coded™ transmitter and FT1 watch (Polar, Kempele, Finland). Values for blood pressure of <140/90 mmHg were accepted as normal, as were resting HR values of <100 beats · min−1. Baseline skin temperature was also
measured using a Squirrel Data Logger (400 Series: 401/451, Wessex Power, Dorset, UK). Skin temperature was measured at four sites (chest, forearm, thigh, and calf), and mean skin temperature (MST) was calculated using the equation created by Ramanathan (1964): MST = [0.3 (chest + arm)] + [0.2 (thigh + leg)].
The protocol began with a 15-min standardised rest period during which heart rate and skin temperature were measured. Core temperature during −10 °C exposure was measured using an ingestible CorTemp® pill (HQInc, Palmetto, Florida) for safety reasons and to ensure that core temperature did not drop below 35.5 °C. Participants then performed unloaded walking on a calibrated tread-mill (PPS-med 1, Woodway, Weil am Rhein, Germany) at 4 km · h−1 for 4 min bouts at 0 and 10% gradient. 1 min
was given after walking at 0% for the treadmill to increase to 10% grade, during which the participant was stationary. Following a rest period allowing for heart rate to return to resting level (7.05 ± 1.55 min), the same walking trial was completed; however, this time participants were loaded, carrying an 18.2 kg backpack. Another rest period was set (6.31 ± 1.58 min) followed by the unloaded section being repeated again. An exercise duration of 4 min was chosen as previous studies by Lloyd and Cooke (2000) have shown that 3 min of exercise is sufficient for participants to be walking to achieve steady-state oxygen consumption. The authors can confirm that steady-state V̇O2 was achieved and there were no significant differences between the third and last minute V̇O2 readings for any of the environmental
conditions.
Heart rate (HR) was monitored continuously through-out the protocol and averaged over the last minute of each
stage. Expired gas was analysed by an online gas analyser (Cortex 3B Metalyzer, Leipzig, Germany). Data were col-lected breath-by-breath, but evaluated over 30 s intervals. Reported V̇O2 data were calculated from the last minute of each stage. Participants wore a facemask attached to the sample line which was connected to the online gas analyser. Calibration of the online system was performed before each trial, and values were accepted if the offset was within 0.02% of the actual concentrations.
Participants were filmed from the side using a standard video camera (Casio EX-FH100, New Jersey, USA) set at 60 Hz. The camera was set up 2.58 ± 0.03 m from the treadmill and perpendicular to the treadmill belt. A calibra-tion frame was set up and recorded before each participant began a trial. Biomechanical data were collected in the last minute of each exercise bout for 10 s. Comparable to Lloyd and Cooke (2011), three of the events that occur dur-ing a sdur-ingle gait cycle were chosen for analysis: heel strike, mid support, and toe-off. Data were analysed using SIMI Motion 8.5.6 (Unterschleissheim, Germany). Stride length (SL) was calculated using the video recordings according to Lloyd and Cooke (2011). A stride was defined as the period between consecutive toe-off events of the left foot. The time taken for six complete strides (12 steps) was measured and then divided by 6 to get cycle time in seconds (Levine et al. 2012). SL was calculated by multiplying the known treadmill speed (1.1 m · s−1) by cycle time. Two landmarks
(left hip and left shoulder) were identified using markers. Trunk forward lean included three measurements during a randomly selected, complete gait cycle within the 10 s film-ing period: left heel strike, mid support, and toe-off. An angle of greater than 90° indicated trunk forward lean and angles less than 90° showed backwards inclination.
Study design
Walking speed
A walking speed of 4 km · h−1 was selected due to the
consistency of its use within load carriage research and its economy in normal adult walking compared to higher or lower speeds (Grenier et al. 2011).
Temperature
range of temperatures used in previous studies investigating cold air exposure (Timmons et al. 1985; Oksa et al. 2004) and tolerance and discomfort of participants for 1 h wear-ing minimal clothwear-ing.
Load
The load carried was made up of items usually taken on trekking/mountaineering trips. One backpack (Wynnster Equador) was used for the whole study and for all partici-pants. The backpack had a 65 L capacity and was fitted to each participant before their trial started. The adjustable ladder on the main section of the backpack was altered depending on participants’ height and participants were encouraged to carry the majority of the weight on their hips rather than the shoulders. The weight of the loaded pack was 18.2 kg with load justification coming from a combi-nation of previous research methodologies (Simpson et al.
2011).
Statistical analysis
Data were analysed using IBM SPSS 22, with significance tested at 95% confidence intervals (CI), p < 0.05. Descrip-tive statistics (mean ± SD) were calculated for all out-come measures. All data were tested for normality (Shap-iro–Wilk), and all data were normally distributed (p > 0.05). To assess for differences between conditions, three-way repeated measures analysis of variance (ANOVA) (6 × 3 × 2; temperature × load × gradient) was conducted to establish any significant main effects and interactions, accounting for variability across the whole study. This analysis was followed up with three-way repeated meas-ures ANOVAs (6 × 2 × 2; temperature × load × gradient) which separated the loading conditions to allow the sepa-rate research questions to be addressed (i.e., unloaded 1, loaded; unloaded 1 and unloaded 2; unloaded 2, loaded).
Post-hoc tests for significant main effects were conducted using a Bonferroni adjustment. Change in V̇O2 (L · min−1)
from unloaded to loaded walking (ΔV̇O2) was analysed
using a two-way repeated measures ANOVA (6 × 2; tem-perature × gradient). Mean skin temperature was analysed in a similar way (6 × 6, temperature × time). In cases when the assumption of sphericity was violated, the Huynh–Feldt correction was used. Effect sizes for repeated measures ANOVA were calculated using partial eta squared (ηp2).
Two-way and three-way interactions were reported, and classification of interactions were identified according to Lloyd and Havenith (2016).
Results
Oxygen consumption
Effect of individual stressors
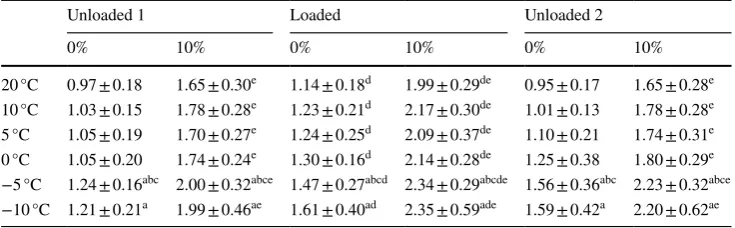
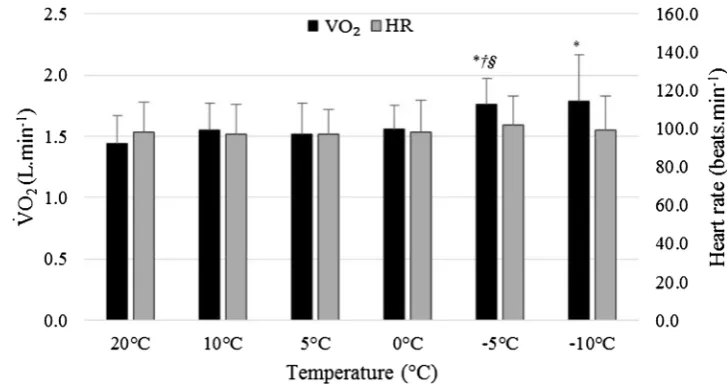
Variation in oxygen consumption across all experimen-tal conditions is shown in Table 1. As ambient tempera-ture decreased, V̇O2 significantly increased (p < 0.001,
ηp2 = 0.460). Post-hoc tests identified a number of
signifi-cant differences between ambient temperatures averaged across all loads and gradients (p ≤ 0.045, Fig. 1).
The repeated unloaded bout of exercise was included to assess variation in low intensity walking and the potential effect of fatigue. When analysing both unloaded conditions, there was a significant main effect for load (p = 0.028,
ηp2 = 0.397), with unloaded 2 producing significantly
higher V̇O2 values than unloaded 1.
The increase in V̇O2 from unloaded to loaded
walk-ing did not change significantly with temperature (ΔV̇O2,
p = 0.44, ηp2 = 0.089). Although V̇O
2 was significantly
higher when walking uphill (10%), the changes in V̇O2
Table 1 Mean ± SD V̇O2
(L · min−1) values for each
temperature, load, and gradien
a Denotes a significant difference to 20 °C responses b Denotes a significant difference to 10 °C responses c Denotes a significant difference to 0 °C responses d Denotes a significant difference to unloaded responses e Denotes a significant difference to 0% responses
Unloaded 1 Loaded Unloaded 2
0% 10% 0% 10% 0% 10%
20 °C 0.97 ± 0.18 1.65 ± 0.30e 1.14 ± 0.18d 1.99 ± 0.29de 0.95 ± 0.17 1.65 ± 0.28e
10 °C 1.03 ± 0.15 1.78 ± 0.28e 1.23 ± 0.21d 2.17 ± 0.30de 1.01 ± 0.13 1.78 ± 0.28e
5 °C 1.05 ± 0.19 1.70 ± 0.27e 1.24 ± 0.25d 2.09 ± 0.37de 1.10 ± 0.21 1.74 ± 0.31e
0 °C 1.05 ± 0.20 1.74 ± 0.24e 1.30 ± 0.16d 2.14 ± 0.28de 1.25 ± 0.38 1.80 ± 0.29e
−5 °C 1.24 ± 0.16abc 2.00 ± 0.32abce 1.47 ± 0.27abcd 2.34 ± 0.29abcde 1.56 ± 0.36abc 2.23 ± 0.32abce
[image:5.595.178.546.538.652.2]from 0 to 10% gradient were similar across all temperatures (p = 0.814, ηp2 = 0.043).
Differential effects
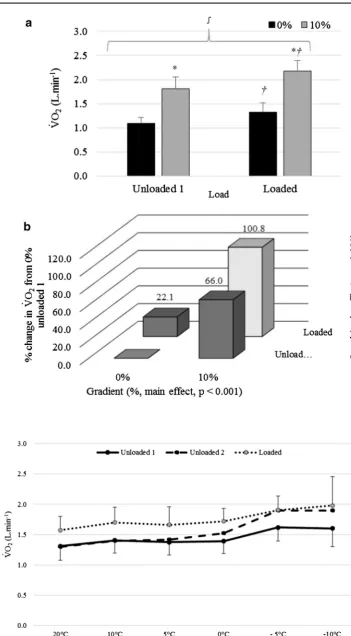
Further analysis comparing unloaded 1 and loaded condi-tions showed a significant interaction between load and gra-dient (p = 0.013, ηp2 = 0.475, Fig. 2a). Figure 2a shows that
gradient had a greater impact than backpack load on V̇O2.
The effect of load was greater at 10% gradient (mean differ-ence = 0.37 L · min−1) than when compared to the change
at 0% (mean difference = 0.24 L · min−1). In addition,
the effect of gradient was greater when participants were loaded than when unloaded (mean difference = 0.85 and 0.72 L · min−1, respectively). This interaction can be
cat-egorised as a synergistic increase (hyper-additive, Fig. 1b). Figure 3 shows the interactions between the tempera-ture and the three load conditions. The pattern of response was similar between unloaded 1 and loaded walking. This was confirmed by no significant two-way or three-way interactions (p ≥ 0.127, ηp2 ≤ 0.168). There was a
significant interaction between temperature and load (p = 0.011, ηp2 = 0.268) when comparing walking loaded
with unloaded 2. At warmer temperatures, as expected, loaded and unloaded 2 exercise bouts produced different V̇O2 values, due to the effect of load. However, at colder ambient temperatures (−5 °C or −10 °C), V̇O2 values were similar for the second unloaded exercise and when carry-ing the 18.2 kg load. Figure 4a shows that a combination of decreasing temperature and increasing load produced an antagonistic (hypo-additive) interaction, including an increase of 47.3 ± 36.8% from 20 to −10 °C for unloaded 2, an increase of 21.2 ± 5.8% when backpack load was added and a combined increase of 53.5 ± 29.9% in V̇O2 at
−10 °C for loaded compared to unloaded 2 at 20 °C. There was also a significant interaction between temperature and load (p < 0.001, ηp2 = 0.392) when comparing unloaded 1
with unloaded 2 walking. The interaction is indicated by no differences at higher temperatures in contrast to the colder ambient temperatures (−5 and −10 °C) which produced higher V̇O2 values that were consistent with the loaded condition. At −10 °C, the mean difference between the two unloaded conditions was 0.29 ± 0.36 L · min−1
com-pared to −0.01 ± 0.09 L · min−1 at 20 °C. Figure 4b shows
that a combination of low temperature and prolonged exposure (unloaded 2) produced a hyper-additive interac-tion. This comprised of an increase of 23.3 ± 18.1% from 20 to −10 °C for unloaded 1, a 0.5 ± 7.4% decrease from unloaded 1 to unloaded 2 at 20 °C, with an increase of 46.5 ± 37.4% in V̇O2 at −10 °C for unloaded 2 compared to
unloaded 1 at 20 °C (mean difference = 0.59 L · min−1).
Heart rate
HR values for some participants contained outliers, there-fore, they were removed from the analysis, so n = 8. As for V̇O2, HR varied significantly across the three loaded conditions (p < 0.001, ηp2 = 0.800) and was significantly
greater for loaded walking compared to unloaded walk-ing (p ≤ 0.001). HR was also significantly greater when walking uphill compared to level ground (p < 0.001,
ηp2 = 0.925). In contrast to V̇O
2, ambient temperature
did not significantly affect HR responses (p = 0.377,
ηp2 = 0.136, Fig. 1). In addition, when comparing unloaded
1 and unloaded 2, there were no significant differences in heart rate with temperature (p = 0.366, ηp2 = 0.138).
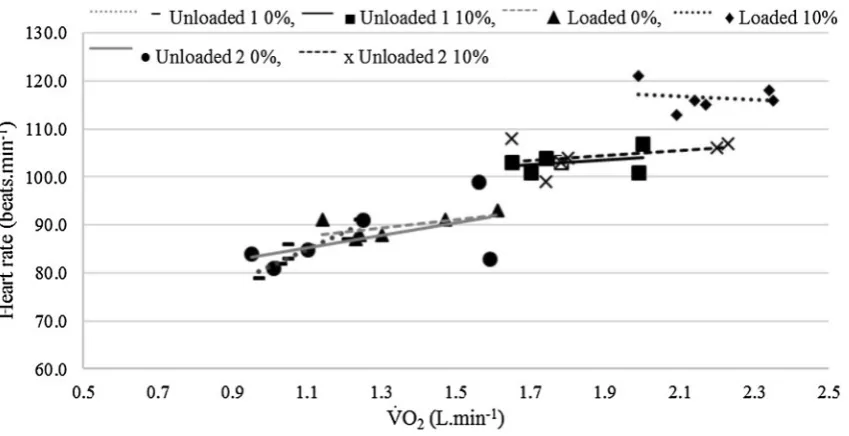
Fig-ure 5 shows that across all conditions, the HR increased with V̇O2, as would be expected. However, within each of
Fig. 1 Mean + SD V̇O2
values (L · min−1) and HR
(beats · min−1) for the different
ambient temperatures averaged across all gradients and loads,
asterisk denotes a significant difference to 20 °C, dagger
denotes a significant difference to 10 °C, and section symbol
[image:6.595.179.543.55.247.2]Fig. 2 Mean ± SD V̇O2
(L · min−1) responses for
Unloaded 1 and Loaded at 0 and 10% gradient averaged across all ambient temperatures.
Asterisk denotes a significant difference to 0% responses for the same load, dagger denotes a significant difference to unloaded responses for the same gradient, and integral symbol
denotes an interaction effect for gradient × load. b Interac-tion showing mean percentage change in V̇O2 (L · min−1)
from 0% gradient, unloaded 1, averaged across all ambient temperatures
Fig. 3 Mean ± SD V̇O2
(L · min−1) response for
[image:7.595.183.535.42.679.2]Fig. 4 Interactions showing mean percentage change in V̇O2 (L · min−1) from 20 °C,
unloaded 2 (a) and from 20 °C unloaded 1 (b) averaged across all gradients
[image:8.595.192.543.53.440.2] [image:8.595.88.513.475.693.2]the conditions across the five different temperatures HR did not increase with V̇O2 in a systematic or consistent way as
indicated by the line of best fit for each load and gradient condition in Fig. 5. For example, unloaded 1 0% shows a strong relationship between V̇O2 and HR (r = 0.91). In con-trast, unloaded 2 at 10% shows a much weaker relationship (r = 0.37), accounting for only 14% of the variance. This is because the HR response at −5 and −10 °C is no differ-ent to the responses for higher temperatures, yet the V̇O2 increased by 1.0 L · min−1 from the warmest to the coldest
temperature.
Peripheral and core temperatures
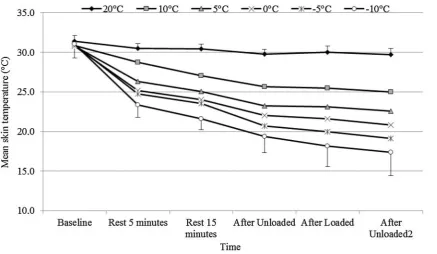
Skin temperature was recorded for 10 out of the 11 partici-pants. Figure 6 shows that mean skin temperature (MST) was significantly reduced with decreasing temperature (p < 0.001, ηp2 = 0.931). Similarly, there was a significant
effect of time with baseline readings being significantly higher than those towards the end of exposure despite par-ticipants exercising (p < 0.001, ηp2 = 0.966). Figure 6 also
demonstrates an interaction effect for temperature and time (p < 0.001, ηp2 = 0.748) showing a greater reduction in MST
over time at colder ambient temperatures.
Core temperature decreased slowly throughout the −10 °C exposure by 0.75 ± 0.6 °C from a baseline value of 37.41 ± 0.45 °C.
Kinematics
Effect of gradient
Walking uphill caused SL to be significantly greater than for level walking; 1.25 ± 0.08 m for 0% and 1.29 ± 0.10 m for 10% grade, demonstrated by a main effect of gradient (p = 0.008, ηp2 = 0.564). Similarly, an increase in
gradi-ent also elicited a significantly greater trunk forward lean (TFL, ~4.43°) in all three gait phases (p < 0.001, ηp2 ≥
0.941).
Effect of load
There was no main effect of load across the three load conditions on SL (p = 0.871, ηp2 = 0.015), however,
back-pack load caused TFL in all gait phases to be significantly greater regardless of temperature (p < 0.001, ηp2 = 0.780).
Effect of temperature
As ambient temperature decreased, SL significantly decreased (p = 0.005, ηp2 = 0.300). Combining
gradi-ents and loads, SL at 20 °C measured 1.29 ± 0.10 m com-pared to 1.25 ± 0.10 m at −10 °C. Post-hoc tests revealed a significant difference between 5 °C and −5 °C (mean difference = −0.024 m, p = 0.041). There were no sig-nificant interactions between temperature, with load or
[image:9.595.85.523.440.694.2]gradient (p ≥ 0.110) or a three-way interaction (p = 0.274,
ηp2 = 0.122).
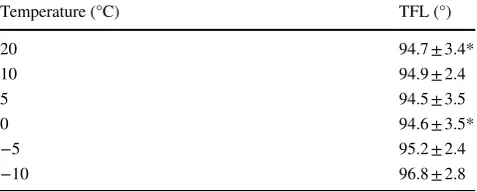
There were mixed results regarding temperature and TFL. Mid-stance showed no significant differences (p = 0.115, ηp2 = 0.174) between the different ambient
tem-peratures. In contrast, measurements for left heel strike showed that participants leaned further forward at colder temperatures (a significant main effect for temperature:
p = 0.029, ηp2 = 0.235). Left toe-off showed a trend for
greater TFL at colder temperatures (p = 0.054, ηp2 = 0.209).
Table 2 shows the main effect of temperature during left heel strike. There were no reported interactions for temper-ature with load or gradient with regard to TFL (p ≥ 0.299,
ηp2 ≤ 0.111).
Interaction effects
A significant interaction for SL between load and gradi-ent was reported when comparing unloaded 1 and loaded conditions (p = 0.001, ηp2 = 0.656). The effect of
gradi-ent on SL was greater than that of backpack load. When a combination of both load and gradient occurred, SL was increased by 3.7 ± 4.3% above unloaded 0% walking. This was classified by Lloyd and Havenith (2016) as a hypo-additive (antagonistic) interaction, as gradient and loaded separately caused a 4.9 ± 3.7% and 1.4 ± 2.1% increase in SL, respectively. In contrast to V̇O2, when comparing the
two unloaded conditions, prolonged exposure to lower ambient air temperatures had no effect on SL, as demon-strated by a non-significant interaction between tempera-ture and load (p = 0.232, ηp2 = 0.137).
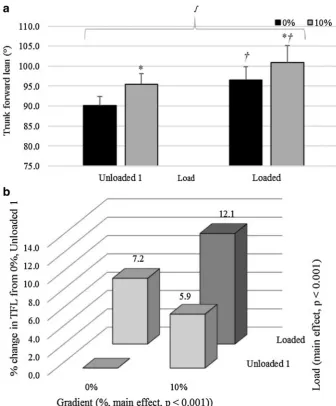
At left toe-off, when comparing unloaded 1 and loaded conditions, there was an interaction effect between load and gradient for TFL, as shown in Fig. 7a (p = 0.037,
ηp2 = 0.367). Figure 7a shows that backpack load had a
greater effect on TFL than gradient. Figure 7b shows that the two conditions together (load and 10% incline com-bined) caused an additive relative effect (percentage
increase, 7.2 ± 4.0% increase for load, 5.9 ± 1.7% increase for gradient, and 12.1 ± 4.7% increase when combined).
Discussion
Oxygen consumption
The first novel finding in this study was that the effect of load was not significantly different between the different ambient temperatures. Walking with an 18.2 kg backpack at −10 °C elicited a similar absolute ΔV̇O2 response to that at 20 °C for both level and uphill walking.
The increases in V̇O2 seen during both the two unloaded
and loaded exercise bouts at sub-zero temperatures com-pared to thermo-neutral and cool temperatures indicate that the submaximal oxygen consumption was higher in the cold environment. The findings from this study add to the body of literature to show at what temperatures V̇O2 is
significantly affected. Our results support the findings of Sandsund et al. (1998) who found that during cold exposure (−15 °C), V̇O2 was significantly higher (by 10.8%) during
submaximal running exercise intensities. This is a smaller percentage increase compared to the present findings as the current study found on average, V̇O2 was 20.5% higher at −10 °C compared to 20 °C. Differences in the effect on V̇O2
could be due to the higher exercise intensities employed, as Sandsund et al. (1998) averaged V̇O2 over running intensi-ties of 50–95%V̇O2max. Studies have shown that as exercise intensity increases, the effect of the cold becomes less-ened due to an increase in heat production from the exer-cise (Pugh 1967). The results from the present study are also in agreement with findings by Oksa et al. (2004), who showed that at a workload of 25%V̇O2max, V̇O2 was
signifi-cantly higher during cold exposure (−15 °C) than at 20 °C (p < 0.05). Similarly, when exercising at 50%V̇O2max, in 0 and −15 °C conditions, V̇O2 significantly increased almost linearly when compared to results at 20 °C. Whilst V̇O2 was
greater in the cold, reflecting findings by Oksa et al. (2004), the increase in V̇O2 was not linear. Results from the pre-sent study did differ to the previous findings as Oksa et al. (2004) reported that heart rate results mirrored those of V̇O2 at both intensities, whereas our findings showed that
heart rate did not change in proportion to changes in V̇O2 with temperature. The participants in the study by Oksa et al. (2004) wore layered clothing weighing up to 4.9 kg at −15 °C. It is unclear how much of an effect this additional weight had on V̇O2, but it would be expected to increase it in absolute terms, although not relative to total mass, but this could explain the increased heart rate response found by Oksa et al. (2004).
The reasons for a higher V̇O2 response during cold exposure are likely due to reduced mechanical efficiency
Table 2 Mean ± SD Trunk forward lean (°) during left heel strike
for all environmental temperatures averaged across all gradients and loads
*Denotes a significant difference to −10 °C (p < 0.05)
Temperature (°C) TFL (°)
20 94.7 ± 3.4*
10 94.9 ± 2.4
5 94.5 ± 3.5
0 94.6 ± 3.5*
−5 95.2 ± 2.4
[image:10.595.51.290.607.703.2]and thus increased co-activation of muscle pairs. Muscle strength has been previously demonstrated to be reduced during cold exposure and has been attributed to a number of factors including slowed calcium uptake, ATP utilisa-tion and a reducutilisa-tion in cross-bridge force kinetics (Oksa et al. 2004). Wakabayashi et al. (2015) reported that dur-ing exercise in the cold, EMG amplitude has been shown to be increased. This evidence suggests that to maintain the same walking speed of 4 km · h−1, participants may have
recruited more muscles fibres as the more superficial mus-cle fibres become weakened by the cold (Oksa 2002; Cas-tellani and Tipton 2016). If more motor units are employed to meet the exercise demands this will increase V̇O2 as reflected in the present study by greater V̇O2 values at −10
and −5 °C.
Another likely cause for elevated V̇O2 associated with
cold exposure is shivering in an attempt to maintain core temperature (Doubt 1991). The unparalleled activation
of skeletal muscle fibres generates heat, increasing the requirement for carbohydrate oxidation which results in quicker glycogen depletion. The exercise intensity when walking with a load, however, was above the estimated 1.5 L · min−1 threshold for the shivering response;
there-fore, it is unlikely that this was the only explanation (Sand-sund et al. 1998). In the present study and in agreement with Ito et al. (2013) and Castellani and Tipton (2016), the absence of overt shivering observed during exercise in some conditions combined with small change in deep body temperature and increased V̇O2 could be attributed
to the generation of heat through non-shivering thermo-genesis (NST). BAT releases norepinephrine which causes the breakdown of triglycerides, releasing fatty acids which in turn activates an uncoupling protein (UCP1) (Neder-gaard et al. 2011). Substrate oxidation is then uncoupled or dissociated from the production of ATP, leading to an increased heat production (Cannon and Nedergaard 2004).
Fig. 7 a Mean ± SD TFL (°)
during toe-off for Unloaded 1 and Loaded at 0 and 10% gradi-ent averaged across all ambigradi-ent temperature. Asterisk denotes a significant difference to 0% responses for the same load, and
dagger denotes a significant dif-ference to unloaded responses for the same gradient. Integral symbol denotes an interac-tion effect for gradient × load.
[image:11.595.202.539.54.461.2]Calorigenic hormones increase the oxygen consumption in most cells, increasing the basal metabolic rate, reflected as elevated V̇O2 during exposure to the cold (Ito et al.
2013). The contribution of NST to the whole body meta-bolic response is not fully understood, and Ouellet et al. (2012) reported a 1.8-fold increase in energy expenditure in participants after cold exposure. Total energy expendi-ture increased from 125.6 W (0.36 L · min−1) to 222.6 W
(0.64 L · min−1), causing an average increase in V̇O 2 of
~0.3 L · min−1. This was during an experiment conducted
at a water temperature of 18 °C, and the contribution to energy expenditure during cold air temperatures should be considered in future research. Researchers, however, have concluded that BAT undoubtedly contributes to a cold-induced increase in energy expenditure and both NST and shivering contribute to the whole body metabolic response (Ouellet et al. 2012). The two mechanisms, thermogen-esis and neuromuscular changes, do not work in isolation. Increased shivering and NST, particularly in the antagonist muscle, will also reduce mechanical efficiency. This occurs principally due to the increased requirement of the agonist muscle to produce a larger force/power output and thereby increased oxygen consumption to compensate for a higher antagonist/ joint resistance when the muscle becomes cold (Oksa 2002). The colder the ambient temperature, the greater the decrease in superficial muscle temperature meaning a greater reduction in muscle strength and blood flow, at least to superficial areas (Oksa et al. 2004). Vaso-constriction reduces blood flow to the muscle, and thus, oxygen delivery to working muscles may be reduced, lead-ing to an earlier switch to anaerobic metabolism (Sandsund et al. 1998; Ito et al. 2013; Castellani and Tipton 2016). This combined with an increase in carbohydrate utilisation due to shivering would increase the accumulation of lac-tic acid, impairing performance and inducing fatigue (Jett et al. 2006). Muscle temperature was not measured in the present study; therefore, there is need for further work to evaluate this response.
The second novel finding from this investigation was the effect of prolonged exposure in the cold on V̇O2 as highlighted though the interaction between tempera-ture and load. At sub-zero temperatempera-tures, the second bout of unloaded exercise elicited a significantly higher V̇O2
response to the first unloaded bout which was not observed when exercising at temperatures of 0 °C and above. This finding can be attributed to both mechanisms described pre-viously, as the greater the time spent in the cold, the lower the core and skin temperature. This would elicit greater responses from defence mechanisms, such as shivering and additional recruitment of motor units to sustain workload and prevent hypothermia. This finding would support an increase in the %V̇O2max that individuals would be working at when exercising in conditions of cold exposure which
would induce faster fatigue and could lead to early termina-tion of load carriage exercise. It could be suggested that the V̇O2 values shown when loaded at sub-zero temperatures
could be affected by cold exposure too, as this bout of exer-cise occurs after unloaded 1 and the body would have had time to cool. However, the data in the present study show that this is very unlikely due to the effect of loading being stable across the temperatures, as shown in Fig. 3.
Gradient had a greater impact on V̇O2 than backpack load did. This can be attributed to the vertical work done during exercise on a gradient causing a greater increase in metabolism than extra load alone, as the body has to work to produce both horizontal movement and movement against gravity (Santee et al. 2001).
Heart rate
There is no universally accepted response of HR to cold exposure. Within the literature, HR during submaximal exercise has been shown to decrease (e.g., Kruk et al. 1991; Spitz et al. 2014), increase (Oksa et al. 2004), or remain unchanged (e.g., Patton and Vogel 1984). Results from this study support the latter, as decreasing ambient temperature had no effect on HR responses. Vasoconstriction is likely to have occurred due to significant reductions in MST shown in the lower ambient temperatures; however, this had no effect on HR. It could be suggested that exposure time in the present study was not sufficient for the cold to influ-ence HR. However, the duration of the protocol in the pre-sent study was 50–60 min, depending on the length of rest periods. Spitz et al. (2014) employed protocols of a similar duration (~60 min), and yet, they reported significant dif-ferences in HR responses. In addition, those authors did not use temperatures as cold as those in the present study. Con-sequently, protocol duration is unlikely to have been the sole reason for no change in HR. A difference in exercise intensity, exercise modality, or body composition could have influenced results.
Biomechanical factors
Load reduces SL when walking on the horizontal and is regarded advantageous due to the decrease in stress on the bones of the foot (Knapik et al. 1996; Lloyd and Cooke
2011). However, most of the literature has reported only small decreases, and in the present study, no differences were found. In agreement with V̇O2 data, gradient caused a
This can be attributed to load affecting the CoM of an indi-vidual to a greater extent than gradient, causing partici-pants to alter their posture to maintain stability (Singh and Koh 2009; Simpson et al. 2011).
Finally, the present study is able to add to the very lim-ited evidence on changes in gait characteristics with ambi-ent temperature. We found a reduction in SL to maintain the constant walking speed. Changes in spatiotemporal parameters could be attributed to the decrease in muscle tendon elasticity that occurs with decreasing temperature. Folland et al. (2006) proposed that stiffer tendons could reduce the amount of stored energy involved in the eccen-tric loading phase of running/walking which would reduce the net impulse distributed to the runner, decreasing stride length. For the runner or walker to sustain their speed, the solution would be to increase SF. Our results confirm find-ings by Folland et al. (2006) who showed that their cold trial caused significant increases in SF and concurrent decreases in SL when compared with gait parameters in thermo-neutral and hot conditions. They reported reduc-tions of 0.04 m in SL in line with the reducreduc-tions reported in the present study. Their cold exposure however was a pre-cooling exposure in water, and to date, there are no pub-lished investigations in cold air exposure on stride param-eters, and this is the first study to report such findings.
A different mechanical response was demonstrated when walking uphill, which increased SL. This is in agreement with the few studies investigating stride parameters on var-ying gradients (Kawamura et al. 1991; Leroux et al. 2002; Fellin et al. 2016) yet in contrast to findings by McIntosh et al. (2006) who reported the opposite, with a decrease in SL as gradient increased from −10° to 0°. McIntosh et al. (2006) suggested the difference in their findings to other studies could be attributed to the length of the short walk-way used to collect data (7 m) preventing participants from finding their normal gait pattern.
While temperature and gradient produced different responses in SL, both conditions produced significant increases in TFL. It has been suggested by Leroux et al. (2002) that as gradient increases, the momentum of the lower legs must also increase to overcome gravity, resulting in increases in SL. In this case, increased TFL is benefi-cial to the development of momentum in the lower limbs as moving body weight forward of the hip aids flexion of the hip. However, increased TFL can also be an adaptive response to decreased SL, particularly if muscle function is compromised (Li et al. 2013) as suggested in cold expo-sure conditions (Folland et al. 2006). Increasing TFL has the effect of moving the ground reaction force line anterior to the knee thereby aiding stability in the knee extensor-plantar flexion couple mechanism during limb loading (Kirtley 2006). The significant increases in TFL observed in the current study at left heel strike and left toe-off during
cold exposure correspond with limb loading events in the gait cycle.
Previous studies reporting the effect of load on stride parameters are somewhat equivocal. Some authors have reported increases in SL with increasing load (e.g. Lloyd and Cooke 2011), whilst others report decreases in SL (Knapik et al. 1996; Harman et al. 2000). Knapik et al. (1996) proposed that a reduction in SL is advantageous due to the decrease in stress on the bones of the foot. The present findings associated with SL and load were similar to other studies, where no significant changes for SL were observed with increasing load (e.g., Singh and Koh 2009).
Phillips et al. (2016b) reported disproportional increases in V̇O2 with systematic increases in gradient when
partici-pants were walking at a constant speed. It was suggested that biomechanical changes, such as increased forward lean, were primarily responsible for these responses as TFL increased the muscle activity in the abdominals and lower back, which in turn required a greater V̇O2 (Phillips
et al. 2016b). Biomechanical variables were not measured in the study by Phillips et al. (2016b); thus, the authors suggestions were purely speculative. The results from the present study show that although the oxygen cost of walk-ing uphill with a load was disproportionately greater, the suggestion that this could be attributed to TFL alone can be refuted. The present study found that the change in TFL from the unloaded to loaded condition was greater during level walking than at a 10% gradient, whereas the effect of gradient upon V̇O2, was greater when unloaded compared with loaded walking. Biomechanical changes could indeed be responsible for the disproportional increases in V̇O2;
however, the mechanism would appear to be more complex than simply increased TFL alone.
Practical application
Understanding how load carriage affects physiological responses can provide information on how best to prepare for situations, where load carriage is a feature of the exer-cise challenge, such as in trekking or mountaineering. In terms of cold exposure, being inadequately dressed in cold environments would induce fatigue due to an increased V̇O2 response and a probable reduction in muscle strength
should adjust their training regimes to account for the extra energy requirement associated with exercising in cold ambient temperatures and/or with a load. Due to colder temperatures eliciting a greater V̇O2 response, individu-als would be recommended to train at a higher intensity. At −10 °C, walking with a load required an extra average oxygen consumption of ~0.41 L · min−1 when compared to
loaded walking at 20 °C and an extra ~0.67 L · min−1 when
compared to unloaded walking at 20 °C.
Limitations
Core temperature pills were only given for trials at −10 °C as a safety measure to ensure participants did become hypo-thermic. Ideally core temperature pills would have been used throughout; however, due to logistical reasons, this was not possible. For future work, measuring core tempera-ture in all trials to see the effect of the protocol for a range of different ambient temperatures should be considered. In addition, no V̇O2max data were collected for participants. The effect of cold exposure on V̇O2max is well reported, but findings are inconsistent. Nonetheless, the majority of liter-ature suggests that V̇O2max does not change with a decrease
in ambient temperature (Sandsund et al. 2012); therefore, as the effect of load did not change across the different ambi-ent temperatures, it could be hypothesised that %V̇O2max
would be similar also. The same backpack was used for all participants; future work may consider using one model with various sizes, so that the pack can be custom fitted to each participant. The brief exercise bouts were also a limi-tation, but due to technical issues of freezing sample lines during cold exposure, exercise periods were kept to 14 min. As mentioned previously, Lloyd and Cooke (2000) and the current data showed that this time period was sufficient in establishing steady state.
Conclusion
The evidence leads to a rejection of the first hypothesis as the results of this investigation show that ambient tempera-ture had no significant effect on the increase in oxygen con-sumption associated with load carriage. The V̇O2 increase
from unloaded to loaded walking for warm ambient tem-peratures is similar to that of very cold temtem-peratures. How-ever, the second hypothesis can be accepted, as a decrease in temperature elicited an increase in oxygen uptake. Pro-longed exposure to the cold also saw V̇O2 significantly increase, with the second bout of unloaded exercise produc-ing significantly higher V̇O2 in sub-zero temperatures than
the first. The hypothesis regarding SL can also be rejected, as although increasing gradient elicited greater SL, increas-ing load and decreasincreas-ing temperature did not interact with
gradient to give a greater SL. SL decreased in colder tem-peratures, with load having no effect on SL.
Future research could focus on the magnitude and time course of the effect of prolonged exposure in the cold on increasing V̇O2 to establish if subsequent loaded periods would produce further significantly increases in V̇O2.
Compliance with ethical standards
Conflict of interest The authors declare that they have no conflict
of interest.
Open Access This article is distributed under the terms of the
Creative Commons Attribution 4.0 International License (http:// creativecommons.org/licenses/by/4.0/), which permits unrestricted use, distribution, and reproduction in any medium, provided you give appropriate credit to the original author(s) and the source, provide a link to the Creative Commons license, and indicate if changes were made.
References
American College of Sports Medicine (2013) ACSM guidelines for exercise testing and prescription. 9th edn. Lippincott Williams & Wilkins, Baltimore
Cannon B, Nedergaard J (2004) Brown adipose tissue: function and physiological significance. Physiol Rev 84(1):277–359
Castellani JW, Tipton MJ (2016) Cold stress effects on exposure toler-ance and exercise performtoler-ance. Compr Physiol 6:443–469 Doubt TJ (1991) Physiology of exercise in the cold. Sports Med
11(6):367–381
Faghy M, Brown P (2014) Thoracic load carriage-induced respiratory muscle fatigue. Eur J Appl Physiol 114(5):1085–1093
Fellin RE, Seay JF, Gregorczyk KN, Hasselquist L (2016) Spatiotem-poral parameters are not substantially influenced by load carriage or inclination during treadmill and overground walking. J Hum Kinet 50(1):27–35
Folland JP, Rowlands DS, Thorp R, Walmsley A (2006) Leg heating and cooling influences running stride parameters but not running economy. Int J Sports Med 27(10):771–779
Givoni B, Goldman R (1971) Predicting metabolic energy costs. J Appl Physiol 30(3):429–433
Grenier J, Peyrot N, Castells J, Oullion R, Messonnier L, Morin JB (2011) Energy cost and mechanical work of walking during load carriage in soldiers. Med Sci Sports Exerc 44(6):1131–1140 Hainsman MF (1988) Determinants of load carrying ability. Appl
Ergon 19(2):111–121
Harman, E. Hoon Han, K. Frykman, P. and Pandord, C (2000) The effects of backpack weight on the biomechanics of load carriage. (Tech. Rep. TOO-17). Natick. U.S. Army Research Institute of Environmental Medicine, MA
Ito R, Nakano M, Yamane M, Amano M, Matsumoto T (2013) Effects if rain on energy metabolism while running in a cold environ-ment. Int J Sports Med 34(8):707–711
Jett DM, Adams KJ, Stamford BA (2006) Cold exposure and exercise metabolism. Sports Med 36(8):643–656
Kawamura K, Tokuhiro A, Takechi H (1991) Gait analysis of slope walking: a study on step length, stride width, time factors and deviation in the centre of pressure. Acta Med Okayama 45(3):179–184
Knapik J, Harman E, Reynolds K (1996) Load carriage using back-packs: a review of physiological, biomechanical and medicine aspects. Appl Ergon 27(3):207–216
Kruk B, Pekkarinen H, Manninen K, Haenninen O (1991) Compari-son in men of physiological responses to exercise of increasing intensity at low and moderate ambient temperatures. Eur J Appl Physiol Occup Physiol 62(5):353–357
Leroux A, Fung J, Barbeau H (2002) Postural adaptation to walking on inclined surfaces: normal strategies. Gait Posture 15(1):64–74 Levine D, Richards J, Whittle MW (2012) Whittle’s gait analysis,
5th edn. Churchill Livingstone, Elsevier, London
Li K, Ackland DC, McClelland JA, Webster KE, Feller JA, de Steiger R, Pandy MG (2013) Trunk muscle action compensates for reduced quadriceps force during walking after total knee arthro-plasty. Gait Posture 38(1):79–85
Lloyd R, Cooke CB (2000) The oxygen consumption associated with unloaded walking and load carriage using two different backpack designs. Eur J Appl Physiol 81(6):486–492
Lloyd R, Cooke C (2011) Biomechanical differences associated with two different load carriage systems and their relationship to economy. Hum Mov 12(1):65–74
Lloyd A, Havenith G (2016) Interactions in human performance: an individudal and combined stressors approach. Temperature 3(4):514–517
McIntosh AS, Beatty KT, Dwan LN, Vickers DR (2006) Gait dynam-ics on an inclined walkway. J Biomech 39(13):2491–2502 Nedergaard J, Bengtsson T, Cannon B (2007) Unexpected evidence
for active brown adipose tissue in adult humans. Am J Physiol Endocrinol Metabol 293(2):E444–E452
Nedergaard J, Bengtsson T, Cannon B (2011) Three years with adult human brown adipose tissue. Ann N Y Acad Sci 1212(1):E20–E36
Oksa J (2002) Neuromuscular performance limitations in the cold. Int J Circumpolar Health 61(2):154–162
Oksa J, Kaikkonen H, Sorvisto P, Vaappo M, Martikkala V, Rintamäki H (2004) Changes in maximal cardiorespiratory capacity and submaximal strain while exercising in cold. J Therm Biol 29(7–8):815–818
OnTop Ltd (2014) Monte Rosa Peaks Traverse. [Online] Canada; OnTop Ltd. Available from: http://www.ontopmountaineering. com/monterosa.php. Accessed 02 Dec 2014.
Ouellet V, Labbé S, Blondin D, Pheonix S, Guérin B, Haman F, Tur-cotte E, Richard D, Carpentier A (2012) Brown adipose tissue oxidative metabolism contributes to energy expenditure during acute cold exposure in humans. The Journal of Clinical Investi-gation 122(2):545–552
Parsons K (2003) Human thermal environments, 2nd edn. Taylor and Francis, London
Patton JF, Vogel JA (1984) Effects of acute cold exposure on sub-maximal endurance performance. Med Sci Sports Exerc 16(5):494–497
Phillips DB, Ehnes CM, Stickland MK, Petersen SR (2016a) The impact of thoracic load carriage up to 45 kg on the cardiopulmo-nary response to exercise. Eur J Appl Physiol, pp 1–10
Phillips DB, Stickland MK, Lesser IA, Petersen SR (2016b) The effects of heavy load carriage on physiological responses to graded exercise. Eur J Appl Physiol 116(2):275–280
Pugh L. G.(1967) Cold stress and muscular exercise, with special ref-erence to accidental hypothermia. Br Med J 2(5548):333–337 Quesada PM, Mengelkoch LJ, Hales RC, Simon SR (2000)
Biome-chanical and metabolic effects of varying backpack loading on simulated marching. Ergonomics 43(3):293–309
Ramanathan NL (1964) A new weighting system for mean surface temperature of the human body. J Appl Physiol 19(3):531–533 Renburg J, Sandsund M, Wiggen, Ø. N, Reinertsen RE (2014) Effect
of ambient temperature on female endurance performance. J Therm Biol 45:9–14
Sandsund M, Sue-Chu M, Helgerud J, Reinertsen RE, Bjermer L (1998) Effect of cold exposure (−15 degrees C) and salbutamol treatment on physical performance in elite nonasthmatic cross-country skiers. Eur J Appl Physiol Occup Physiol 77(4):297–304 Sandsund M, Saursaunet V, Wiggen, Ø., Renberg J, Færevik H,
Beekvelt M (2012) Effect of ambient temperature on endurance performance while wearing cross-country skiing clothing. Eur J Appl Physiol 112(12):3939–3947
Santee, W., Blanchard, L., Small, M., Gonzalez, J., Matthew, W. and Speckman, K. (2001) The impact of load and grade in energy expenditure during load carriage, Part II: Field study. US Army Medical Research and Material Command, pp 1–26
Simpson KM, Munro BJ, Steele JR (2011) Effect of load mass on pos-ture, heart rate and subjective responses of recreational female hikers to prolonged load carriage. Appl Ergon 42(3):403–410 Singh T, Koh M (2009) Effects of backpack load on spatiotemporal
parameters and trunk forward lean. Gait Posture 29(1):49–53 Spitz MG, Kenefick RW, Mitchell JB (2014) The effects of elapsed
time after warm-up on subsequent exercise performance in a cold environment. J Strength Cond Res 28(5):1351–1357 Timmons BA, Araujo J, Thomas TR (1985) Fat utilization enhanced
by exercise in a cold environment. Med Sci Sports Exerc 17(6):673–678