http://dx.doi.org/10.4236/ars.2015.43020
Vegetation Cover Density and Land Surface
Temperature Interrelationship Using
Satellite Data, Case Study of Wadi Bisha,
South KSA
Amalyahya Alshaikh
King Abdulaziz University, Jeddah, Saudi Arabia Email: [email protected]
Received 25 August 2015; accepted 27 September 2015; published 30 September 2015
Copyright © 2015 by author and Scientific Research Publishing Inc.
This work is licensed under the Creative Commons Attribution International License (CC BY).
http://creativecommons.org/licenses/by/4.0/
Abstract
The aim of this study is to identify the relationship between Vegetation Cover (VC) and the land Surface Temperature (LST), using satellite data of Wadi Bisha, south the Kingdome of Saudi Arabia (KSA). The Landsat 7 Thematic Mapper (ETM) thermal band (band 6) was used for calculating the (LST) values. The near-infrared (NIR) and red band (bands 3 and 4 respectively) were used for es-timating the vegetation cover. ERDAS Imagine 9.3 and ArcGIS 10.2 were used in the current study. The results of the study show that the increase of vegetation cover (VC) coincides with decrease of (LST), while the decrease in vegetation cover is linked with increase of (LST). It was found that there was no vegetation observed in areas practiced the highest temperature of 49˚C, while areas of lowest temperature of 28˚C were characterized by dense vegetation cover. Thus, a quite signifi-cant correlation is approved between the (VC) and the (LST), based on the validation of (50) loca-tions. It was concluded that availability and continuity of Satellite remote sensing data was re-quired for elaborating a continuous monitoring of vegetation cover conditions and mapping was recommended in Wadi Bisha. Operational monitoring is recommended to ensure the adoption of flexible land cover validation protocols.
Keywords
Relationship, Vegetation Cover (VC), Land Surface Temperature (LST), Satellite Data, Wadi Bisha (South KSA)
1. Introduction
processes on the Earth’s surface [1]. The importance of this study is to evaluate the use of remote sensed infor-mation, especially thermal bands to gain land surface temperature (LST), according to [2]. The LST values will be compared with vegetation cove density, extracted from the normalized difference vegetation index (NDVI). Land-surface temperature (LST) can be defined as the thermal emission from the landscape “surface”, including the top of the canopy, for vegetated surfaces, as well as other surfaces (e.g. bare soils). Jinn and Dickinson [3] referred that LST controlled the surface heat and water exchange with atmosphere. Estimation of LST, from tellites infrared radiometers, has been proven useful. Most studies have focused on the use of polar orbiting sa-tellite systems because of their high spatial resolution [4]. In estimation of LST from sasa-tellite thermal data, the digital number (DN) of image pixels needs to be converted into spectral radiance, using the sensor calibration data [5]. Landsat-7 Enhanced Thematic Mapper (ETM) scenes include a thermo band (band 6), which can detect thermal radiation released from objects on the earth surface, in addition to the red and near-infrared bands (band 3 and band 4). A vegetative index is a value derived from sets of remotely-sensed data that are used to quantify the vegetative cover on the Earth’s surface. The NDVI is calculated as a ratio between measured reflectivity in the red and near infrared portions of the electromagnetic spectrum. These two spectral bands are chosen because they are most affected by the absorption of chlorophyll in leafy green vegetation and by the density of green ve-getation on the surface. Also, in red and near-infrared bands, the contrast between veve-getation and soil is at a maximum [6]. In this study, Landsat 7 ETM was used in order to estimate LST over Wadi Bisha (South KSA) and compared it with vegetation cover.
2. Objectives
The main objective of the current study is to investigate the generality of the LST-NDVI relationship over a wide range of moisture and climatic/radiation conditions, through the following steps:
1) Estimate NDVI Value from Satellite Images, using red and near-infrared bands (band 3 and band 4 of Landsat ETM 7).
2) Calculation of Land Surface Temperature (LST) from Satellite remote sensing data using the thermal band (band 6).
3) Finding out the relationship between normalized difference vegetation index (NDVI) and the land Surface Temperature (LST) in WadiBisha.
3. Study Area
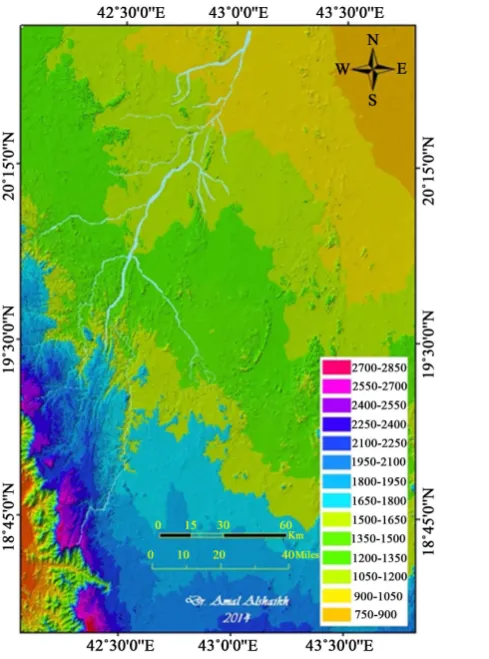
The study area is located at the South of the Kingdom of Saudi Arabia (KSA) as shown in (Figure 1). The study area is characterized by diversity of its natural terrain, including plains, mountains and valleys where graded re-gion height of (750 - 2850 m) above sea level (Figure 2).
4. Data
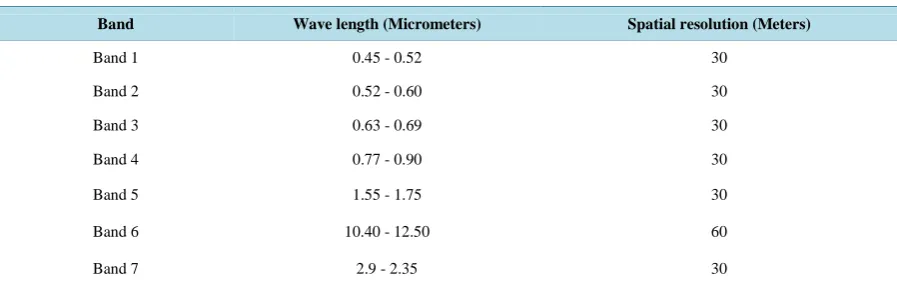
The ETM data used in this study were obtained from a remote sensing satellite (Landsat 7) launched by National Aeronautics and Space Administration (NASA) of USA. A number of two images were used (Figure 3), images characteristics [7] are shown in Table 1.
5. Methodology and Analyses
In order to achieve the objectives of this study, the activities were elaborated in six main stages, while conduct-ing subdividconduct-ing the study area “WADI BISHA” into 4 parts to facilitate the application and analyses.
5.1. Data Collection, Processing and Calibration of Raw Data and Geometric Correction
The image processing software system (Erdas Imagine 9.3) was used for the geometric correction; calibration and processing of raw satellite data [8].5.2. Conversion of Thermo Band Digital Number (DN) to Spectral Radiance (L)
Figure 1.Location map of study area (between (18˚ - 21˚) N longitude and (42˚ - 43˚) E latitude.
[image:3.595.204.449.378.708.2]Figure 3.Satellite images covering study area.
Table 1. Spectral characteristics of Landsat 7 ETM images.
Band Wave length (Micrometers) Spatial resolution (Meters)
Band 1 0.45 - 0.52 30
Band 2 0.52 - 0.60 30
Band 3 0.63 - 0.69 30
Band 4 0.77 - 0.90 30
Band 5 1.55 - 1.75 30
Band 6 10.40 - 12.50 60
Band 7 2.9 - 2.35 30
METADATA; SPACECRAFT_ID = “Landsat7”; SENSOR_ID = “ETM+”; ACQUISITION_DATE = 2000-08-24 and 2000-06-21; WRS_PATH = 167; WRS_ROW = 046 and 047; REFERENCE_DATUM = “WGS8”; REFERENCE_ELLIPSOID = “WGS84”; MAP_PROJECTION = “UTM (Universal Transverse Mercator)”; ZONE_NUMBER = +38.
be used to convert DN’s to radiance; the method depends on the scene calibration data available in the header file ([9] and [10]. One method uses the Gain and Bias (or Offset) values from the header file. The longer method uses the LMin and LMax spectral radiance scaling factors. The following formulas have been adapted from the USGS Landsat Users handbook [11].
A. Gain and Bias Method:
The formula to convert DN to radiance using gain and bias values is:
(
)
R DN
CV =G CV +B (1a)
where:
CVDN is the cell value digital number, G is the gain value for a specific band, B is the bias value for a specific band, B. LMin and LMax Method:
The formula to convert DN to radiance using Lmin and Lmax values is:
(
)
L=LMIN+ LMAX−LMIN ∗DN 255 (1b)
where:
L= Spectral radiance,
LMIN = (Spectral radiance of DN value 1), LMAX = (Spectral radiance of DN value 255), DN = Digital Number.
Table 2 lists these values for ETM band 6 for the two images
Using these values in Table 2 absolute radiance values can calculate for each pixel in the two images. It should be noticed that the radiance values are real numbers, while the DN values in Band 6 are integers.
5.3. Conversion of Spectral Radiance to Temperature in Kelvin
Once the DN’s values for the thermal bands have been converted to radiance values, it is simply a matter of ap-plying the inverse of the Planck function to derive temperature values.
The formula to convert radiance to temperature is:
(
)
{
}
2 1 R1
T=K Ln K ∗ε CV +1 (2)
where:
T= Effective at-satellite temperature in Kelvin, K2 = Calibration constant 2 from Table 3,
K1 = Calibration constant 1 from Table 3,
CVR1 = is the cell value as radiance,
ε = is emissivity (typically 0.95).
5.4. Conversion of Temperatures
The temperature values are estimated in degrees Kelvin, and are then converted to degree Celsius.
5.5. Calculation (NDVI) Values
A vegetative index is a value that is derived from sets of remotely-sensed data that is used to quantify the veget-ative cover on the Earth’s surface. The NDVI is calculated as a ratio between measured reflectivity in the red and near infrared portions of the electromagnetic spectrum. These two spectral bands are chosen because they are most affected by the absorption of chlorophyll in leafy green vegetation and by the density of green vegeta-tion on the surface. Also, in red and near-infrared bands, the contrast between vegetavegeta-tion and soil is at a maximum. The Thematic Mapper bands 3 and 4 provide red and near-infrared measurements respectively and therefore can be used to generate NDVI data sets with the following formula.
Table 2. Values of LMIN and LMAX for the Landsat 7 ETM.
Parameters LMIN LMAX
Landsat-7 ETM P/R-167/46 (2000-08-24) 3.200 12.65
Landsat-7 ETM P/R-167/47 (2000-06-21) 3.200 12.65
Table 3. Landsat 7 ETM thermal band calibration constants.
Satellite Constant 1-K1 watts/(meter squared/ster/µm) Constant 2-K2 Kelvin
(
) (
)
NDVI= NIR−RED NIR+RED(
) (
)
NDVI= Band4−Band3 Band4+Band3 (3)
5.6. Relationship between Vegetation Cover and (LST)
Software (ArcGIS-ArcInfo 10.0) were used to prepare maps that represent the relationship between vegetation cover and (LST) in addition to the preparation of all study result maps.
6. Results
6.1. VC and LST Pattern and Interrelationship in Wadi Pisha
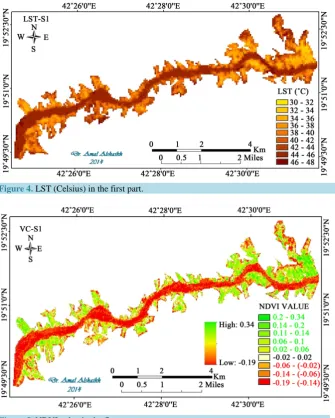
The relationship, between Vegetation Cover (VC) and (LST) of the Four Parts of Wadi Bisha, are presented in the following Figures, Tables, and graphs. Regarding the first part, Figure 4 & Figure 5 and Table 4 demon-strate the distribution of LST and VC respectively. Table 4demonstrates the relationship between the two pa-rameters. It is found that LST values range between 30˚C to 48˚C while NDVI values between 0.19 and 0.34. Figure 6 shows a negative correlation coefficient of −0.96 between the two parameters.
[image:6.595.148.484.295.714.2]Figure 4.LST (Celsius) in the first part.
Figure 6. Relationship between LST and NDVI at part 1.
[image:7.595.87.538.544.722.2]Figure 7.LST (Celsius) in the second part.
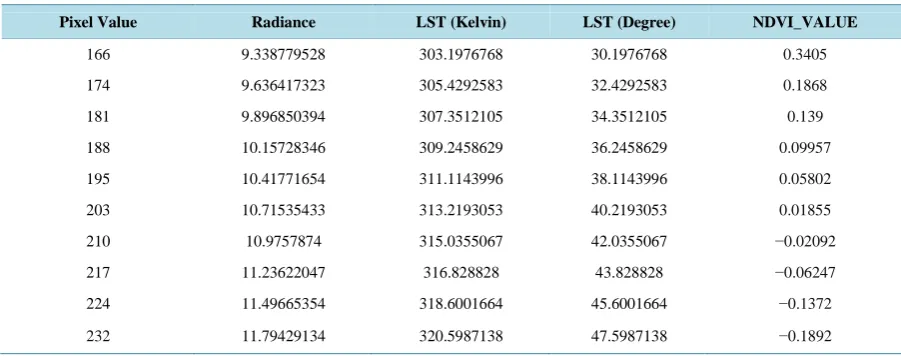
Table 4.LST and NDVI measurement at part 1.
Pixel Value Radiance LST (Kelvin) LST (Degree) NDVI_VALUE
166 9.338779528 303.1976768 30.1976768 0.3405
174 9.636417323 305.4292583 32.4292583 0.1868
181 9.896850394 307.3512105 34.3512105 0.139
188 10.15728346 309.2458629 36.2458629 0.09957
195 10.41771654 311.1143996 38.1143996 0.05802
203 10.71535433 313.2193053 40.2193053 0.01855
210 10.9757874 315.0355067 42.0355067 −0.02092
217 11.23622047 316.828828 43.828828 −0.06247
224 11.49665354 318.6001664 45.6001664 −0.1372
The first part is characterized as follow: LST (Kelvin) = (303.1976768 - 320.5987138). LST (Celsius) = (30˚C - 48˚C). NDVI Value (0.19 - 0.34). R = −0.98322. R2
= 0.966 (Figure 6).
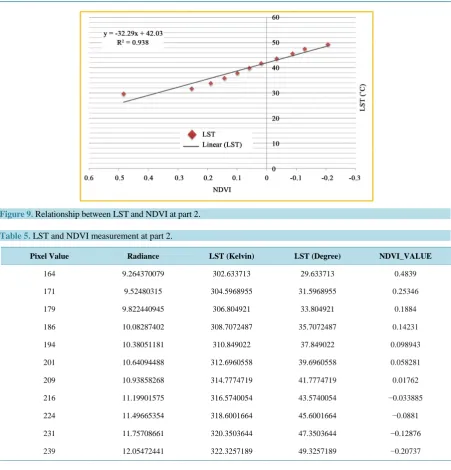
In regard with part 2 of Wadi Bisha, the distribution of LST and NDVI values are shown in Figure 7 and Figure 8 respectively. Table 5 demonstrates the values of the two parameters in different locations. It is found that LST ranges between 30˚C to 49˚C, while NDVI between 0.20 and 0.48. Table 5 and Figure 9 show that a negative correlation coefficient of 0.98 cauterizes the relation between the two parameters.
The second part is characterized as follow: (Figure 7and Figure 8) (Table 5). LST (Kelvin) = (302.633713 - 322.3257189). LST (Celsius) = (30˚C - 49˚C). NDVI Value (0.2 - 0.48). R = −0.96896. R2 = 0.938 (Figure 9).
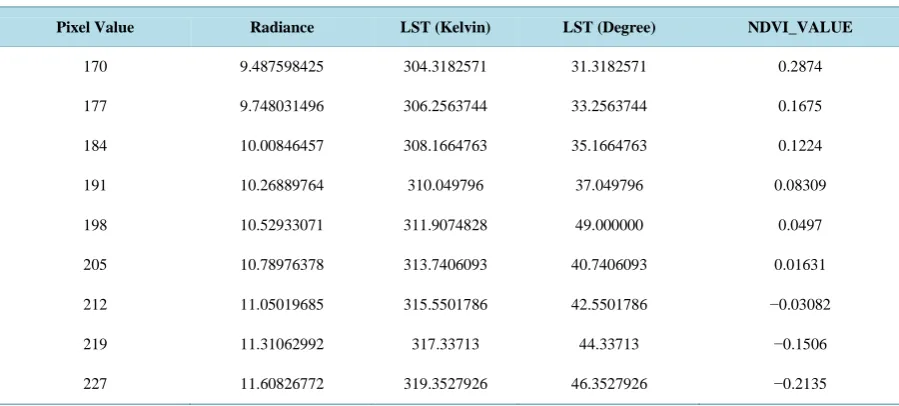
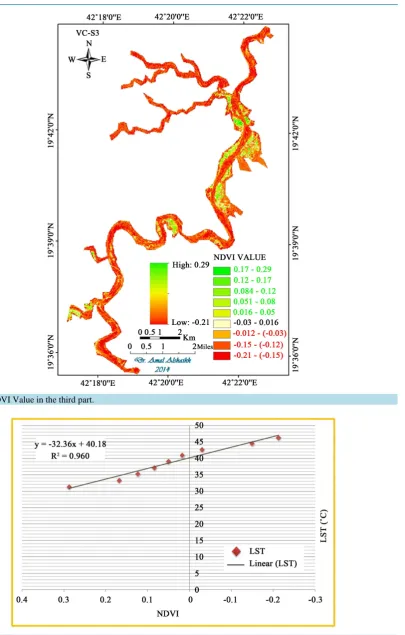
Distribution of LST and NDVI, at the third part 3 of Wadi Bisha, is shown in Figure 10 and Figure 11 re-spectively. Table 6 demonstrates the values of the two parameters in different locations. It is found that LST ranges between 31˚C to 46˚C, while NDVI ranged between 0.21 and 0.29. A negative correlation coefficient of 0.98 characterizes the relation between the two parameters.
The third part is characterized as follow: LST (Kelvin) = (304.3182571 - 319.3527926). LST (Celsius) = (31˚C - 46˚C). NDVI Value (0.21 - 0.29). R = −0.97987. R2 = 0.960 (Figure 12).
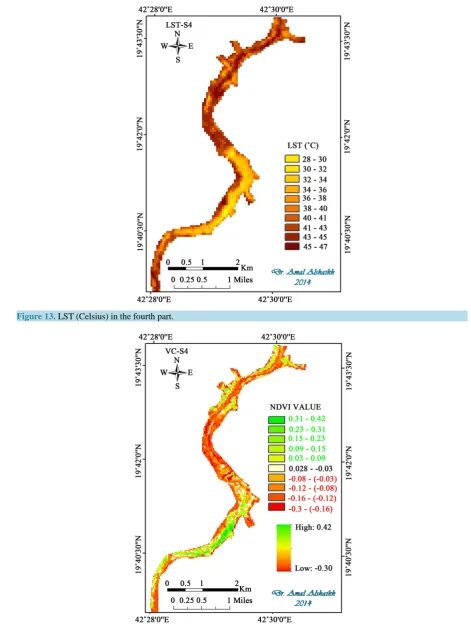
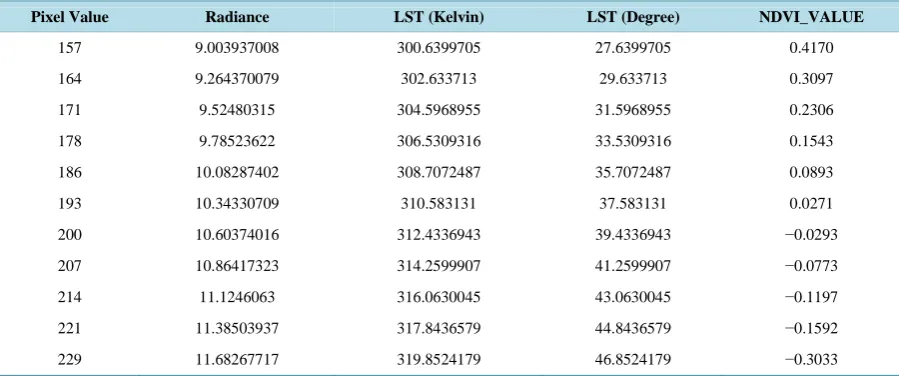
Regarding the Forth part of Wadi Bisha, the distribution of LST and NDVI is shown in Figure 13 and Fig-ure 14 respectively. It is found that LST ranges between 28˚C to 47˚C, while NDVI lies between −0.30 and 0.42. A negative correlation coefficient 0.98 (Table 7 andFigure 15) is found between the two parameters.
The forth part is characterized as follow: (Figure 13 and Figure 14) (Table 7). LST (Kelvin) = (300.6399705 - 319.8524179). LST (Celsius) = (28˚C - 47˚C). NDVI value (0.303 - 0.42). R = - 0.99245. R2 = 0.985 (Figure 15).
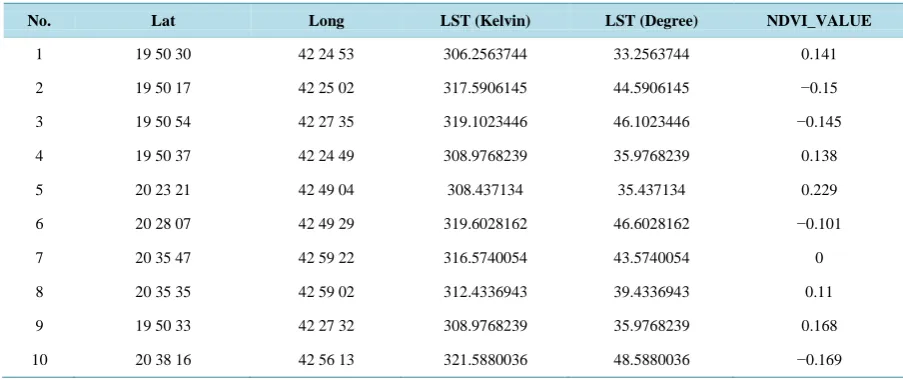
6.2. Validation of VC-LST Relationship
Finally, a number of 10 geographic locations were chosen randomly to represent the study area, for measuring both LST and NDVI. The measurements show that LST ranges between 33˚C to 49˚C, while NDVI values range
Figure 9. Relationship between LST and NDVI at part 2.
Table 5.LST and NDVI measurement at part 2.
Pixel Value Radiance LST (Kelvin) LST (Degree) NDVI_VALUE
164 9.264370079 302.633713 29.633713 0.4839
171 9.52480315 304.5968955 31.5968955 0.25346
179 9.822440945 306.804921 33.804921 0.1884
186 10.08287402 308.7072487 35.7072487 0.14231
194 10.38051181 310.849022 37.849022 0.098943
201 10.64094488 312.6960558 39.6960558 0.058281
209 10.93858268 314.7774719 41.7774719 0.01762
216 11.19901575 316.5740054 43.5740054 −0.033885
224 11.49665354 318.6001664 45.6001664 −0.0881
231 11.75708661 320.3503644 47.3503644 −0.12876
239 12.05472441 322.3257189 49.3257189 −0.20737
is 0.16 to 0.23. Table 8 and Figure 16show that a negative correlation coefficient of 0.94 characterizes the rela-tion between the two parameters.
LST and NDVI measurement at several locations). LST (Kelvin) = (306.2563744 - 321.5880036). LST (Cel-sius) = (33˚C - 49˚C). NDVI value (0.169 - 0.229). R = −0.942713. R2 = 0.888.
Table 9 and Table 10 summaries the overall obtained results related to SLT and NDVI values found in dif-ferent study portions. It can be outlined that the abundance of vegetation cover is one of the most influential in controlling (LST) in Wadi Bisha. As per the (NDVI values) the data indicates that areas having lowest surface temperatures were rich in vegetation (dense vegetation). A clear example may be highlighted at the part 4 of Wadi Pisha, where the Lowest LST was (28˚C) and highest NDVI (0.41) are recorded. Also, part 2 includes the bar land area of highest LST (49˚C) characterized by the lowest NDVI value (−0.20).
Figure 10.LST (Celsius) in the third part.
Table 6. LST and NDVI measurement at part 3.
Pixel Value Radiance LST (Kelvin) LST (Degree) NDVI_VALUE
170 9.487598425 304.3182571 31.3182571 0.2874
177 9.748031496 306.2563744 33.2563744 0.1675
184 10.00846457 308.1664763 35.1664763 0.1224
191 10.26889764 310.049796 37.049796 0.08309
198 10.52933071 311.9074828 49.000000 0.0497
205 10.78976378 313.7406093 40.7406093 0.01631
212 11.05019685 315.5501786 42.5501786 −0.03082
219 11.31062992 317.33713 44.33713 −0.1506
[image:10.595.88.538.516.719.2]Figure 11.NDVI Value in the third part.
Figure 13. LST (Celsius) in the fourth part.
Figure 15. Relationship between LST and NDVI at part 4.
Figure 16.Relationship between LST and NDVI at several locations.
Table 7.LST and NDVI measurement at part 4.
Pixel Value Radiance LST (Kelvin) LST (Degree) NDVI_VALUE
157 9.003937008 300.6399705 27.6399705 0.4170
164 9.264370079 302.633713 29.633713 0.3097
171 9.52480315 304.5968955 31.5968955 0.2306
178 9.78523622 306.5309316 33.5309316 0.1543
186 10.08287402 308.7072487 35.7072487 0.0893
193 10.34330709 310.583131 37.583131 0.0271
200 10.60374016 312.4336943 39.4336943 −0.0293
207 10.86417323 314.2599907 41.2599907 −0.0773
214 11.1246063 316.0630045 43.0630045 −0.1197
221 11.38503937 317.8436579 44.8436579 −0.1592
[image:13.595.88.538.531.719.2]Table 8. LST and NDVI measurement at several locations.
No. Lat Long LST (Kelvin) LST (Degree) NDVI_VALUE
1 19 50 30 42 24 53 306.2563744 33.2563744 0.141
2 19 50 17 42 25 02 317.5906145 44.5906145 −0.15
3 19 50 54 42 27 35 319.1023446 46.1023446 −0.145
4 19 50 37 42 24 49 308.9768239 35.9768239 0.138
5 20 23 21 42 49 04 308.437134 35.437134 0.229
6 20 28 07 42 49 29 319.6028162 46.6028162 −0.101
7 20 35 47 42 59 22 316.5740054 43.5740054 0
8 20 35 35 42 59 02 312.4336943 39.4336943 0.11
9 19 50 33 42 27 32 308.9768239 35.9768239 0.168
[image:14.595.90.549.317.386.2]10 20 38 16 42 56 13 321.5880036 48.5880036 −0.169
Table 9. Conclusions from analyzing the (VC) and (LST) values.
Wadi Bisha Part-1 Part-2 Part-3 Part-4 Several Locations
LST (Kelvin) 303 - 320 302 - 322 304 - 319 300 - 319 306 - 321
LST (Celsius) 30˚C - 48˚C 30˚C - 49˚C 31˚C - 46˚C 28˚C - 47˚C 33˚C - 49˚C
[image:14.595.91.536.411.467.2]NDVI (Values) 0.19 - 0.34 0.2 - 0.48 0.21 - 0.29 0.303 - 0.42 0.169 - 0.229
Table 10. Correlation coefficient between (VC) and (LST).
Wadi Bisha Part-1 Part-2 Part-3 Part-4 Several Locations
R 0.98322 0.96896 0.97987 0.99245 0.942713
R2 0.966 0.938 0.960 0.985 0.888
7. Conclusions
As Land surface temperature (LST) controls the surface heat and water exchange with atmosphere, Land use/ Cover is very important factor having a significant impact on Erath Ecosystem. As land surface temperature is considered the thermal landscape emission, influence of landscape on controlling surface heat and water ex-change with atmosphere can be predicted. The concrete conclusion of the current research can be outlined as follows:
Remote-sensing data is the most important data sources in land use modeling.
Land’s surface temperature is affected by many factors; the most important are richness of water and vegeta-tion.
There is a strong negative relationship between LST and vegetation cover. The temperature was increased in the urban areas.
8. Recommendations
It is possible to recommend the following:
1. Availability and continuity of Satellite remote sensing data is required to support controlling the ecosystem. 2. Continuous monitoring of vegetation cover conditions and mapping is recommended in WadiBisha for its
ecological tourism potentialities.
4. Presidency of Meteorology and Environment (PME) should continue their development and ensure the adoption of flexible land cover validation protocols.
References
[1] Ahmed, A., Noorazuan, H. and Zolkepli, B. (2006) Estimation of Land Surface Temperature Using Landsat Tm Ther-mal Infrared in Selangor-Negeri Sembilan. Proceedings of the National Seminar on Science and Its Applications in Industry (SSASI 2006), Malacca, 14-15 February 2006.
[2] Hassan, Q.K. and Rahman, K.M. (2012) Applicability of Remote Sensing-Based Surface Temperature Regimes in De-termining Deciduous Phenology over Boreal Forest. Journal of Plant Ecology, 6, 84-91.
[3] Dickinson, R.E. (2010) Land Surface Skin Temperature Climatology: Benefitting from the Strengths of Satellite Ob-servations. Environmental Research Letters, 5, Article ID: 044004. http://dx.doi.org/10.1088/1748-9326/5/4/044004 [4] Sun, D. and Pinker, T. (2004) Case Study of Soil Moisture Effect on Land Surface Temperature Retrieval. IEEE
Geos-cience and Remote Sensing Letters, 1, 127. http://dx.doi.org/10.1109/LGRS.2004.824749
[5] Markham, B.L. and Barker, J.L. (1986) Landsat MSS and TM Post-Calibration Dynamic Rangers, Exoatmospheric Reflectance and At-Satellite Temperatures. EOSAT Landsat Tech. Notes, 3-8.
[6] Schott, J.R. and Volchok, W.J. (1985) Thematic Mapper Thermal Infrared Calibration. Photogrammetric Engineering and Remote Sensing, 51, 1351-1357.
[7] Townshend, J.R.G. and Justice, C.O. (1986) Analysis of the Dynamics of African Vegetation Using the Normalized Difference Vegetation Index. International Journal of Remote Sensing, 8, 1189-1207.
http://dx.doi.org/10.1080/01431168708954764
[8] Barsi, J.A., Barker, J.L. and Schott, J.R. (2003) An Atmospheric Correction Parameter Calculator for a Single The- rmal Band Earth-Sensing Instrument. IGARSS 03, Toulouse, 21-25 July 2003.
[9] Govindha Raj, B. and Fleming, K. (2008) Surface Temperature Estimation from Landsat ETM+ Data for a Part of the Baspa Basin, NW Himalaya, India. Bulletin of Glaciological Research, 25, 19-26.
[10] Sobrino, J.A., Jiménez-Muñoz, J.C., Zarco-Tejada, P.J., Sepulcre-Cantó, G. and de Miguel, E. (2006) Land Surface Temperature Derived from Airborne Hyperspectral Scanner Thermal Infrared Data. Remote Sensing of Environment,
102, 99-115. http://dx.doi.org/10.1016/j.rse.2006.02.001