Performance Study based on Matlab Modeling for Hybrid
Electric Vehicles
Mihai-Ovidiu Nicolaica
PhD Student, Faculty of Electronics, Telecommunications & Information Technology, "Gheorghe Asachi" Technical University, Iaşi, Romania
ABSTRACT
The present paper introduces an integrated method for a performance analysis of the hybrid electric vehicles. This method takes into consideration a set of parameters that influence the system performance. The research is based on Matlab modeling and Hardware in the Loop approach. The value added is given by the accuracy of the model that is part of the simulation together with the presented performance analysis methods. A set of 42 case studies are proposed and the efficiency of the method is tested through a series of simulation results. The motivation of the research is given by the fact that the automotive sector is in a continuous change, and in the last years the trend is towards electric vehicles. The advantage of this method is that the systems performance can be validated to a large extent from an early stage. The results can contribute to the practical need of developing hybrid and electric vehicles at higher quality standards, faster and with a better cost.
Keywords
Hybrid Electric Vehicle, HIL, simulation, modeling
1.
INTRODUCTION
Research shows that the curves of conventional oil demand and oil production are still in line until 2020 and by 2050 the oil gap will dramatically increase till 50 Billion Barrels. This issue of oil reduction in the world, and the air pollution triggered many research to seek alternative ways to replace the combustion engine [1]. Hybrid and electric vehicles can be declared as the cars of the future, mainly because they produce no pollution, are silent and have enhanced energy efficiency. In the same time there are still some issues that still need to be solved, like limited driving range and long charging time [2]. These problems can be mitigated also by a very good parameterization and better control systems. This can be achieved by developing a very good model of the vehicle and testing the prototypes from the early concept phase. Research in the domain of Hybrid Electric Vehicles has concentrated in the latest years in finding solutions for efficient motors and engines, reduced fuel emissions and better battery lifetime. In the last years the share of software controlled innovations in the automotive industry increased from 20 percent to 80 percent. This is continuously growing and it is estimated that software will drive more than 90 percent of the automotive systems in the next years. Considering this, the impact of software in electric vehicles will be very high [3]. In order to have good achievements in the testing process, the test environment needs to be very realistic. In the last years the automotive industry is driven to more complex electronic control systems. The number of electronic control units (ECUs) is increasing and also the complexity of communication networks between the ECUs. In the same time, mathematical modeling and simulation tools
became more advanced and the concept of simulation became an actual design tool. Simulation is now the primary tool used before real word testing is possible [4]. The safety practices and standards are becoming more regulated as industries adopt a standardized set of practices for product design and test. Every manufacturer needs to provide evidence of compliance with the latest regulations.
2.
FUNCTIONAL SAFETY STANDARD
ISO26262
The complexity in the automotive industry is continuously increasing together with the development of hybrid and electric vehicles. This also increases the effort in providing safety-compliant systems. The Draft International Standard (DIS) of ISO26262 was published in June 2009. Since the publication of the draft, ISO26262 has gained traction in the automotive industry. This standard provides recommendations and regulations trough the entire development process with an emphasis on providing requirements for validation and confirmation measures in order to achieve an acceptable level of safety. Test is considered a critical component. It is estimated that the cost of a failure decreases by 10 times when the error is caught in production instead of in the field and decreases 10 times again if it is caught in design instead of production [5]. With a very good simulation and efficient testing techniques the level of quality and safety can increase and large efficiency gains can be generated. High cost reduction would be another benefit. From the initial design phase to the operational prototype a series of steps, such as Software in the Loop (SIL) followed by Hardware in the Loop (HIL) validation of control algorithms and control hardware should be performed. The SIL/HIL sequence has a high benefit in improving the safely level, also development cost and time, as the control systems can be validated to a large extent, before vehicle deployment [6].
3.
HARDWARE IN THE LOOP
of the HIL system is to provide all electrical inputs to fully exercise the ECU [8]. One of the key components of the HIL system is the model that simulates the environment around the real ECU and drives the real time simulation hardware. The block diagram of a classic HIL system is presented in Figure 1.
Fig 1: HIL System Architecture.
A big advantage of Hardware in the Loop testing is the fact that extreme testing can be performed without the risk of damaging any equipment. It is also recommended to test in a simulated environment before the controller is applied on a real target. HIL systems increase reliability and quality of the final product and bring innovation with a lower cost. Also the challenges of the testing process are mitigated by using HIL systems, like cost to test, cost of failure repeatability or availability [8]. HIL has become in the last years an indispensable approach for prototyping and has allowed the integration of hardware and software components to be prepared earlier in the development cycle [9]. HIL initially started only with ECU testing, but in the last years started to incorporate additional devices like actuators or hydraulic systems. This represents the transition from software in the loop or model in the loop to system testing and integration. This evolution improved the development cycle with 75 percent from time perspective. Components from different industries are involved to create what is a mock-up of real life equipment [10]. As HIL simulation can be done far earlier than vehicle tests, it helps to improve quality at an early development stage. A major Japanese automobile manufacturer states that HIL simulation finds 90% of ECU errors, and almost all the errors can be found before the calibration phase [7]. One of the most important components of Hardware in the Loop systems is the simulation model. The performance of the system is given by the accuracy of the model. Usually the real time model is built in Matlab/Simulink compiled and loaded on a simulator. A dSpace simulator can be used. A Simulator Mid-Size from dSpace is a ready-to-use, standard Hardware in the Loop simulator for testing automotive ECUs systematically and automatically. The simulation model runs on the processor hardware (single-processor or multiprocessor systems). The Simulator Mid-Size generates and measures I/O signals via the integrated dSpace I/O boards. The function range is complemented by load and failure simulation [11]. User interface software is able to control the simulator that runs the simulation model. This system allows direct access to all inputs and outputs of an EEC under test. The inputs and outputs of an EEC in this test environment can be seen as an item if an object oriented scripting language is used to
automatically manipulate them. Currently the most popular programming language used to develop Test Automation scripts in automotive and aerospace is Python. Automated testing is usually performed by executing tests on a standard PC connected to the Hardware in the Loop (HIL) system. Real time testing with Python scripts offers very high benefits. They run on the processor board of the HIL system in real time, synchronously with the model, so all test actions are performed on a real-time basis – 100% reproducibly [12]. HIL simulation begins with a system-level model that includes embedded system algorithm and its operating environment. This paper presents a case study using a Matlab model for a hybrid electric vehicle. The model which can be easily incorporated into a HIL system is used to analyze the performance of hybrid vehicle architecture. A simplified block diagram of one hybrid vehicle architecture is presented in Figure 2.
Fig 2:Hybrid Vehicle Architecture.
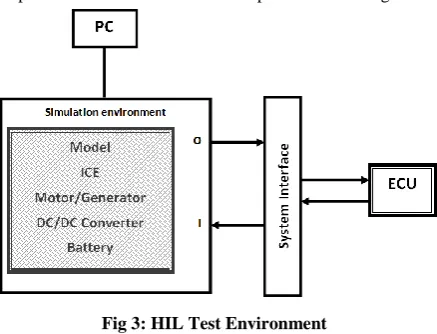
The Electronic Control Unit communicates with all main components: Battery, DC/DC Converter, Electric Motor/Generator, and Internal Combustion Engine (ICE). The structure shown in Figure 2 can be modeled and the HEV system architecture can be translated into Hardware in the Loop environment like the one presented in Figure 3.
Fig 3: HIL Test Environment
The HIL simulation environment presented in Figure 3 can be considered the intermediate step between the model in the loop analysis and actual HEV prototype. After the analysis is performed in Matlab, the model can be compiled and loaded on a simulator. In this way the loop in the HIL system is closed. The Matlab model is suitable for a dSpace mid-size simulator. The model inputs and outputs can be connected through a system interface to a real Electronic Control Unit. The ECU will have the expected inputs and outputs in a closed loop environment. In this way, the control software on the real unit can be tested, and the performance can be assessed prior to the deployment on the real vehicle.
[image:2.595.315.542.258.341.2] [image:2.595.321.540.406.573.2]4.
CASE STUDY (MATLAB MODEL
FOR HIL) – ANALYSIS
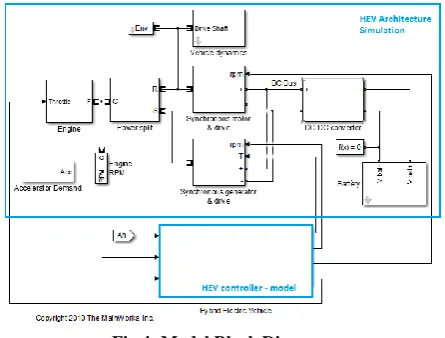
The block diagram of the model under analysis is presented in Figure 4 [13].
Fig 4: Model Block Diagram.
[image:3.595.325.532.74.260.2]The model has several parameters that can be configured, but the analysis is concentrated on vehicle mass, battery voltage, and engine power. The system control is also simulated for a closed loop behavior. Several combinations of values for the previous parameters are analyzed to generate a performance matrix. Several simulations are executed for vehicle mass from 600Kg to 1200Kg, for battery voltage from 200V to 300V, and for internal combustion engine from 43kW to 53kW. Different driving cycles are defined. A driving cycle is proposed in Table 1.
Table 1. First Driving Cycle
Time Accelerator Time Accelerator
0 0 56 0.03
7 0.2 60 0.03
15 0.2 65 0.03
25 0.2 70 0.15
30 0.05 75 0.15
35 0.05 80 0.15
40 0.05 81 0.1
43 0.15 82 0.05
50 0.15 85 0
55 0.15 90 0
[image:3.595.56.279.126.295.2]The Accelerator in Table 1 is converted to engine speed demand. A pedal deflection of 0.1 corresponds to 20km/hour, results in the speed demand of 800rpm, thereby starting the engine. The simulated driving cycle has the duration of 90 seconds with some accelerations and decelerations in order to see the behavior of the motor, the generator and the impact on the battery. The driving cycle has multiple acceleration and braking sequences in a short timeframe. Also the acceleration and deceleration gradients are different in order to have a wider simulation range. The speed corresponding to the driving cycle together with the activation or deactivation of the internal combustion engine (ICE) is presented in Figure 5. It is visible that the ICE start or stop is dependent on the speed value.
Fig 5: Vehicle speed
The battery power behavior during the driving cycle for different vehicle mass is presented in Figure 6. During motor mode the power consumption increases, and a spike is visible when the ICE starts. The power consumption increases until the speed stabilizes, and while running on combustion engine the battery charges. The charging of the battery is represented by a negative value on the graph in Figure 6.
Fig 6:Battery power
During breaking the battery power goes in the negative area (regenerative braking) and again a spike is visible when the electric engine switches from generator mode to motor mode. In motor mode the power consumption increases. This behavior is visible through the entire driving cycle at different scales depending on the speed value and the breaking gradient. It can be observed that the power consumption depends on the vehicle mass while the generator mode performance remains constant for different vehicle mass. This was regulated by the control unit. The results shown in Figure 6 are obtained with a battery rated voltage of 200V. The internal combustion engine has a maximum power of 43kW with a maximum speed of 6000rpm. These simulation environment values are changed further in the investigation for a better overview. In the performance analysis is used an ideal battery model for which the output voltage is given by
R
I
V
V
0
*
, whereV
0is the rated voltage,I
is theoutput current, and
R
is the internal resistance. The charge level is tracked, and a simulation error issued if it either exceeds the ampere-hour capacity, or falls below 10% of the ampere-hour capacity. The internal combustion engine (ICE) that is part of the analyzed hybrid architecture is modeled as a0 20 40 60 80 100
-5 0 5 10 15 20 25 30 35 40 45
Driving Cycle
Time (s)
V
e
h
ic
le
S
p
e
e
d
(K
M
/h
)
Vehicle Speed ICE Run
0 20 40 60 80 100
-10 0 10 20 30 40 50
Battery power vs Different vehicle mass
Time (s)
B
a
tt
e
ry
P
o
w
e
r
(k
W
)
[image:3.595.325.527.346.519.2]simple gasoline fuel engine model with speed governor. The throttle input signal lies between zero and one and specifies the torque demanded from the engine as a fraction of the maximum possible torque. This signal also indirectly controls the engine speed. If the throttle signal rises above one or falls below zero, the engine limits the signal to one or zero respectively. If the engine speed rises above the maximum speed, the engine torque drops to zero [14]. A better overview on the Battery power distribution during acceleration is represented in Figure 7.
Fig 7: Battery Power during acceleration
The Engine Run signal represents the internal combustion engine which starts and powers the car from the moment Engine Run becomes true. The efficiency is directly depending on vehicle mass as demonstrated in Figure 7. For the same driving cycle and the same model parameterization a set of important parameters are also displayed in the plots in Figure 8.
Fig 8: Engine and Generator Power
Representative parameters are the DC bus voltage, the DC bus current and the power of the engine, motor and generator. These graphs are affected by different vehicle mass values. In order to extend the analysis 42 test scenarios are developed where not only the vehicle mass is varied but also the battery voltage (200V to 300V) and ICE power (43kW to 53kW). All results vectors for generator power and motor power are plotted on the same figure to see the distribution over the entire simulation range. The simulation result is visible in Figure 9.
Fig 9: Generator and Motor Power distribution
The graph shape is similar over all test cases with differences in signal values. The positive and negative values of the battery power are considered for an efficiency analysis. For all test cases the percentage of battery charge time and the percentage of discharge time are calculated over the same driving cycle that was previously presented in Table 1 above. The charge time percentage varies between 44.1753% and 49.2528% over all test scenarios. The discharge time percentage varies between 50.7472% and 55.8247% over all test scenarios. A graphical representation is presented in Figure 10.
Fig 10: Charging percentage distribution – DC 1
The best efficiency over this driving cycle is obtained with a vehicle mass of 600Kg, a battery voltage of 200V and an internal combustion engine of 53KW. For a better understanding and a comparative analysis against the first set of results, another driving cycle is considered as per Table 2.
0 2 4 6 8 10 12
0 10 20 30 40
Battery power vs Different vehicle mass
Time (s) B a tt e ry P o w e r (k W ) 600 Kg 700 Kg 800 Kg 900 Kg 1000 Kg 1100 Kg 1200 Kg Speed Eng Run
0 20 40 60 80 100
-2 0 2 4 6 8 10 12
Engine Power vs Different vehicle mass
Time (s) E n g in e P o w e r (k W ) 600 Kg 700 Kg 800 Kg 900 Kg 1000 Kg 1100 Kg 1200 Kg
0 20 40 60 80 100
-10 -5 0 5 10
Generator Power vs Different vehicle mass
Time (s) G e n e ra to r P o w e r (k W ) 600 Kg 700 Kg 800 Kg 900 Kg 1000 Kg 1100 Kg 1200 Kg
0 20 40 60 80 100
-10 0 10
Generator Power distribution
Time (s) G e n e ra to r P o w e r (k W )
0 20 40 60 80 100
-50 0 50
Motor Power distribution
Time (s) M o to r P o w e r (k W )
0 10 20 30 40 50
44 46 48 50 P e rc e n ta g
e Charge mode
0 10 20 30 40 50
Table 2. Second Driving Cycle
Time Accelerator Time Accelerator
0 0 56 0.2
7 0.2 60 0.2
15 0.2 65 0.2
25 0.2 70 0.2
30 0.2 75 0.2
35 0.2 80 0.2
40 0.2 81 0.2
43 0.2 82 0.2
50 0.2 85 0
55 0.2 90 0
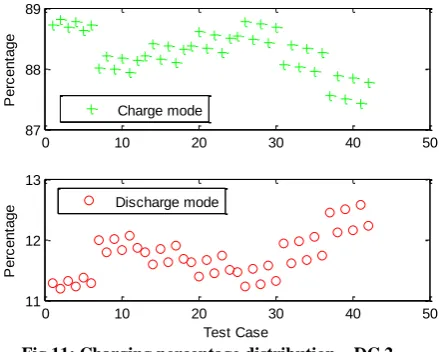
The new driving cycle has the same time duration but only an acceleration of 7 seconds and a deceleration of 5 seconds comparing to the first driving cycle where several acceleration and decelerations were performed. The drive speed is constant. The electric motor is for a longer time in generator mode and the vehicle is powered by the ICE most of the time. The charge time percentage varies between 87.4340% and 88.8062% over all test scenarios. The discharge time percentage varies between 11.1938% and 12.5660% over all test scenarios. A graphical representation is presented in Figure 11.
Fig 11: Charging percentage distribution – DC 2
The analysis shows that the best performance over the second driving cycle is obtained with a vehicle mass of 600Kg, a battery voltage of 200V and an internal combustion engine of 53kW. Very similar energy efficiency is obtained in case of vehicles with a higher mass over the second driving cycle. This underlines the fact that the vehicle mass has a higher impact in driving cycles where many acceleration and breakings are performed.
5.
CONCLUSION
Hardware in the Loop and Model in the Loop analysis are very powerful methods for system design and validation. This paper offered an overview about these techniques applied in hybrid and electric vehicles. A model based analysis of hybrid electric vehicle architecture was performed. A set of test cases were executed using this model that helped the system
understanding. The model used can be incorporated in Hardware in the Loop test system for additional measurements. The parameterization of the model can be extended and further analysis can be done in order to improve the model performance. An objective for further research is to extend and perfect additional simulation models for electric vehicles that can be used for model in the loop simulations and that can be easily incorporated in HIL systems.
6.
REFERENCES
[1] Bambang, S. K., Soebagio, Mauridhi, H. P., Design and Development of Small Electric Vehicle using MATLAB/Simulink, International Journal of Computer Applications (0975 – 8887) Volume 24 – No.6, June 2011, pp.19-23
[2] Schaltz, E., Electrical Vehicle Design and Modeling, Aalborg University Denmark
[3] Bringmann, E., Krämer A., Model-based Testing of Automotive Systems, 2008, International Conference on Software Testing, Verification, and Validation, pp. 485 to 493
[4] King, J. C., Model-Based Design of a Plug-In Hybrid Electric Vehicle Control Strategy, 2012, MS Thesis in Mechanical Engineering, Virginia Polytechnic Institute and State University, Blacksburg, VA
[5] What is the ISO 26262 Functional Safety Standard, 2012, www.ni.com
[6] Wilhelm, E., Fowler, M.W., Fraser, R.A., Stevens, M.B., Hardware in the Loop Platform Development for Hybrid Vehicle
[7] ECU Testing with dSPACE HIL Systems http://www.dspace.com/en/pub/home/products/systems/e cutest.cfm
[8] Halvorsen, H. P., Hardware-in-the-Loop Simulation, Telemark University College Faculty of Technology [9] Vasiliu C., Vasile N., Innovative HIL Architecture for
Electric Powertrain Testing, U.P.B. Sci. Bull., Series C, Vol. 74, Iss. 2, 2012, pp. 269-278
[10] Vasiliu C., Vasile N., Hardware-In-The-Loop Simulation for Electric Powertrains, Rev. Roum. Sci. Techn. Électrotechn. et Énerg., 57, 2, p. 212–221, Bucarest, 2012
[11] dSPACE Simulator
http://www.dspace.com/en/pub/home/products/systems/e cutest/hil_simulation_dspace_sim.cfm
[12] Real-Time Testing
https://www.dspace.com/en/inc/home/products/sw/test_a utomation_software/automated_test_execution_in_re.cf m
[13] Real-Time Simulation of a Hybrid–Electrical Vehicle http://www.mathworks.de/matlabcentral/fileexchange/26 351
[14] Help Matlab Simulink
0 10 20 30 40 50
87 88 89
P
e
rc
e
n
ta
g
e
Charge mode
0 10 20 30 40 50
11 12 13
Test Case
P
e
rc
e
n
ta
g