http://dx.doi.org/10.4236/health.2015.712173
How to cite this paper: Harada, K., Moriyama, M., Uno, M., Kobayashi, T. and Yuzuriha, T. (2015) Effects of a Revised
Mod-erate Drinking Program for Enhancing Behavior Modification in the Workplace for Heavy Drinkers: A Randomized Con-trolled Trial in Japan. Health, 7, 1601-1614. http://dx.doi.org/10.4236/health.2015.712173
Effects of a Revised Moderate Drinking
Program for Enhancing Behavior
Modification in the Workplace for Heavy
Drinkers: A Randomized Controlled Trial in
Japan
Koji Harada1*, Michiko Moriyama2, Mariko Uno2, Toshio Kobayashi2, Takefumi Yuzuriha3
1Graduate School of Health Sciences, Hiroshima University, Hiroshima, Japan 2Institute of Biomedical & Health Sciences, Hiroshima University, Hiroshima, Japan 3Hizen Psychiatric Center, Saga, Japan
Received 27 October 2015; accepted 6 December 2015; published 9 December 2015 Copyright © 2015 by authors and Scientific Research Publishing Inc.
This work is licensed under the Creative Commons Attribution International License (CC BY).
http://creativecommons.org/licenses/by/4.0/
Abstract
This study examined the effects of the Hizen Alcoholism Prevention Program (HAPPY) and the re-vised version of HAPPY (HAPPY Plus), and also compared the two programs to determine whether the HAPPY Plus achieved better outcomes for heavy drinkers in the workplace. The HAPPY Plus designed to strengthen participants’ recruitment, perception of threat, stress management, beha-vior modification by self-monitoring using a calendar-based diary, and to prevent dropout by tel-ephone and e-mail follow-up by a trained nurse. Participants were men and women who con-sumed at least 20 g and 10 g of alcohol daily, respectively, and had not been diagnosed with alco-hol dependence. A group intervention, 3-month randomized controlled trial was conducted. The control and intervention groups received the HAPPY and HAPPY Plus, respectively. The primary endpoint was average daily alcohol consumption. The Alcohol Use Disorders Identification Test (AUDIT), weight, body mass index, blood pressure, liver function, goal achievement rate, self-effi- cacy, and self-esteem were also measured. Out of 88 recruited employees, 83 (intervention group: 40; control group: 43) completed the study (completion rates were 100% and 93.4% respectively). As a result, average daily alcohol consumption decreased significantly in both groups (p < 0.001), but did not differ between groups. Even though behavior change rate was higher, and self-efficacy and confidence increased in the intervention group, AUDIT decreased in both groups but was sig-nificant only in the control group. Physiological indicators in the intervention group improved, but were not significant between the groups. Against the program revision, this study did not prove
superiority of HAPPY Plus to the HAPPY regarding the indicators. However, better behavior mod-ification and lower dropout were observed in the HAPPY Plus. Therefore, after further improve-ment is made, this group intervention program is applied to the workplace.
Keywords
Heavy Drinkers, Harmful Use of Alcohol, Moderate Drinking Program, Behavior Modification, Workplace
1. Introduction
Harmful alcohol use is a risk factor affecting not only drinkers’ health but also the risk of traffic accidents, vi-olence, suicide, and injury, which leads to premature death or disability. Despite the fact that these events could be avoided via interventional strategies designed to prevent or reduce harmful alcohol use, global provision of such strategies is inadequate, and there is a need for the involvement of several fields such as primary care, workplace, and school settings [1].
According to the International Classification of Diseases-10 [2], alcohol-related disorders are divided into two categories, for which treatment responses differ. Alcohol dependence is treated as a psychiatric condition, with treatment based on abstinence and rehabilitation, while treatments for harmful use are based on improving health behaviors (e.g., drinking moderation). The World Health Organization (WHO) reported that harmful al-cohol use is an important risk factor for noncommunicable diseases such as mental and neurological disorders, cardiovascular disease, cirrhosis of the liver, and various types of cancer. Despite the possibility of risk preven-tion, there were approximately 2.5 million alcohol-related deaths globally in 2004 [1].
In Japan, drinking has been strongly implicated in the incidence of lifestyle-related diseases [3]-[5], depres-sion and other mental and neurological disorders [6], many types of accidents and injuries, and death due to hy-pothermia [7]. In addition, companies incur rising medical costs due to increases in lifestyle-related diseases in-volving drinking, absenteeism, and presenteeism [8].
These alcohol related problems are considered to be caused by consumption of 6 or more alcoholic drinks (60 g of alcohol) per day. The amount of alcohol consumed in Japan represents the consumption by an estimated 8% of the adult population: 2.4 million extremely heavy drinkers and 8.6 million heavy drinkers with average daily pure alcohol intake of at least 120 g and 60 g, respectively [9] [10]. Despite implementation of the 10-year “Health Japan 21” project, which was initiated in 2000 to extend the nation’s healthy life expectancy, to reduce the supply of alcohol, increase knowledge, and limit the hours during which alcohol could be sold, the numbers of male and female heavy drinkers increased from 4.1% to 4.8% and 0.3% to 0.4%, respectively [11].
A brief intervention (BI) was developed in the 1980s, and a cross-national collaborative research project dri-ven by WHO had been underway, mainly in Europe, to reduce the number of alcohol-related deaths [12]. The probability that alcohol consumption would decline over a 6 - 12 months period had been found to double in drinkers who received the BI [13]. Some studies have demonstrated the effectiveness of the BI in reducing al-cohol consumption, and its use has been recommended in diagnosis and treatment guidelines for harmful drink-ing in various countries [12] [14]-[16]. On the other hand, other studies have shown that one of the limitations of BI is that the intervention period is short, preventing the provision of evidence of long-term effectiveness [16] [17].
participants could view a record of their day-to-day behavior changes and review them with their medical staff; and 4) these diaries were integrated into the program to ensure that it could be implemented consistently. More-over, in contrast to the BI, which mainly consisted of individual counseling in a primary care setting, the HAPPY was developed to allow implementation for groups in the workplace.
One study showed that the HAPPY significantly reduced the number of days on which heavy drinking oc-curred and significantly increased the number of alcohol-free days [21]; in addition, it significantly reduced γ- glutamyltranspeptidase (γ-GT) in another study [22]. The first study, however, did not include a control group, and small sample size was an issue for both studies.
Japan does not have a general practitioner system, and the implementation of BIs is not common practice. Because of the low take-up rate (46.2%) in those eligible for specific lifestyle-related disease checkups in their communities [23], it is extremely difficult to use the regional healthcare system framework to identify people whose drinking could be considered harmful. In addition, amid the opportunistic drinking that is customary in the workplace, many employees could be considered to engage in harmful alcohol use. Further, because work- place health checkup take-up rates are high, and the workplace has been linked to the primary prevention of al-cohol abuse [24], inclusion of these programs in company-provided health services is considered as both neces-sary and effective.
Therefore, an improved version of the HAPPY, the HAPPY Plus, was developed, and the purpose of this study was to measure its effectiveness and compare it with that of the HAPPY in employees in the workplace whose drinking qualified as harmful use.
In companies that aim to reduce their healthcare costs, resolving the issue of heavy drinking contributes to this management via primary prevention of alcohol related lifestyle diseases; ultimately controls healthcare costs related to chronic diseases [25]. It is a preventative measure for psychological problems such as depression, in-somnia, and social problems, which include absenteeism, presenteeism, and drunken driving; and is connected to controlling the progression of drinking toward alcohol dependence.
2. Methods
2.1. Study Design and Sample
A randomized controlled trial was conducted, with the HAPPY and HAPPY Plus provided for the control and intervention groups, respectively.
Participants were selected from employees of 10 companies that had agreed to collaborate in the study, who provided informed consent and fulfilled the following eligibility criteria: (1) aged over 20 years, (2) average daily alcohol intake of 2 drinks (20 g) for men and 1 drink (10 g) for women, and (3) no diagnosis of alcohol dependence.
Regarding the sample size, given an effect size of 0.33 for the BI [26], a significance level of 5%, and calcu-lation of significant differences with statistical power of 80%, the number of participants required for with-in-group measures and interactions in a two-way repeated measures ANOVA was 58 for each group. Using the same method and effect size, the required number of participants for between-subjects measures was 28 for each group. Assuming an attrition rate of 10% at 3 months, the target sample size was set at 128 (64 for each group) to produce the required sample size of 58 for each group.
2.2. Sampling and Randomization
Employees who, according to the results of workplace-provided health checkups required by the Industrial Safety and Health Act, were classified as people whose alcohol intake was at the heavy drinking level (540 ml or more per day) or people who already have a health disorder of γ-GT > 50 U/l were selected for participation. Recruitment was made through the companies by distributing flyers to each individual. After providing in-formed consent, participants were randomly assigned to the two groups.
2.3. Development of the HAPPY Plus and Training
Referring to the results of a recent field study that used focus group methodology to interview 12 male heavy drinkers [27], the following revisions were made to the HAPPY:
with Alcohol” was used as the title for the drinking moderation program, because 2 points had become clear. First, there was a strong resistance to reducing drinking (drinking provides an opportunity to socialize and build collegiality, and “being able to hold one’s liquor” is tied to the meaning of one’s existence, while drinking in moderation is believed to be connected to the disavowal of drinkers’ values). Second, there was a lack of fore-sight regarding long-term health (people do not think about being unable to drink because of health problems; it does not occur to them that their very existence could be threatened if they develop a health problem that makes it physically impossible to drink).
2) Changes were made to amplify participants’ perception of the threat to their health in order to increase be-havior change rate. The absence of the perception of a threat to health results from a paucity of information and knowledge concerning alcohol-related health problems, with the benefits of drinking emphasized. Therefore, we revised the way in which information was provided, using the Health Belief Model [28] [29], and improved the provision of medical information by instructing the therapist to present the information to participants interac-tively.
3) Stress management education was added. Because one of the reasons that participants drank alcohol to re-lieve stress, stress management education was integrated into the program to ensure that participants could learn to cope with stress via alternative means.
4) Measures were added to prevent dropout. We implemented interactive e-mail and telephone follow up be-tween sessions, and integrated motivational interviewing skills into the program presentation, to strengthen communication regarding approval, encouragement, motivation, and sympathy.
5) The self-monitoring method was improved in order for participants to evaluate their drinking behavior ob-jectively. We strengthened participants to set their goals on drinking behaviors and alcohol consumption and to monitor these achievements used a calendar-based diary.
6) Group dynamics were applied. Because customary drinking with work colleagues strengthens collegiality and provides a means via which to be oneself with others, we included group discussions regarding successful drinking (modeling), to increase self-efficacy.
A nurse facilitated this process. To assure the quality of this program, prior to the study, the nurse attended HAPPY training sessions and followed the manual prepared for this program.
2.4. Procedures
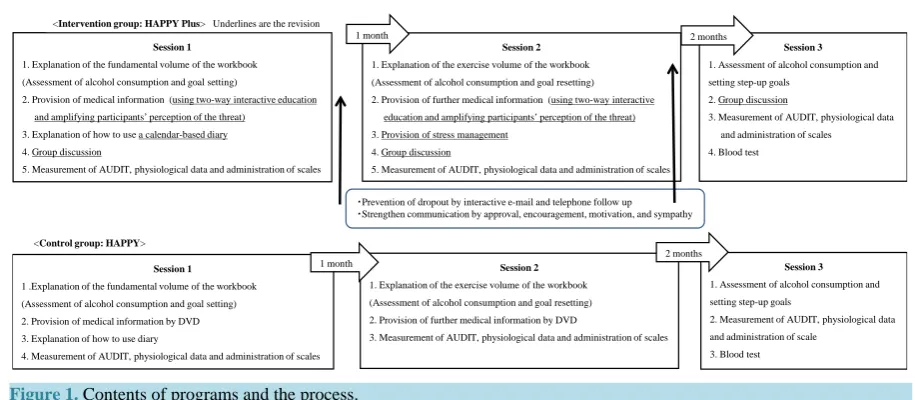
As shown in Figure 1, participants were assigned to the control (HAPPY) or intervention (HAPPY Plus) group. The trained nurse was assigned as a facilitator for sessions 1 - 3 and follow up for both groups. One group con-sisted of about six participants. The durations of the sessions and between-session intervals were the same for both groups, with a period of one month between sessions 1 and 2 and two months between sessions 2 and 3 (Figure 1).
Session 1 consisted mainly of 1) an explanation regarding the fundamental volume of the workbook, alcohol consumption assessment, and setting moderate-drinking goals; 2) amplification of participants’ perception of the threat of alcohol-related health problems; and 3) participants’ recording of their alcohol consumption. To ampl-ify the perception of threat, medical information presentation was interactive, and group discussion was included in the intervention group. Session 2 consisted mainly of 1) an explanation regarding the exercise volume of the workbook, alcohol consumption assessment (progress of implementation), and goal resetting; and 2) amplifica-tion of participants’ percepamplifica-tion of the threat of alcohol-related health problems. Session 3 consisted of alcohol consumption assessment (progress of implementation), goal resetting, and a blood test.
2.5. Outcome Evaluation 2.5.1. Primary Endpoint
The primary endpoint was average daily alcohol consumption (number of drinks), which was assessed preinter-vention and at 1 and 3 months postinterpreinter-vention. Sensible drinking was defined as 2 regular alcohol-free days per week [30]. Sensible drinking recommended by Ministry of Health in Japan includes drinking up to 2 drinks per day for men and 1 drink per day for women [11].
2.5.2. Secondary Endpoints
Figure 1. Contents of programs and the process.
2) Physiological indicators: weight, body mass index (BMI), systolic blood pressure, diastolic blood pressure, aspartate transaminase (AST), alanine transaminase (ALT), γ-GT, non-high-density lipoprotein cholesterol (non- HDL), and fasting glucose;
3) Psychological indicators: The General Self-Efficacy [31] [32] and Self-Esteem Scales [33] [34]; 4) Achievement of moderate-drinking goals and importance and confidence ratings.
Weight, BMI, and blood pressure were measured by a nurse at each session. Other physiological indicators were measured preintervention and postintervention. The AUDIT and the General Self-Efficacy and Self-Es- teem Scales were completed by participants and collected at every session. Blood samples were collected by the nurse at the session site and sent to a laboratory for analysis. Regarding the process indicators, at 1 and 3 months postintervention, participants completed a self-evaluation form concerning goal fulfillment and moderate drink-ing, with responses chosen from “goal almost achieved”, “goal partially achieved”, and “goal not achieved”. In addition, participants performed self-evaluation during every session, rating the importance of preventing alco-hol-related health problems and their confidence in their ability to control alcohol consumption.
The observation period was set at 3 months, because behavioral change could be measured by goal achieve-ment rate and self-efficacy score [35]; we used these measurements as surrogate indicators.
2.6. Statistical Analysis
First, to examine the effects of the HAPPY, a Friedman test was performed to determine the change in overall results over time for both groups, with the items measured at 3 time points for each group. A paired t test was performed to compare items measured at 2 time points (pre- and postintervention). To determine whether the HAPPY Plus yielded superior outcomes, a two-way repeated measures ANOVA or an unpaired t test was per-formed after determining normality. Participants’ achievement of moderate-drinking goals was expressed in terms of proportions of the participant group. A Friedman test was also used to examine changes in importance and confidence ratings over time for each group.
2.7. Study Period
Because the study was performed office by office, participant recruitment and the study procedures were con-ducted between September 2012 and March 2015.
2.8. Ethical Considerations
Ethical approval for the study was obtained from the Epidemiology Research Ethics Committee at the institution with where the authors were affiliated, and each office of the companies that collaborated in the study. The par-ticipants provided written informed consent to participation and the study was performed according to the Dec-laration of Helsinki.
Session 1 1. Explanation of the fundamental volume of the workbook (Assessment of alcohol consumption and goal setting)
2. Provision of medical information (using two-way interactive education and amplifying participants’ perception of the threat)
3. Explanation of how to use a calendar-based diary 4. Group discussion
5. Measurement of AUDIT, physiological data and administration of scales
Session 1 1 .Explanation of the fundamental volume of the workbook (Assessment of alcohol consumption and goal setting) 2. Provision of medical information by DVD 3. Explanation of how to use diary
4. Measurement of AUDIT, physiological data and administration of scales
<Intervention group: HAPPY Plus> Underlines are the revision
<Control group: HAPPY>
Session 2 1. Explanation of the exercise volume of the workbook (Assessment of alcohol consumption and goal resetting) 2. Provision of further medical information (using two-way interactive
education and amplifying participants’ perception of the threat) 3. Provision of stress management
4. Group discussion
5. Measurement of AUDIT, physiological data and administration of scales
Session 2 1. Explanation of the exercise volume of the workbook (Assessment of alcohol consumption and goal resetting) 2. Provision of further medical information by DVD
3. Measurement of AUDIT, physiological data and administration of scales
Session 3 1. Assessment of alcohol consumption and setting step-up goals
2. Group discussion
3. Measurement of AUDIT, physiological data and administration of scales 4. Blood test
Session 3 1. Assessment of alcohol consumption and setting step-up goals
2. Measurement of AUDIT, physiological data and administration of scale
3. Blood test
・Prevention of dropout by interactive e-mail and telephone follow up
・Strengthen communication by approval, encouragement, motivation, and sympathy 1 month
1 month
2 months
3. Results
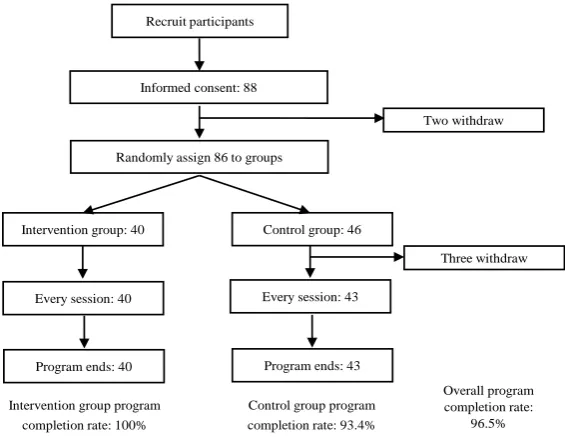
Eighty-eight people agreed to participate in the study. Of these, two withdrew from the study prior to randomi-zation, and three of the control group withdrew prior to initiation of the intervention; all five withdrawals oc-curred because of business duty burden. Data for 40 participants in the intervention group and 43 in the control group were included in the analysis. Completion rates were 100% and 93.4% for the intervention and control groups, respectively (Figure 2).
3.1. Comparison of Demographic and Baseline Data
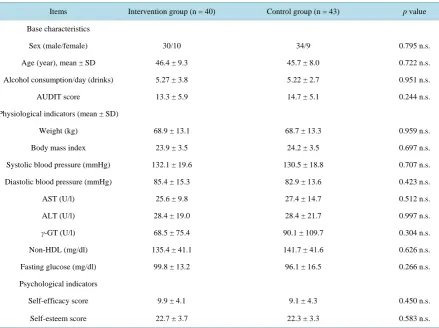
Participants’ mean age was 46.1 ± 8.6 years (range: 25 - 60 years). Their mean alcohol consumption was 5.25 ± 3.23 drinks, and their mean AUDIT score was 14.0 ± 5.53 (Table 1). Statistically significant differences were not confirmed for control comparison.
3.2. Effectiveness of the Programs
Table 2 shows the changes in alcohol consumption over time and the physiological and psychological indicators for both groups combined and individually.
Daily alcohol consumption decreased significantly over time in the intervention and control groups and both groups combined (all, p < 0.001). However, according to the results of the two-way repeated measures ANOVA, consumption did not differ significantly between groups. Superior outcomes, therefore, were not observed for the HAPPY Plus with respect to the primary endpoint. AUDIT scores decreased significantly over time in the control group (p < 0.05) and both groups combined (p < 0.01), while scores did not change in the intervention group.
Regarding physiological indicators, BMI decreased significantly in the intervention group (p < 0.01) and both groups combined (p < 0.05). Systolic blood pressure also decreased significantly in the intervention group and both groups combined (all, p < 0.05). However, BMI and systolic blood pressure did not differ significantly be-tween groups.
[image:6.595.172.455.485.704.2]With respect to liver function, AST and ALT did not change subsequently to the intervention in both groups combined and individually (Table 3). However, γ-GT decreased significantly in the control group (p < 0.05) and both groups combined (p < 0.01), but did not change in the intervention group. In addition, γ-GT did not differ significantly between groups. Non-HDL and fasting glucose decreased very little; therefore, values did not differ significantly between or within groups.
Figure 2.Participation and program completion rates. Informed consent: 88
Randomly assign 86 to groups Recruit participants
Intervention group: 40
Two withdraw
Control group: 46
Three withdraw
Every session: 40
Program ends: 40
Every session: 43
Program ends: 43
Intervention group program completion rate: 100%
Control group program completion rate: 93.4%
Overall program completion rate:
Table 1. Baseline characteristics.
Items Intervention group (n = 40) Control group (n = 43) p value
Base characteristics
Sex (male/female) 30/10 34/9 0.795 n.s.
Age (year), mean ± SD 46.4 ± 9.3 45.7 ± 8.0 0.722 n.s.
Alcohol consumption/day (drinks) 5.27 ± 3.8 5.22 ± 2.7 0.951 n.s.
AUDIT score 13.3 ± 5.9 14.7 ± 5.1 0.244 n.s.
Physiological indicators (mean ± SD)
Weight (kg) 68.9 ± 13.1 68.7 ± 13.3 0.959 n.s.
Body mass index 23.9 ± 3.5 24.2 ± 3.5 0.697 n.s.
Systolic blood pressure (mmHg) 132.1 ± 19.6 130.5 ± 18.8 0.707 n.s.
Diastolic blood pressure (mmHg) 85.4 ± 15.3 82.9 ± 13.6 0.423 n.s.
AST (U/l) 25.6 ± 9.8 27.4 ± 14.7 0.512 n.s.
ALT (U/l) 28.4 ± 19.0 28.4 ± 21.7 0.997 n.s.
γ-GT (U/l) 68.5 ± 75.4 90.1 ± 109.7 0.304 n.s.
Non-HDL (mg/dl) 135.4 ± 41.1 141.7 ± 41.6 0.626 n.s.
Fasting glucose (mg/dl) 99.8 ± 13.2 96.1 ± 16.5 0.266 n.s.
Psychological indicators
Self-efficacy score 9.9 ± 4.1 9.1 ± 4.3 0.450 n.s.
Self-esteem score 22.7 ± 3.7 22.3 ± 3.3 0.583 n.s.
Sex: chi-squared test; Psychological indicators: Mann-Whitney U test; Other: unpaired t test Abbreviations: γ-GT: γ-glutamyltranspeptidase; ALT: alanine transaminase; AST: aspartate transaminase; AUDIT: Alcohol Use Disorders Identification Test; non-HDL: non-high-density lipoprotein cho-lesterol; SD: standard deviation; n.s.: No Significant
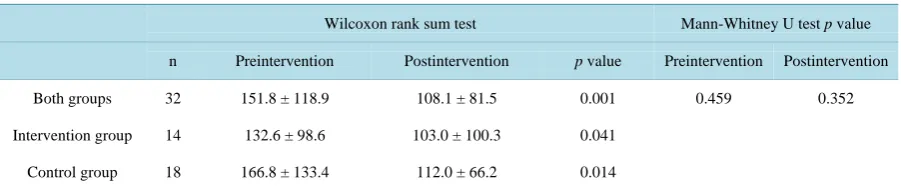
Regarding γ-GT, a pre/postintervention comparison was performed for participants with baseline values ex-ceeding the reference value (>50 U/l; Table 4). Large reductions, all of which were statistically significant, were observed in the intervention and control groups (all, p < 0.05) and both groups combined (p < 0.01). However, no significant difference was observed between groups.
Self-efficacy increased significantly in the control group (p < 0.05) and both groups combined (p < 0.01). However, scores in the intervention group did not change and did not differ significantly between groups. Scores in self-esteem were observed unchanged in both groups combined and individually (Table 2).
Participants’ goal achievement levels are shown in Table 5, and changes in their confidence levels over time and ratings for perception of the importance of preventing alcohol-related health problems are shown in Table 6. At both 1 and 3 months postintervention, relative to that of the control group, a higher proportion (60%) of par-ticipants in the intervention group had chosen the “goal almost achieved” response. Preintervention perception of the importance of preventing alcohol-related health problems was high in both groups, but no postinterven-tion increases were observed. Confidence levels increased significantly in the intervenpostinterven-tion and control groups (all, p < 0.05). In addition, slight changes in goal achievement levels were observed in the intervention and con-trol groups over time.
3.3. Participant Evaluations of Program Improvements
Table 3. Changes in blood test data over time.
Both Groups (n = 83) Intervention Group (n = 43) Control Group (n = 43) Unpaired t test p value
Pr ein ter v en tio n Po stin ter v en tio n p v alu e Pr ein ter v en tio n Po stin ter v en tio n p v alu e Pr ein ter v en tio n Po stin ter v en tio n p v alu e Pr ein ter v en tio n Po stin ter v en tio n
AST (U/l) 26.6 ± 12.7 24.5 ± 9.4 0.060 25.6 ± 9.8 25.0 ± 10.7 0.647 27.7 ± 15.0 24.0 ± 7.9 0.055 0.512 0.627
ALT
(U/l) 28.5 ± 20.5 27.1 ± 16.6 0.331 28.4 ± 19.0 27.6 ± 19.1 0.663 28.5 ± 22.2 26.5 ± 13.8 0.377 0.997 0.769 γ-GT
(U/l) 80.5 ± 95.6 64.3 ± 65.2 0.009 68.5 ± 75.4 59.7 ± 70.2 0.114 92.6 ± 111.8 69.0 ± 60.3 0.033 0.304 0.529
Non-HD L (mg/dl)
138.3 ± 41.0
141.6 ± 41.9 0.400 135.4 ± 41.1 138.8 ± 45.7 0.486 141.7 ± 41.6 144.9 ± 37.6 0.629 0.626 0.631
Fasting glucose (mg/dl)
98.1 ± 15.1 98.9 ± 20.5 0.647 99.8 ± 13.2 98.5 ± 14.0 0.644 96.2 ± 16.8 99.3 ± 25.8 0.179 0.266 0.828
Abbreviations: γ-GT: γ-glutamyltranspeptidase; ALT: alanine transaminase; AST: aspartate transaminase; non-HDL: non-high-density lipoprotein cholesterol.
Table 4. Participants’ γ-GT values exceeding the reference value.
Wilcoxon rank sum test Mann-Whitney U test p value
n Preintervention Postintervention p value Preintervention Postintervention
Both groups 32 151.8 ± 118.9 108.1 ± 81.5 0.001 0.459 0.352
Intervention group 14 132.6 ± 98.6 103.0 ± 100.3 0.041
Control group 18 166.8 ± 133.4 112.0 ± 66.2 0.014
Abbreviations: γ-GT: γ-glutamyltranspeptidase.
Table 5. Change in participants’ goal achievement over time.
Intervention group (n = 40) Control group (n = 43)
After 1 month After 3 months After 1 month After 3 months
Goal almost achieved, n (%) 24 (60.0) 24 (60.0) 16 (37.2) 18 (41.9)
Goal partially achieved, n (%) 14 (35.0) 13 (32.5) 17 (39.5) 18 (41.9)
Goal not achieved, n (%) 2 (5.0) 3 (7.5) 10 (23.3) 7 (16.3)
Total 40 (100.0) 40 (100.0) 43 (100.0) 43 (100.0)
Table 6. Changes in ratings for importance and confidence related to drinking in moderation over time.
Intervention Group (n = 40) Control group (n = 43)
Preintervention After 1 month After 3 months p value Preintervention After 1 month After 3 months p value
Importance
rating 7.15 ± 2.21 7.33 ± 1.73 7.53 ± 2.00 0.911 7.14 ± 2.57 7.26 ± 2.28 7.28 ± 2.15 0.940
Confidence
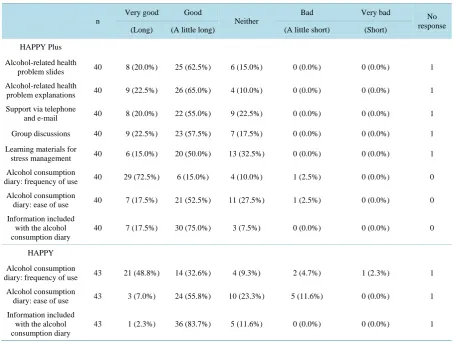
Table 7. Overall program evaluations.
n
Very good Good
Neither
Bad Very bad No
response (Long) (A little long) (A little short) (Short)
HAPPY Plus
Alcohol-related health
problem slides 40 8 (20.0%) 25 (62.5%) 6 (15.0%) 0 (0.0%) 0 (0.0%) 1
Alcohol-related health
problem explanations 40 9 (22.5%) 26 (65.0%) 4 (10.0%) 0 (0.0%) 0 (0.0%) 1
Support via telephone
and e-mail 40 8 (20.0%) 22 (55.0%) 9 (22.5%) 0 (0.0%) 0 (0.0%) 1
Group discussions 40 9 (22.5%) 23 (57.5%) 7 (17.5%) 0 (0.0%) 0 (0.0%) 1
Learning materials for
stress management 40 6 (15.0%) 20 (50.0%) 13 (32.5%) 0 (0.0%) 0 (0.0%) 1
Alcohol consumption
diary: frequency of use 40 29 (72.5%) 6 (15.0%) 4 (10.0%) 1 (2.5%) 0 (0.0%) 0
Alcohol consumption
diary: ease of use 40 7 (17.5%) 21 (52.5%) 11 (27.5%) 1 (2.5%) 0 (0.0%) 0
Information included with the alcohol consumption diary
40 7 (17.5%) 30 (75.0%) 3 (7.5%) 0 (0.0%) 0 (0.0%) 0
HAPPY
Alcohol consumption
diary: frequency of use 43 21 (48.8%) 14 (32.6%) 4 (9.3%) 2 (4.7%) 1 (2.3%) 1
Alcohol consumption
diary: ease of use 43 3 (7.0%) 24 (55.8%) 10 (23.3%) 5 (11.6%) 0 (0.0%) 1
Information included with the alcohol consumption diary
43 1 (2.3%) 36 (83.7%) 5 (11.6%) 0 (0.0%) 0 (0.0%) 1
management as “neither”. The HAPPY Plus revised alcohol consumption diary received a number of positive reviews.
4. Discussion
4.1. Study Participation
As the participants’ baseline daily alcohol consumption and AUDIT scores indicated harmful use but did not fall within the alcohol dependence range; in addition, almost 40% of the participants already caused alcoholic liver disease, the study appears to have been successful in recruiting a sample in need of lifestyle modification. Col-laborating with companies and the change in the program title facilitated the engagement process. These im-provements appeared effective. In addition, the efforts to retain participants by e-mail and telephone follow up in the HAPPY Plus appeared successful, as 100% of the participants completed the study.
4.2. Effects of the HAPPY and HAPPY Plus
On the other hand, although alcohol intake is related to risk of glucose intolerance [40] and elevated fatty acid levels [41], there were no improvements in these indicators. This may have occurred because there were only three participants whose results exceeded the reference values for diabetes. More important reason is that the program did not include diet and exercise education. This is explained in comparison with disease management programs which include comprehensive health risk behavior modification [35] and the metabolic syndrome life-style change education [42], which proved improvement in indicators for not only alcohol consumption but also blood glucose, blood pressure, and lipids. Especially, Iyatomi et al. showed significant improvement for target-ing high-risk drinkers whose AUDIT scores of at least 10 or consumed at least 21 drinks per week [42]. There-fore, we need to improve the programs; once the effects of moderate alcohol consumption have increased, the next step is to guide participants into programs including disease prevention programs that provide good dietary and exercise guidance or those that aim to improve overall health behavior.
In addition, scores for self-efficacy and self-esteem improved over time. This suggests that the intervention elements included in the HAPPY, such as empathy, goal setting and evaluation, could have been effective in providing a successful experience in drinking moderation.
4.3. Effects of the HAPPY Plus vs. the HAPPY
Goal achievement was considerably higher in the HAPPY Plus, as further information concerning alcohol-re- lated health problems was provided, presentation was interactive, group dynamics were introduced, and tele-phone and e-mail follow up were added. Aside from this finding, the HAPPY Plus was not shown to be superior to the HAPPY.
A considerable reason is that there were control group participants whose data values were extreme, and im-provements in these participants’ data exerted a strong influence on the results. Moreover, even in the HAPPY Plus, with behavior modification enhancement, the goal achievement rate was only 60%; notwithstanding the finding that there was a significant decrease in AUDIT scores in both groups combined. The average score did not fall below the dangerous consumption level. Further, despite a large and statistically significant reduction in γ-GT values in both groups combined, the average value did not decrease sufficiently to reach the normal range.
Another explanation for this could be that, even though the medium and method were altered, feedback, ad-vice, goal setting, self-monitoring, and acquisition of medical knowledge were included in both programs. Moreover, as company employees, participants could be assumed to possess sufficient cognitive ability to adapt an approach to suit their needs and use the Internet and other resources to obtain information as required. In fact, some participants stated that the alcohol consumption diary required improvement and created their own spreadsheet programs. However, the diary used in the HAPPY Plus demonstrated some strengths. The calendar style exerted a self-monitoring effect, as participants were able to grasp the relationship between changes in their behavior and alcohol consumption, such as “the relationship between weekend dinner parties and alcohol con-sumption” and “setting alcohol-free days and its effects”, at a glance. While the introduction of a drinking diary was not shown to exert a significant effect in one study [43], Hara et al. [44] described the effectiveness of moderate-drinking goals and a drinking diary. Nevertheless, with the finding that levels of achievement of beha-vioral goals were high in the HAPPY Plus, using a longer measurement period, it is conceivable that results could be reflected in improved physiological indicators and AUDIT scores.
In addition, participants’ evaluations of the stress management section of the program were low, and it did not exert a direct effect on controlling drinking behavior. Although entirely within the realm of conjecture, because this was a group intervention implemented in the workplace, it is possible that participants felt unable to discuss stress. Even though some studies have indicated that drinking behavior was associated with stress coping in men [45], rather than drinking serving as a means of relieving stress, it could simply reflect a daily habit, as some participants value drinking for its own sake, and their drinking is not related to stress relief [27]. Therefore, stress management could be deleted for the group intervention.
The results of this study suggested that convincing heavy drinkers to participate in and complete such programs requires an enforcement mechanism.
4.4. Summary and Future Improvements
Both the HAPPY and HAPPY Plus were found to reduce daily alcohol consumption. In addition, to support par-ticipants with metabolic syndrome and respect to their dietary problems, the revised version of HAPPY that in-cludes improvement of overall health behaviors is required. To improve program participation and completion rates, it was important to direct appeal for participation to companies, establish work-based groups, and conduct e-mail and telephone follow-up between sessions. Finally, since goal achievement rate was high in HAPPY Plus, it might be necessary to observe changes in drinking behavior over a period of at least a year rather than relying on surrogate indicators.
Conflicts of Interest
The authors declare that there are no conflicts of interest associated with this manuscript.
Funding
No funding was received for this study.
Access to Study Data
All authors had access to the study data.
References
[1] World Health Organization (2010) The Global Strategy to Reduce the Harmful use of Alcohol. World Health Organi-zation, Geneva. http://www.who.int/substance_abuse/msbalcstragegy.pdf
[2] World Health Organization (1992) The ICD-10 Classification of Mental and Behavioral Disorders: Clinical Descrip-tions and Diagnostic Guidelines. World Health Organization, Geneva.
http://www.who.int/classifications/icd/en/bluebook.pdf
[3] Ikeda, N., Saito, E., Kondo, N., Inoue, M., Ikeda, S., Satoh, T., et al. (2011) What Has Made the Population of Japan Healthy? TheLancet, 378, 1094-1105. http://dx.doi.org/10.1016/S0140-6736(11)61055-6
[4] World Health Organization (2009) Global Health Risks: Mortality and Burden of Disease Attributable to Selected Ma-jor Risks. World Health Organization, Geneva.
[5] Tsugane, S., Michael T.F., Sasaki, S. and Baba, S. (1999) Alcohol Consumption and All-Cause and Cancer Mortality Among Middle-Aged Japanese Men: Seven Year Follow-Up of the JPHC Study Cohort I. American Journal of
Epide-miology, 150, 1201-1207. http://aje.oxfordjournals.org/content/150/11/1201.full.pdf
http://dx.doi.org/10.1093/oxfordjournals.aje.a009946
[6] Matsushita, S. and Higuchi, S. (2009) Alcohol-Related Disorders and Suicide. Psychiatria et Neurologia Japonica, 111, 1191-1202.
[7] Ministry of Health, Labour and Welfare (2015) “Drinking and Accidents”. Health Information Website for the Preven-tion of Lifestyle Diseases [Seikatsushūkanbyō-yobō no tame no kenkōjōhōsaito “Inshu to jiko”]. Ministry of Health, Labour and Welfare, Tokyo. http://www.e-healthnet.mhlw.go.jp/information/alcohol/a-06-004.html
[8] Health Insurance Association of Tokio Marine Nichido (2015) Visualizing Health Issues through Collaboration be-tween Insurers and Business Owners Based on the “Health Cost Management” Framework [“Kenkōkeiei” no wakugu-minimotozuitahokensha/jigyōnushi no korabo-herusuniyorukenkō-kadai no kashika]. Health Insurance Association of Tokyo Marine Nichido, Tokyo. http://www.mhlw.go.jp/file/06-Seisakujouhou-12400000-Hokenkyoku/houkoku12.pdf [9] Health, Labour and Welfare Statistics Association (2004) Welfare Indicators 2004 Special Edition: National Health Trend [Kokumin-eisei no dōkō “Kōsei no shihyō” rinji-zōkan 2004]. Health, Labour and Welfare Statistics Association, Tokyo.
[10] Higuchi, S. (2004) Research on the Prevention of Problems Related to Drinking in Adults: 2003 Annual Report [Kōseirōdōkagakukenkyūhihojokin, Seijin no inshujittai to kanrenmondai no yobōnikansurukenkyū]. Health and Labor Sciences Research Grant.
Nippon 21 (dai 2 ji) no suishinnikansurusankōshiryō). Nutrition Committee for Regional Health Services and the Pro-motion of Health, Health and Science Council.
[12] Babor, T.F. and Higgins-Biddle, J.C. (2001) Brief Intervention for Hazardous and Harmful Drinking: A Manual for Use in Primary Care. World Health Organization, Department of Mental Health and Substance Abuse, Geneva.
[13] Wilk, A., Jensen, N. and Havighurst, T. (1997) Meta-Analysis of Randomized Control Trials Addressing Brief Inter-ventions in Heavy Alcohol Drinkers. Journal of General Internal Medicine, 12, 274-283.
http://dx.doi.org/10.1007/s11606-006-5063-z
[14] National Guideline Clearinghouse (2011) Guideline Title: Problem Drinking, Agency for Healthcare Research and Quality. http://www.guideline.gov/content.aspx?id=38894&search=problem+drinking
[15] National Institute for Health and Clinical Excellence (2010) Alcohol-Use Disorders: Preventing Harmful Drinking. Public Health Guidance 24. National Institute for Health and Clinical Excellence, National Health Service, UK.
http://www.nice.org.uk/guidance/ph24
[16] Scottish Intercollegiate Guidelines Network (2003) The Management of Harmful Drinking and Alcohol Dependence in Primary Care. Publication No.74. http://www.sign.ac.uk/pdf/sign74.pdf
[17] McQueen, J., Howe, T.E., Allan, L., Mains, D. and Hardy, V. (2011) Brief Interventions for Heavy Alcohol Users Admitted to General Hospital Wards. Cochrane Database of Systematic Reviews, 8, Article ID: CD005191.
http://dx.doi.org/10.1002/14651858.cd005191.pub3
[18] Yuzuriha, T. (2010) User Manual for the HAPPY Program of Early Intervention Strategies for Alcohol Problems, 2nd Edition (Arukōrumondaisōkikainyū no sutoratejī HAPPY puroguramushiyōmanuarudai 2 ban). National Hospital Or-ganization, Hizen Psychiatric Center, 35-47.
[19] Hiro, H. and Shima, S. (1996) Availability of the Alcohol Use Disorders Identification Test (AUDIT) for a Complete Health Examination in Japan. Nihon Arukoru Yakubutsu Igakkai Zasshi, 31, 437-450.
[20] Sunami, T. and Yuzuriha, T. (2012) The Importance of Early Intervention with Heavy Drinkers: The Practice of Brief Interventions (Taryōinshushani tai surusōki-kainyū no jūyōsei: Burīfuintābenshyon no jissenkara). The Journal of
Pub-lic Health Practice, 76, 195-199.
[21] Hara, T., Muto, T., Yoshimori, C., Ishido, K., Higuchi, S. and Yuzuriha, T. (2009) The Effectiveness of a Group Inter-vention Program for Heavy Drinkers in the Workplace. Japanese Journal of Alcohol Studies & Drug Dependence, 44, 290-291.
[22] Yoshioka, K. (2009) Empirical Testing of the Effectiveness of Interventions of the HAPPY Alcohol Dependence Pre-vention Program in Workers with Alcohol-Related Problems (Arukōruizonshōyobōpuroguramu (HAPPY) kainyū no kōkakenshō, arukōrikanrenmondai o motsushūrōsha o taishōni shite). The Journal of the Japanese Society of Alcohol-
Related Problems, 11, 117-121.
[23] Ministry of Health, Labour and Welfare (2014) 2012 Implementation Status for Lifestyle Disease Checkups and Counseling (Heisei 24 nendotokuteikenkōshinsa—Tokuteihokenshidō no jisshijōkyō). Ministry of Health, Labour and Welfare, Tokyo.
[24] Ames, G.M. and Bennett, J.B. (2011) Prevention Interventions of Alcohol Problems in the Workplace: A Review and Guiding Framework. Alcohol Research & Health, 34, 175-187.
http://pubs.niaaa.nih.gov/publications/arh342/175-187.htm
[25] McPherson, T.L., Goplerud, E., Olufokunbi-Sam, D., Jacobus-Kantor, L., Lusby-Treber, K. and Walsh, T. (2009) Workplace Alcohol Screening, Brief Intervention, and Referral to Treatment (SBIRT): A Survey of Employer and Vendor Practices. Journal of Workplace Behavioral Health, 24, 285-306.
http://dx.doi.org/10.1080/15555240903188372
[26] Fleming, M.F., Barry, K.L., Manwell, L.B., Johnson, K. and London, R. (1997) Brief Physician Advice for Problem Alcohol Drinkers: A Randomized Controlled Trial in Community-Based Primary Care Practices. The Journal of the
American Medical Association, 277, 1039-1045. http://www.ncbi.nlm.nih.gov/pubmed/9091691
http://dx.doi.org/10.1001/jama.1997.03540370029032
[27] Harada, K. and Moriyama, M. (2013). Drinkers’ Life Value and Their Resistance to Moderation in Drinking. Japan
Academy of Psychiatric and Mental Health Nursing, 22, 31-39.
[28] Rosenstock, I.M. (1974) Historical Origins of the Health Belief Model. Health Education Monographs, 2, 328-335.
http://dx.doi.org/10.1177/109019817400200403
[29] Becker, M.H. (1974) The Health Belief Model and Personal Health Behavior. Health Education Monographs, 2, 324- 508. http://dx.doi.org/10.1177/109019817400200407
[31] Bandura, A. (1977) Self-Efficacy: Toward a Unifying Theory of Behavioral Change. Psychological Review, 84, 191- 215. http://archive2.cra.org/Activities/craw_archive/dmp/awards/2007/Tolbert/self-efficacy.pdf
http://dx.doi.org/10.1037/0033-295X.84.2.191
[32] Sakano, Y. and Tojo, M. (1986) General Self-Efficacy Scale (Ippanseijikokouryokukan Syakudo no sakuseinokokoro-mi). Kodoryohokenkyu, 12, 73-82.
[33] Rosenberg, M. (1965) Society and the Adolescent Self-Image. Princeton University Press, Princeton.
[34] Mimura, C. and Griffiths, P. (2007) A Japanese Version of the Rosenberg Self-Esteem Scale: Translation and Equiva-lence Assessment. Journal of Psychosomatic Research, 62, 589-594.
http://dx.doi.org/10.1016/j.jpsychores.2006.11.004
[35] Kazawa, K. and Moriyama, M. (2013) Effects of a Self-Management Skills-Acquisition Program on Pre-Dialysis Pa-tients with Diabetic Nephropathy. Nephrology Nursing Journal, 40, 141-149.
[36] Gail, D.O., Michael, V.P., Linda, C.D., David, A.F., Susan, H.B., Marek, C.C., et al. (2012) A Brief Intervention Re-duces Hazardous and Harmful Drinking in Emergency Department Patients. Annals of Emergency Medicine, 51, 742- 750.
[37] McMahon, S. (1987) Alcohol Consumption and Hypertension. Hypertension, 9, 111-121.
http://dx.doi.org/10.1161/01.HYP.9.2.111
[38] Marmot, M.G., Elliott, P., Shipley, M.J., Dyer, A.R., Ueshima, H., Beevers, D.G., et al. (1994) Alcohol and Blood Pressure: The INTERSALT Study. British Medical Journal, 308, 1263-1267.
http://dx.doi.org/10.1136/bmj.308.6939.1263
[39] Okamura, T., Tanaka, T., Yoshita, K., Chiba, N., Takebayashi, T., Kikuchi, Y., et al., HIPOP-OHP Research Group (2004) Specific Alcoholic Beverage and Blood Pressure in a Middle-Aged Japanese Population: The High-Risk and Population Strategy for Occupational Health Promotion (HIPOP-OHP) Study. Journal of Human Hypertension, 18, 9- 16. http://dx.doi.org/10.1038/sj.jhh.1001627
[40] Kiyohara, Y., Shinohara, A., Kato, I., Shirota, T., Kubo, M., Tanizaki, Y., et al. (2003) Dietary Factors and Develop-ment of Impaired Glucose Tolerance and Diabetes in a General Japanese Population: Hisayama Study. Journal of
Epi-demiology, 13, 251-258. http://dx.doi.org/10.2188/jea.13.251
[41] Ben, G., Gnudi, L., Maran, A., Gigante, A., Duner, E., Iori, E., et al. (1991) Effects of Chronic Alcohol Intake on Car-bohydrate and Lipid Metabolism in Subjects with Type II (Non-Insulin-Dependent) Diabetes. The American Journal of
Medicine, 90, 70-76. http://dx.doi.org/10.1016/0002-9343(91)90508-U
[42] Iyadomi, M., Endo, K., Hara, T., Yuzuriha, T., Ichiba, M. and Tsutsumi, A. (2013) Effects of a Group Alcohol Inter-vention (S-HAPPY Program) at the Workplace for High Risk Alcohol Drinkers Using the Framework of the Specific Health Examination and Health Guidance System of the Metabolic Syndrome [Tokutei Hoken Shido no Wakugumi wo Riyoushita Hai-RisukuInshushani Taisuru Shokuikini Okeru Shudan Sesshu Shido (S-HAPPY Puroguramu) no Kouka].
The Journal of Science of Labour, 89, 155-165.
[43] Ito, C., Yuzuriha, T., Noda, T., Ojima, T., Hiro, H. and Higuchi, S. (2015) Brief Intervention in the Workplace for Heavy Drinkers: A Randomized Clinical Trial in Japan. Alcohol and Alcoholism, 50, 157-163.
http://dx.doi.org/10.1093/alcalc/agu090
[44] Hara, T., Muto, T., Yoshimori, C., Ishido, K., Sunami, T., Endo, K. and Yuzuriha, T. (2011) Effectiveness of Drinking Plan and Drinking Diary in Intervention Program (HAPPY Program) for Heavy Drinkers [Taryou Inshusha Kainyu Puroguramu (HAPPY Program) ni Okeru Inshumokuhyou to Inshunikki no Yukouseinitsuite]. Japanese Journal of
Alcohol Studies & Drug Dependence, 46, 347-356.
[45] Urakawa, K. and Hagi, N. (2008) Relationships between Worker Stress Coping Behaviors and Occupational Stress (Kinrōsha no sutoresutaishokōdō to shokugyōseisutoresu to no kanren). Mie Nursing Journal, 10, 89-92.
[46] Hester, R.K., Delaney, H.D. and Campbell, W. (2011) ModerateDrinking.com and Moderation Management: Out-comes of a Randomized Clinical Trial with Non-Dependent Problem Drinkers. Journal of Consulting and Clinical
Psychology, 79, 215-224. http://www.ncbi.nlm.nih.gov/pmc/articles/PMC3066281/pdf/nihms271551.pdf
http://dx.doi.org/10.1037/a0022487
[47] Spijkerman, R., Roek, M.A., Vermulst, A., Lemmers, L., Huiberts, A. and Engels, R.C. (2010) Effectiveness of a Web- Based Brief Alcohol Intervention and Added Value of Normative Feedback in Reducing Underage Drinking: A Ran-domized Controlled Trial. Journal of Medical Internet Research, 12, e65. http://dx.doi.org/10.2196/jmir.1465