Fuzzy Based Detection of Desertification-prone Areas: A
Case Study in Khorasan-Razavi Province, Iran
Mina Shiravi, Adel Sepehr
*Department of Desert and Arid Zone Management, Ferdowsi University of Mashhad, Mashhad, Iran
Copyright©2017 by authors, all rights reserved. Authors agree that this article remains permanently open access under the terms of the Creative Commons Attribution License 4.0 International License
Abstract
In this article, a desertification susceptibility map was developed over Khorasan Razavi ecoregions located in northeastern Iran with arid and semi-arid environments. For this purpose, a fuzzy algorithm regarding Dempster-Shafer theory was applied based on six main indicators including wind erosion, aridity severity, soil erodibility, landuse type, salinization and vegetation cover density chosen by Delphi techniques. The indicators were combined under linear fuzzy function and gained to a membership function for each layer. The results indicated about 43.5 % region is susceptible to soil erodibility; also cold hyper-arid and ultra-cold arid deserts ecoregions show a high range of sustainability to desertification.Keywords
Desertification Vulnerability, Fuzzy Logic, Dempster-Shafer Theory, Fuzzy membership, Life Cycle Assessment
1. Introduction
Desertification is one of the main global challenges in recent decades, accelerated by climate changes and anthropogenic activities. Arid and semiarid lands with fragile ecosystem are more susceptible to this phenomenon. More than 40 percent of the global land surface are covered with these environments and provide habitat to approximately 1 billion humans [1]. The problem of desertification is a complex degradation process with different environmental consequences. The first step to combat desertification is a diagnosis of causes and effectiveness of action programs. Multiple factors of natural and anthropogenic criteria such as agricultural practices, overgrazing, mining, fire, deforestation, urbanization, population pressure, soil loss, low biomass, and climate fluctuations are in related to accelerate desertification and land degradation [2]. These complex factors determine the vulnerability of an ecosystem to desertification, which is bolded in arid and semiarid ecosystems. To recognize vulnerable ecological regions (ecoregion) to desertification
process, an assessment of the process is needed.
In recent years, application of fuzzy set theory shows successful results in decreasing of ambiguous classification in the assessment of desertification [3]. The concept of fuzzy set defined by Zadeh in 1965 and refers to a set of elements or hypothesis with continuous grades of membership. A fuzzy system is formed by three basic elements including fuzzy set, membership functions and fuzzy rules [4]. In fuzzy set theory, relationships define a membership function and each element or member covering a value range between zero to one, which reflects the degree of its belonging to the collection. Membership degree of closer to one shows a stronger relationship and on the other hand, the relationship is weaker when the degree of membership is closer to zero. This recommendation is able to convert many of the concepts, variables, and systems that are vague, inaccurate to mathematical concepts and provide decision making under uncertainty Conditions [5].
Due to deal ability of Fuzzy logic and fuzzy sets to uncertainty and vague data, they have been widely used in environmental issues, such as evaluation of Land suitability based on soil profile [5], soil classification [6], time-series modeling of air pollution [7], soil erosion [8,9], modeling of spatial distribution and density of vegetation [10], environmental impact assessment [11,12], analysis of agricultural suitability [13], risk assessment of natural hazards [14-16], fire risk assessment [17,18], salinization assessment in drylands [19-21], landslide hazard zoning [22], water resources management [23], renewable energy [24] and desertification assessment [25-31]. Therefore fuzzy logic can be a powerful method to classify and monitoring of environmental processes over a time period, dempster-shafer theory [26] and fuzzy logic [25, 27, 31] can handle uncertainty in the assessment of desertification.
Erodibility have been studied. Ahmadzadeh and Petrou [26] also studied burned forests to evaluate the risk of desertification by using remote sensing data and Belief functions. In their work, to decrease the uncertainty of data result of data sampling and gathering, Dempster- Shafer theory was applied to classify and weighting.
Mashayekhan and Honardoust [27] used a multi-criteria evaluation method to investigate desertification process in Trouti watershed, Golestan Province, Iran. In this research, 7 factors of soil texture, aspect, rainfall, the sensitivity of geological formation to erosion, hydrologic soil group, slope and land use were digitized in GIS software and converted to fuzzy maps by using fuzzy membership functions. Then the weight of each factor was determined by AHP model. In the study area, the most important factors affecting desertification process were land use and sensitive geological formations to erosion.
Dasgupta et al. [29] assessed desertification vulnerability risk using geostatistical model and fuzzy classification system for natural parameters (e.g. drought, soil erodibility, soil quality, cover, land use) and used cumulative weighted method for socio-economic parameters (e.g. population pressure and percentage of literate people). They used the Gaussian membership function to calculate membership of each variable in different classes. The results indicated that, four major sources of land degradation including erosion, salinity and alkalinity, deforestation and growing urbanization.
In the same study, Dasgupta et al. [30] assessed the areas affected by desertification and modeled five natural indicators including slope, pH, soil depth and texture and vegetation indices by using fuzzy logic. The parameters were classified based on amounts of standard deviation. In this study, by using membership functions the transition points identified to two classes. Wang et al. [31] presented a methodology for assessment of desertification by combining 19 indicators (e.g. hazard, exposure, vulnerability and restorability factors) and fuzzy comprehensive evaluation method in a Horqin Sand Land region. The fuzzy sets took the membership function to convert uncertainty into certainty. In this work the trapezoidal distribution membership function was used.
In the present work, the Desertification Susceptibility of Khorasan Razavi Ecoregions was modeled by using the fuzzy membership functions and Dempster-shafer theory. Desertification criteria were studied based on life cycle assessment.
2. Materials and Methods
2.1. Study Area
The approach of this study was applied in Khorasan Razavi province located in northeastern Iran with about 128'430 km2areas and longitudes 59° 19ʹ to 61° 16ʹ east, and
latitudes 33° 52ʹ to 37° 42ʹ north (figure 1). Desert and
semi-desert environments cover more than 60% of Khorasan Razavi. The annual rainfall is variable from 100 mm in the southern zones to 400 mm approximately in the northern regions. The study area has hot and dry weather and very waterless. Winds are famous for “120 days winds” blowing from the Hindu Kush Mountains in Afghanistan and affecting the area, especially in summer periods. Rocky outcrops in the region are included limestone, dolomite, conglomerate, tuff, sandstone and young alluvium with Paleozoic-Quaternary age.
The methodology of this work have been explained in two steps 1) fuzzy model applied to calculate mass function and membership functions and 2) LCA method and criteria selection were used to measure ecoregion susceptibility.
2.2. Methodology
2.2.1. Dempster-Shafer/LCA model
The Dempster-Shafer theory, also known the theory of belief functions and evidence theory, established by means of the upper and lower probabilities by Dempster [32]. Then Glenn Shaffer developed it and presented belief functions in 1976 [33]. This theory is important to the discussion of beliefs from one situation or system of situations. Beliefs about events are not the same, but using this theory can combine and reviewed the evidence of the situation in a similar way [34].
In this study, we used Dempster-Shafer method to combine items of evidence that prepare by fuzzy linear. This theory assumes that there is a finite set of elements which are completely unique and called the frame of discernment (Ω) as shown in equation 1. We considered six elements for desertification assessment, so a frame of discernment was defined for each factor, the frame of discernment for aridity index, landuse, wind erosion, soil erodibility, salinization, vegetation cover.
Ω = {H1 , H2… HN} (1)
Where H1, H2, …, Hn are classes of each element (e.g.
landuse classes including forest (L1), rangelands (L2),
settlement (L3), agriculture (L4), bare rock (L5), desert (L6)).
The set of Ω has 2Ω subsets and each subset may consist of a single element, a conjunction of elements and an empty subset (ɸ) as shown in equation 2, 3.
P (Ω) =2Ω= {ɸ, {H
1}… {HN},
{H1, H2}… {H1, HN}… {Ω }} (2)
P(Ω)={ɸ,{L1},{L2},{L3},{L4},{L5},{L6},{L1,L2}…{L1,L6},
{L1,L2,L3}…{L1,L2,L6},{L1,L2,L3,L4}…{L1,L2,L3,L6},
{L1, L2, L3, L4, L5}… {L1, L2, L3, L4, L6},
{L1, L2, L3, L4, L5, L6}} (3)
between zero and one. The mass function relationship presented in equations 4, 5 and 6.
m: P (Ω) → [0, 1] (4)
m (ɸ) =0 (5)
∑A m(L)=1 (6)
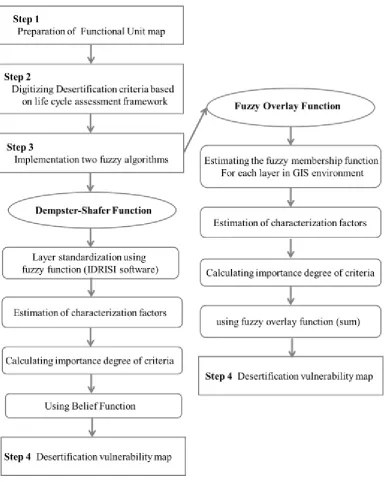
Any subset L of Ω that holds m (L) > 0 is called a focal element. In this theory, two functions play a significant role, including belief (bel) and plausibility (Pl) functions. Bel measures the minimal amount of probability and plausibility function measures the maximal amount of probability. IDRISI software (version 14.0) was used for providing indicators maps and belief function map. Flowchart of the method has been used in the study is given in Fig 4. In step one a functional unit map based on ecoregions was prepared. The concept of the functional unit is quantified to performance a system for using that as a reference unit [35].
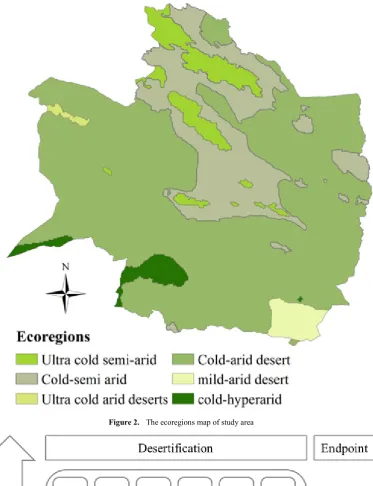
In this study the functional unit map prepared for Khorasan Razavi ecoregions based on Baileys [36]. Ecoregions are large-scale ecosystems that have the same features and are defined by climate conditions [37]. Therefore, ecoregion map was obtained by using the modified De Martonne climate index (Formula 7) based on Aridity (Ai) and thermal indices (mj).
Ai=P/T+10 (7) Where Ai is aridity index, P is annual rainfall (mm) and T annual normal temperature. Then it was classified into six interval classes as shown in (figure 2).
Accordingly, desertification risk which defined by UNCCD [38], all ecoregions of the area are susceptible to desertification.
In step two, the criteria were classified and studied based on life cycle assessment framework. The life cycle assessment framework is consisting of compilation and evaluation of the inputs, outputs and the potential environmental impacts of a product system throughout its life cycle [39].
Firstly this method was developed by the society of environmental toxicology and chemistry, and then the International Standard Organization (ISO) provided ISO14041-44 instructions. Life cycle assessment methodology (LCA) was initially used for environmental assessments of industrial systems. Later it was adapted to agricultural systems [40]. Many studies have been done in landuse assessment by using life cycle assessment [41-44]. The standardized LCA framework consists of four phases [35]: 1. The goal and scope definition, 2. The life cycle inventory analysis, 3. Impact assessment and 4. The interpretation phase.
In the first phase, functional unit and certain scale of the system is defined according to the purpose and the objective of the study. In the selection of study scale, two factors should be considered, including access to required data for an appropriate period of time in the study area and the possibility of using remote sensing techniques to obtain the
considered data [45]. As noted, in this study the map of ecoregions was considered as a functional unit map.
The life cycle inventory (LCI) phase consists of data collection and selection of appropriate methods for quantification the inputs and outputs data which are related to the system under study.
In this phase, the most important factors on desertification sensitivity were determined and required information was collected. In the impact assessment phase of LCA (LCIA), the significance of potential environmental impacts is evaluated using the LCI results. For this phase, six steps were considered including a selection of midpoint impact categories and category endpoints, selection of characterization methods, classification, characterization, normalization, and weighting. The last two steps are optional. In this study Aridity, landuse, wind erosion, soil erodibility, salinization and vegetation cover were defined as midpoint impact categories and desertification vulnerability was included as endpoint category (figure 3). The importance degree of criteria was calculated using the methodology of Entropy. Interpretation phase of LCA should deliver results, explain limitations and provide recommendations.
In step 3, two fuzzy algorithms including fuzzy overlay and Belief function were implemented. In the first method, fuzzy membership for each layer was determined using fuzzy membership function by ArcGIS version 10.1. Accordingly, Sepehr and Parvian [46] an MSLarge function based on fuzzy membership of ArcGIS 10.1 was used for soil erodibility and wind erosion factors, MS Small function was applied for aridity and vegetation cover factors and a linear function was used for landuse and salinization factors. The fuzzy linear function applies a linear function between minimum and maximum values. Fuzzy MS Large and MS Small functions are based on a specified mean and standard deviation. With this method, each pixel received a value between zero to one. A zero value indicates non-membership and one indicates the highest degree of membership. Then, the amount of characterization factor (CFs) was estimated for each variable and ecoregion using the zonal statistical function. The importance degree of criteria was calculated using Entropy algorithm. After that, we applied importance coefficient of indicators in information layers. Finally, desertification vulnerability map was prepared using fuzzy overlay function (sum) in ArcGIS environment.
2.2.2. Weighting Method
Entropy is a very important concept in various sciences and theory of information. This theory can be used for assessing the importance degree of criteria. In this method, whatever the dispersion of index values is greater; it is the most important indicator.Weights of criteria were estimated through the following steps, including formation the decision matrix, calculation of Pij, amount of entropy (Ej), the amount of uncertainty dj and the calculation of the weights (wj) as shown in the equations of 8, 9, 10, and 11.
Pij=aij/∑aij (8)
Ej=-k∑ [pij ln pij] (9)
dj= 1-Ej (10)
Wj=dj/∑dj (11)
2.2.3. Desertification Criteria Anthropogenic effects and critical climate conditions are the major reasons caused desertified ecosystem of Khorasan - Razavi. Six main factors including aridity, land use, wind erosion, soil erodibility, salinization, and vegetation were selected based on Delphi technique and decision makers’ opinions. In the selection of criteria, four factors were considered, including the relation of criteria with desertification vulnerability, correlation degree with a functional unit, high precision and the ability to estimate data on the local scale. The aridity index was provided by meteorological data observed by synoptic stations in Khorasan Razavi province from 2009 to 2013 including monthly precipitation and temperature. The aridity index was calculated by the Formula (13) and interpolated using IDW function in a GIS environment. So the study area was classified into 4 interval classes including arid (0.05-0.2), severe semi-arid (0.2-0.25), moderate semi-arid (0.25-0.3) and slight semi-arid (0.3-0.45). AI=P/ETP (12)
Where AI, p and ETP present the aridity index, annual average precipitation and evapotranspiration (mm)respectiv ely. Land use map was provided and classified by maximum likelihood algorithm and supervised classification based on ETM+ imagery data August 2012. Six landuse classes including desert, bare rock, Agricultural lands, settlement, rangelands, and forests were extracted
.
Wind erosion criterion was determined based on wind erosion map provided by the organization of natural resources and watershed management of Khorasan Razavi in 2008. Accordingly, the study area was classified into three classes low, moderate and high erosions. For soil erodibility factor, we used actual soil erosion map prepared by Sepehr et al. based on CORINE method [47]. Therefore, the layers of potential soil erosion and land cover were combined to produce the actual soil erosion map and classified into 3 classes including high, moderate and low erodibility. Salinization is one of the main factors, which occur by natural processes or human activities and causes soil degradation and desertification. Salinization map was prepared using MODIS imagery data (MOD13Q1) provided every 16 days at 1km spatial resolution in August 2013. So this index was calculated using Equation 13 [48] and IDRISI software and classified into three classes including low (<0.17), moderate (0.17-0.2) and high (>02) according to Mehta and et al. classification [49]. SI=√BLUE*RED (13)Where SI, RED, and BLUE present the Salinity index, the reflectance of red band and blue band. The enhanced vegetation index map was prepared using MODIS imagery, EVI index data (Equation 14) with 16 days and 1km resolution in May, June and July 2013 (MOD13Q1). EVI=2.5(NIR-R)/(NIR+6R-7.5BLUE+1) (14) Where EVI, NIR, R, and BLUE present the Enhanced vegetation index, the reflectance of infrared band, red band and blue band. A flowchart of the methodology has shown in figure 4.
3. Results and Discussion
3.1. Desertification Criteria of Study Area
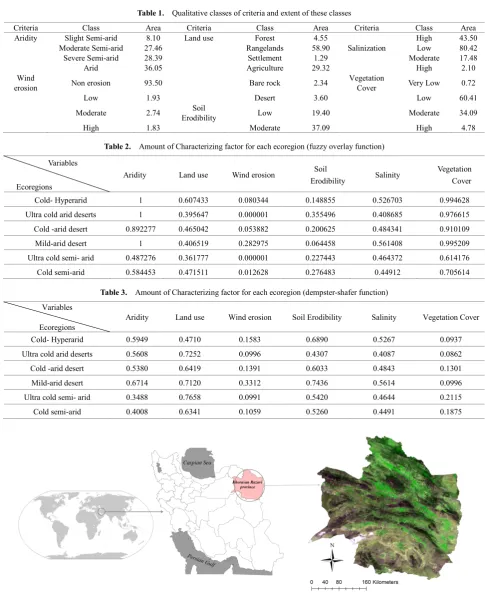
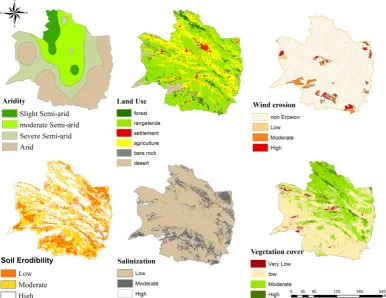
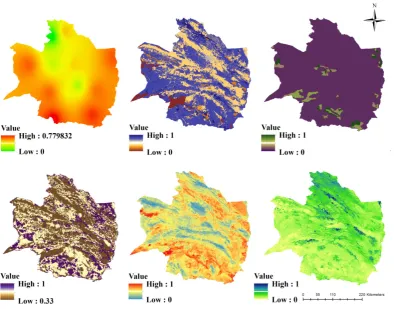
The main information layers (aridity, land use, wind erosion, soil erodibility, salinization, vegetation cover) are shown in figure 5. Table 1 present the percent of the study area for each classification. In the study area, arid and semi-arid are the main climate so according to the UNCCD hole of the study area is at risk of desertification. The results indicated that Prevailing land use is rangeland and about 61% areas of the studied region don’t have adequate vegetation. In these places, resilience range of the ecosystem is very low. Also according to the soil erodibility map, a large amount of study area is very fragile and sensitive to erosion. The amount of salinity index is 0 (low) to 0.3 (high), as shown in table 1; the amount of this index in 80.42 % areas of studied region is low.
3.2. Fuzzy Overlay Function
of province are more sensitive to desertification.
The results of overlaying ecoregion layer (functional unit) with indicators layers are presented in Table 2. According to table 2, an ecoregion of Mild arid desert has the most value of aridity, wind erosion, salinity, and vegetation index in the study area. Also, an ecoregion of ultra-cold arid deserts has the most value of soil erodibility and the most value for land use was assessed for cold hyper-arid.
3.3. Dempster-Shafer Theory
The Dempster-Shafer theory was used in the second method. Fuzzy maps are shown in Figure 7. According to this fig, the region is more sensitive to desertification when the values of appropriate and inappropriate area are closer to one and zero, respectively. In this study, landuse, soil erodibility, and enhanced vegetation indices were considered as an inappropriate factor and so places which are high sensitive areas received the lowest score. Therefore location with maximum vegetation density regarding forest got the highest score (1) and place with rarity in biomass regarding desert landscape got a lower score (0) in the study area.
The result of the overlaid ecoregions and fuzzy layers are presented in table 3. Ecoregion of mild arid desert got the highest cfs for aridity, wind erosion, soil erodibility and salinity indexes. So results show that ecoregion of the mild arid desert is the most sensitive ecoregion for the purpose of aridity, wind erosion, and salinity indices. But this ecoregion has the lowest susceptibility for the purpose of soil erodibility index. Also, an ecoregion of ultra-cold semi-arid got the lowest value for landuse and vegetation indices and has the most susceptibility for the purpose of them.
The preference degree of each indicator was calculated using Entropy algorithm and shown in figure 8. The results showed that wind erosion got the highest coefficient for both of them. After that soil erodibility and vegetation index got the high preference for fuzzy overlay and dempster-shafer function, respectively. Also, salinity index has the lowest degree of impact.
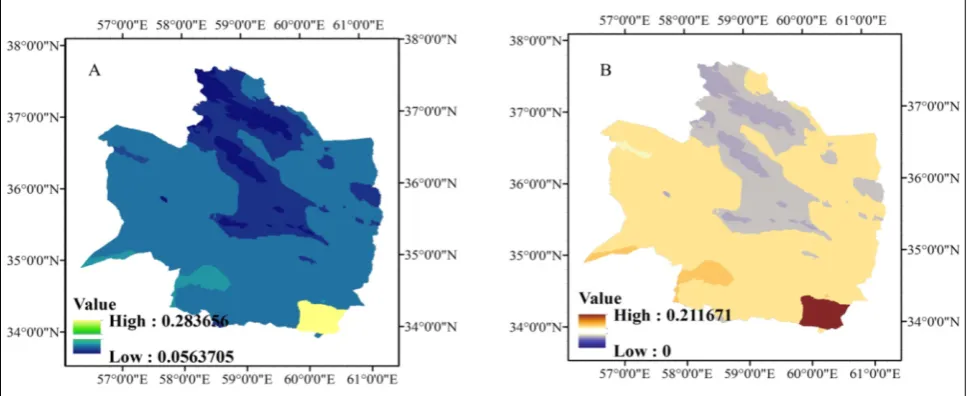
After that the final map was prepared using fuzzy overlay function (figure 9A). On this basis, there are different conditions of desertification susceptibility in the study area. According to this method, ecoregions were ranked based on desertification susceptibility. The result showed that ecoregion of the mild arid desert is the most sensitive areas to desertification in Khorasan Razavi province. The Dempster-Shafer theory was used in the second method (figure 9B). In this map ecoregions of the study area were ranked based on the sustainability to desertification too. According to this method, ecoregion of the mild arid desert is most sensitive. The interpretation phase (4th step of life cycle
framework) consists of identification of significant issues which is evaluated by completeness check, sensitivity check, consistency check or other checks. In other word quality and robustness of results is analyzed in this phase. According this analysis, limitations are explained and then appropriate
recommendations and strategic plans are considered. For this step results of the study was compared by Tervonen et al. [50] and indicated same findings about belief function for detection of desertification prone areas in Khorasan-Razavi Province. The results indicated that a large part of Study area is very vulnerable to desertification.
4. Conclusions
In this article has been applied a fuzzy approach based on a dempster-Shaffer algorithm to predict desertification-pron e areas by life cycle assessment (LCA) framework. Distinguishing the desertification sensitivity areas was possible by estimating six effective factors and commixture those on the format of fuzzy membership relations. The gamma and linear functions are suitable for membership analysis. The membership functions allow making out the areas representing the transitional zone toward desertified landscape. Thus the methodology applied in this article identifies the prone areas to desertification with their susceptibility status appropriate decision making for choosing main effective criteria. The future scope of the study is to predict the risk severity in future and to validate the model efficiency with future status. The assessment of socio–economic parameters can also be incorporated into the study for more accurate appraisal of desertification. Fuzzy techniques applying in this study can be useful for reducing the uncertainty and ensure an accurate view of region conditions. So it is possible to provide appropriate management decisions. The use of Fuzzy Logic with LCA can be useful tool for desertification monitoring and assessment in an environmental approach and can be judged by the variety of results obtained with different algorithms.
Acknowledgements
The authors are many thanks from colleagues of natural resources and environment college of Ferdowsi University of Mashhad for their support and cooperation during research steps.
Author Contributions
Mina Shiravi conducted the field work and contributed to the analysis of the data as well as in writing the first draft. Adel Sepehr created idea and developed the study design, supervised research and data analysis and contributed in revising the manuscript.
Conflicts of Interest
Table 1. Qualitative classes of criteria and extent of these classes
Criteria Class Area Criteria Class Area Criteria Class Area
Aridity Slight Semi-arid 8.10 Land use Forest 4.55 High 43.50
Moderate Semi-arid 27.46 Rangelands 58.90 Salinization Low 80.42
Severe Semi-arid 28.39 Settlement 1.29 Moderate 17.48
Arid 36.05 Agriculture 29.32 High 2.10
Wind
erosion Non erosion 93.50 Bare rock 2.34 Vegetation Cover Very Low 0.72
Low 1.93 Desert 3.60 Low 60.41
Moderate 2.74 Erodibility Soil Low 19.40 Moderate 34.09
High 1.83 Moderate 37.09 High 4.78
Table 2. Amount of Characterizing factor for each ecoregion (fuzzy overlay function) Variables
Ecoregions
Aridity Land use Wind erosion Soil
Erodibility Salinity
Vegetation Cover
Cold- Hyperarid 1 0.607433 0.080344 0.148855 0.526703 0.994628
Ultra cold arid deserts 1 0.395647 0.000001 0.355496 0.408685 0.976615
Cold -arid desert 0.892277 0.465042 0.053882 0.200625 0.484341 0.910109
Mild-arid desert 1 0.406519 0.282975 0.064458 0.561408 0.995209
Ultra cold semi- arid 0.487276 0.361777 0.000001 0.227443 0.464372 0.614176
Cold semi-arid 0.584453 0.471511 0.012628 0.276483 0.44912 0.705614
Table 3. Amount of Characterizing factor for each ecoregion (dempster-shafer function) Variables
Ecoregions Aridity Land use Wind erosion Soil Erodibility Salinity Vegetation Cover
Cold- Hyperarid 0.5949 0.4710 0.1583 0.6890 0.5267 0.0937
Ultra cold arid deserts 0.5608 0.7252 0.0996 0.4307 0.4087 0.0862
Cold -arid desert 0.5380 0.6419 0.1391 0.6033 0.4843 0.1301
Mild-arid desert 0.6714 0.7120 0.3312 0.7436 0.5614 0.0996
Ultra cold semi- arid 0.3488 0.7658 0.0991 0.5420 0.4644 0.2115
Cold semi-arid 0.4008 0.6341 0.1059 0.5260 0.4491 0.1875
[image:6.595.60.546.67.673.2] [image:6.595.66.545.87.531.2]Figure 2. The ecoregions map of study area
[image:7.595.109.502.513.680.2]Figure 5. Main information layers for desertification vulnerability assessment
[image:9.595.108.495.81.379.2] [image:9.595.109.501.408.712.2]Figure 7. Fuzzy layers for desertification vulnerability assessment. (A) aridity index, (B) Land use, (C) wind erosion, (D) Soil erodibility, (E) Salinity and (F) Enhanced vegetation index.
[image:10.595.110.505.78.387.2] [image:10.595.117.494.445.637.2]Figure 9. Desertification Susceptibility map A: using fuzzy overlay function, B: using Belief function
REFERENCES
[1] Veron S R, Paruel J M, Oesterheld M, 2006. Assessing desertification. Journal of Arid Environments, 66(4): 63- 751. [2] Lin M L, Chen Ch W, Wang Q B et al., 2009. Fuzzy model-based assessment and monitoring of desertification using MODIS satellite imagery. International Journal of Computer Aided Engineering and Software, 26(7): 745–760. [3] Sepehr A, Zucca Cl, 2012. Ranking Desertification Indicators
Using TOPSIS Algorithm. Journal of Natural Hazards, 62: 1137-1153.
[4] Klein L, 1999. Sensor and Data Fusion Concepts and Applications. SPIE Optical Engineering Press.
[5] Burrough P A, MacMillan R A, Deursen W, 1992. Fuzzy classification methods for determining land suitability from soil profile observations. Journal of Soil Science, 43: 193–210.
[6] Lark R M, Bolam H C, 1997. Uncertainty in prediction and interpretation of spatially variable data on soils. Geoderma, 77: 263–282.
[7] Nunnari G, Nucifora A, Randieri C, 1998. The application of neural techniques to the modelling of time-series of atmospheric pollution data. Ecological Modelling, 111: 187–205.
[8] Mitra B, Scott H D, Dixonand J C et al., 1998. Applications of fuzzy logic to the prediction of soil erosion in a large watershed. Geoderma, 86: 183–209.
[9] Saadatpour M, Afshar A, Afshar M H, 2011. Fuzzy pattern recognition method for assessing soil erosion. Environ Monit Assess, 180: 385–397.
[10]Kampichler C, Barthel J, Wieland R, 2000. Species density of foliage-dwelling spiders in field margins: a simple fuzzy rule-based model. Ecological Modelling, 129: 87–99. [11]Silvert W, 2000. Fuzzy indices of environmental conditions.
Ecological Modelling, 130: 111–119.
[12]Enea M, Salemi G, 2001. Fuzzy approach to the environmental impact evaluation. Ecological Modelling, 136: 131– 147. [13]Ahmed T R N, Rao K G, Murthy J S R, 2000. GIS-based fuzzy
membership model for cropland suitability analysis.
Agricultural Systems, 63: 75–95.
[14]Rashed T, Weeks J, 2003. Assessing vulnerability to earthquake hazards through spatial multi-criteria analysis of urban areas. International Journal of GIS, 17: 547–576. [15]Tangestani M H, 2004. Landslide susceptibility mapping
using the fuzzy gamma approach in a GIS, Kakan catchment area, southwest Iran. Australian Journal of Earth Sciences, 51: 439–450.
[16]Dixon B, 2005. Groundwater vulnerability mapping: A GIS and fuzzy rule based integrated tool. Applied Geography (Sevenoaks, England), 25: 327–347.
[17]Vadrevu K P, Eaturu A, Badarinath K V S, 2010. Fire risk evaluation using multicriteria analysis: a case study. Environ Monit Assess, 166: 223–239.
[18]Miguel E, Castillo S, 2012. The identification and assessment of areas at risk of forest fire using fuzzy methodology.
Applied Geography, 35: 199-207.
[19]Metternicht G, 2001. Assessing temporal and spatial changes of salinity using fuzzy logic, remote sensing and GIS, Foundations of an expert system. Ecological Modelling, 144: 163–179.
[20]Malins D, Metternicht G, 2006. Assessing the spatial extent of dry land salinity through fuzzy modeling. Ecological Modelling, 193: 387–411.
[21]Giordano R, Liersch S, 2012. A fuzzy GIS-based system to integrate local and technical knowledge in soil salinity monitoring. Environmental Modelling & Software, 36: 49-63. [22]Pourghasemi H R, Moradi H R, Fatemi Aghda S M et al., 2011.
[image:11.595.63.549.77.275.2][23]Halili M Gh, Sadoddin A, Mosaedi A, Salman Mahini A, 2009. Fuzzy multicriteria decision making for surface water resources management in Bustan Dam-Golestan Province.
Journal of Water and Soil Conservation, 16(4): 1-24. [24]Cheng C H, Zhou Y H, Yue K W et al., 2011. Study of SEA
indicator system of urban green electricity power based on fuzzy AHP and DPSIR model. Energy procedia, 12: 155-162. [25]Sasikala K R, petrou M, 2001. Generalized fuzzy aggregation in estimating the risk desertification of a burned forest.
Journal of fuzzy set and systems, 118: 121-137.
[26]Ahmadzadeh M R, Petrou M, 2001. An Expert System with Uncertain Rules Based on Dempster-Shafer Theory.
Geoscience and Remote Sensing Symposium, IEEE International, 2: 861-863.
[27]Mashayekhan A, Honardoust F, 2011. Multi-criteria Evaluation model for desertification hazard zonation mapping using GIS. Journal of Applied biological sciences, 5: 49-54.
[28]Sepehr A, Ekhtesasi M R, Almodaresi S A, 2012. Development of Desertification Indicator System Base on DPSIR (Take advantages of Fuzzy-TOPSIS). Geography and Environmental Planning Journal, 45(1): 33-50.
[29]Dasgupta A, Sastry K L N, Dhinwa P S et al., 2012. Fuzzy logic model for desertification vulnerability risk assessment – A case study, district Bellary, Karnataka. Journal of Geomatics, 6(2): 36-54.
[30]Dasgupta A, Sastry K L N, Dhinwa P S et al., 2013. Identifying desertification risk areas using fuzzy membership and geospatial technique – A case study, Kota District, Rajasthan. Earth Syst. Sci., 122(4): 1107-1124.
[31]Wang Y, Zhang J, Guo E, Sun Z, 2015. Fuzzy Comprehensive Evaluation-Based Disaster Risk Assessment of Desertification in Horqin Sand Land, China. International Journal of Environmental Research and Public Health, 12: 1703-1725.
[32]Dempster A P, 1967. Upper and Lower Probabilities Induced by a Multivalued Mapping. Annals of Mathematical Statistics, 38: 325–339.
[33]Shafer G, 1976. A Mathematical Theory of Evidence. Princeton University Press (NJ).
[34]Pasha E, mostafaei H, Khalaj M, Khalaj F, 2013. Calculate the Uncertainty Interval Based on Entropy and Dempster Shafer Theory of Evidence. International Journal of Industrial Engineering & Production Management, 24(2): 215-223. [35]ISO (International Standard Organization) 14040, 2006.
Environmental management – life cycle assessment – Principles and framework, Technical standard, Geneve, Switzerland.
[36]Bailey R G, 1998. Ecosystem geography Springer (New York).
[37]Bailey R G, 2014. Ecoregions Springer New York (USA). [38]United Nations Convention to Combat Desertification in
Countries Experiencing serious Drought and/ or Desertification, 1994. Particularly in Africa.
[39]ISO (International Standard Organization) 14044, 2006. Environmental management – life cycle assessment – Requirements and guidelines, Technical standard, Geneve, Switzerland.
[40]Nunez M, Civit B, Munoz P et al., 2010. Assessing potential desertification environmental impact in life cycle assessment.
Int J Life Cycle Assess, 15(1): 67-78.
[41]Cowell S J, Clift R, 2000. A methodology for assessing soil quantity and quality in life cycle assessment. Journal of Cleaner Production, 8(4): 321-331.
[42]Koellner T, Scholz R W, 2007. Assessment of land use Impacts on the Natural Environment, Part 1: an analytical framework for pure land occupation and land use change. The International Journal of Life Cycle Assessment, 12(1): 16-23. [43]Koellner T, Scholz R W, 2008. Assessment of land use
Impacts on the Natural Environment, Part 2: generic characterization factors for local species diversity in central Europe. Int J Life Cycle Assess, 13(1): 32-48.
[44]Mila I Canals L, Bauer C, Depestele J et al., 2007. Key elements in a framework for land use impact assessment in LCA. Int J Life Cycle Assess, 12(1): 5-15.
[45]DESERTLINKS, Desertification Indicator System for Mediterranean Europe (DIS4ME), 2004. European Commission, Contract EVK2-CT-2001-00109.
[46]Sepehr A, Parvian N, 2014. Desertification vulnerability mapping and Developing Combating Strategies in the Ecosystem of Khorasan Razavi Province using PROMETHEE Algorithm. Journal of Earth Science researchers, 2(8): 58-71.
[47]Sepehr A, Zucca C, Nowjavan M R, 2014. Desertification Inherent Status Using Factors Representing Ecological Resilience. British Journal of Environment & Climate Change, 4(3): 279-291.
[48]Khan M N, Rastoskuev V.V, Sato Y, Shiozawa S, 2005. Assessment of hydrosaline land degradation by using a simple approach of remote sensing indicators. ELSEVIER, 77(1- 3): 96-109.
[49]Mehta M, Anh V Le, Saha S K, Agrawal Sh, 2012. Evaluation of Indices and Parameters Obtained from Optical and Thermal Bands of Landsat 7 ETM+ for Mapping of Salt
Affected Soils and Water-Logged Areas. Asian Journal of Geoinformatics, 12(4): 9-16.
[50]Tervonen T, Sepehr A, Kadzinski M, 2015. A multi-criteria inference approach for anti-desertification management.