DEFECT ANALYSIS OF INVESTMENT CASTING USING COMPUTER PREDICTION
Ng Chuan Huat, Sulaiman Hassan, Sulastri Sabudin, Saparudin Ariffin
Abstract
In recent years, computer simulation of investment casting process has begun to complement the experience-based approach in meeting the demands of high quality investment cast parts in a cost effective manner. Results of the simulation of the filling of cast part sample and its solidification process are presented in this paper. The aim of this research was to identify defects during the casting process. A case study has been conducted, involving one of the mechanical parts in a casting industry. The computations are carried out using MAGMAsoft, and the defect was predicted. The findings are compared with the result of similar experiment using Radiographic examination. It shows that there is excellent agreement between computer predicted data and the result from Radiography as the defects occur at the same predicted locations which appears as shrinkage porosity.
Keywords : Investment Casting, Defect, MAGMA soft, Radiography
Introduction
In recent years, computer simulation of the process has begun to complement the
experience based approach in meeting the demands of high quality investment cast parts
in a cost effective manner. Modeling of solidification is becoming increasingly feasible
with the advent of parallel computers. Software is available not only for thermal and flow
modeling, but for calculation of grain structure, porosity, hot tearing, hotspot and solid
state transformation. Typically, mold designs go through iteractions before a final
configuration is achieved. In this case, most of the casting Malaysia industry still
practiced “trial and error” approach to implemented their product development process.
This is due to the complexity of the process itself, which on the other hand helped the
engineers to improve their skills and knowledge. Positively, they are gaining more insight
to control the key variables each day during focusing on experimentation. One of the
problems associated with this method is when the design does not fulfill the design
specification; it produces defects on the casting part. Recent practices are to correct
design errors through modifications to the design itself or to the process, based on
experience without attempting to diagnose the exact cause of the defects. Since it is
relatively complex and expensive compared to other casting processes, these approach
will become tedious, time consuming and significantly affect the total manufacturing
Kolej Universiti Teknologi Tun Hussein Onn, Beg Berkunci 101, 86400 Batu Pahat, Johor Malaysia
cost. Hence a method to analyze possible causes that result defects during filling and
solidification process needs to be researched. The objective of the research work is to
identify the defect occurred in the casting part which cast by investment casting process.
This then can be used for predict the defects before continue to produce the casting part.
Literature Review
Timothy and Frye (1999) discussed about the characterization, analysis and
correction of investment casting defects are divided into two phases, diagnosis and
remedy. They introduced a defect analysis map, which contain the guide for diagnostic
journey from symptom to cause and the remedial journey from cause to remedy. They
also suggested to create a brainstorming session to discuss all possible contributions to
the defect and introduced the fishbone diagram to lead the way to corrective action at the
second phase of remedy. Chijiwa (2000) classified shrinkage as external shrinkage,
internal shrinkage and shrinkage cavities. An external shrinkage and shrinkage cavity
sometimes called primary shrinkage or pipe. Unlike primary shrinkage, secondary
shrinkage is wholly internal and does not appear on the external surface. Micro shrinkage
and shrinkage porosity are classified under internal shrinkage which located at the thicker
section parts. Brown et. al. (2002) was applied computer simulation in a design
development of a complex foundry casting. The analysis focused on problem replacing a
cast iron component with a lighter aluminum alloy equivalent and modifying the
component shape and methoding in order to optimize properties or casting quality for the
reduced weight. The analysis was conducted using MAVISFLOW which gave a
visualized of the filling of the mold, a predicted map of possible macro shrinkage defects,
an isochronal freezing map showing the progression of freezing and a map of local
freezing times. P.L. Jain (2003) discussed about to analyse the defect observed and
determined the causes for their occurrence, so as to arrive at appropriate remedial
measures. He also suggested a fishbone diagram to list out any parameters that will
contribute to the defect. It is called cause and effect diagram. Gaumann and
Sholapurwalla (2004) stated that computer simulation reduces the time between the
concept stage and production stage in the product life cycle. They also presented a few
Kolej Universiti Teknologi Tun Hussein Onn, Beg Berkunci 101, 86400 Batu Pahat, Johor Malaysia
case studies for investment casting process. Analysis were performed using the Procast
simulation software, the improper feeding mechanism in the model produced three
regions that were found to have porosity. A new design for the gating layout was
suggested. The software was performed on the new layout and the new result showed a
much better fill pattern without any porosity defects. Casting simulation tools allow the
foundry engineer or the designer to quickly bridge the gap between design and
manufacturing. Optimization or improved efficiency during the manufacturing cycle
leads to substantial time and cost savings. Process simulation also has the capability to
accuracy model the properties of a wide range of casting alloys.
Result and Discussion
The first stage of analysis is to diagnose defects on the part. It is important to
correctly diagnose the defects because incorrect diagnosis may lead to incorrect remedy
of the problem. The diagnosis procedures include the analysis to identify a particular
casting defects based upon the specific shape, appearance, location and dimension.
Computer simulation and inspection methods are two approaches involved in this
research work. In the computer simulation approach, Unigraphics system is used to
develop solid model of the cast part sample and associated product such as gates and
feeders. The molding system consists of six parts joined together with pouring cup,
runners and gates to produce wax model. This wax model was used to develop the mould
of shell with certain thickness to obtain a complete mold.
The 3D geometries of the casting and gating system were all imported from
Streolithography (STL) files and converted to MAGMAsoft software as a solid models.
Then the files used to generate a finite elemet solid mesh using MAGMAsoft
enmeshment. The casting geometry, gating system, inlet, risers and other geometry can
be set prior to enmeshing the geometry. Automatic mesh generation can be defined
according to the complexity of casting in x-direction, y-direction and z-direction. It is
possible the check the mesh generated so that any critical areas are enmeshed as fine as
possible. Setting the simulation parameters is essential. Properties of each geometry, heat
Kolej Universiti Teknologi Tun Hussein Onn, Beg Berkunci 101, 86400 Batu Pahat, Johor Malaysia
transfer condition, casting materials, mold filling condition and solidification condition
must be accurately defined before starting the analysis. The material properties are
obtained from database into which necessary thermo mechanical properties of the
materials are created ahead. A contact surface between alloy and ceramic shell is defined
to ensure that there will be no traction force on the coincident nodes when shrinkage
occurs. The run parameter such pouring time and temperature were defined for
simulation and result calculation. Material properties of steel and ceramic mold were
generated and applied to the model. After the preprocessing, the finite element model was
solved using the software MAGMAsoft which is tailored to casting simulation. After
hour computation, some simulation results could be viewed by animation which enhances
visualization of the result obtained. These result are shown with 5% interval of mould
filling by the molten metal in figure 1
The prediction shows the molten metal flow down from the pour cup straight to
the runner, which located below the pouring source, then fills the mold cavity at the
center of the mold, from the bottom to top through the down feed. The metal then flows
through the upper runner and branch into the side runner at both sides, before filling the
other four cavities. The metal temperature starts to drop due to contact with cooler
surface. By the time the mold is filled, the metal temperature has dropped substantially.
In term of mold filling, the result shows a fairly controlled flow patterns. Due to filling
order, there would be shrink defects in many locations of the parts. The filling order
supplied hot metal to extremely varied locations in the cavity, affecting feeding and heat
transfer rates. The location of the part on the tree greatly affected the size of the defect.
Due to self radiation, those parts in the center columns suffered larger defects as the
surrounding part kept the large bulky head hot which results tendency of defect to arise.
Figure 2 shows the snapshot of the flow computed at 100% filling and the
“muzzle” type region become the last area of metal filled on the part. It can be seen that
the “fin” solidify first compare to the large section intersect on it. They have two quiet
distinct roles; the running system fills the casting while the feeding system feeds the
shrinkage during solidification. Filling normally take seconds whereas feeding take
Kolej Universiti Teknologi Tun Hussein Onn, Beg Berkunci 101, 86400 Batu Pahat, Johor Malaysia
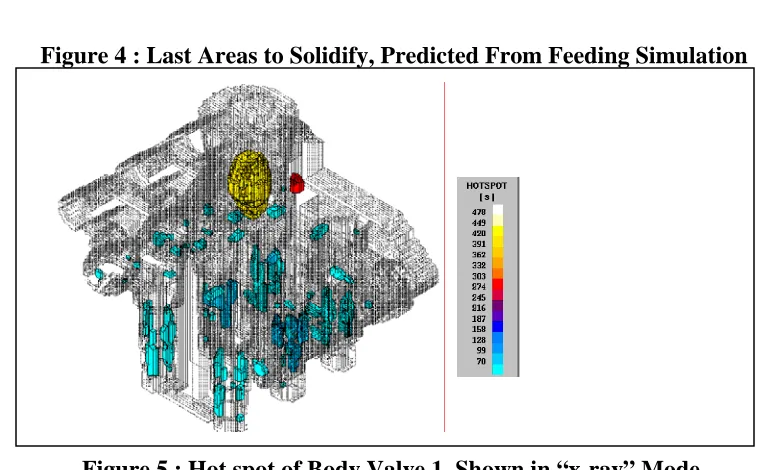
minutes. Figure 3 shows the feeding result which the mold was completely cool down. It
can be predicts that there are no non fill defects during the process. It shows that the
molten metal completely fill the mold cavity. Defects apt to occur at the part where
solidify last. The last area to solidify was circled as shown in figure 4. Figure 5 shows hot
spot of cast part sample which shown in “x-ray” mode. Hot spot in the solidification
process is the cause of casting defects in cast part sample. The hot spot is created at the
point of change section. Commonly local thermal centre or hot spot taking place at
intersection or corner, unless design or casting techniques are used to suppress its
influence. The result is that a shrinkage defect forms in the pocket of liquid which
remains trapped here at a late stage of freezing. One of the problems observed in this case
was shrink porosity in solidification in figure 6, the improper feeding mechanism in the
model produced region that were found to have porosity. The blue regions, which circled
became the last areas to solidify. Using simulation, the computer prediction shows that
porosity lie at the same area of hot spot at the six parts. Most of the defects located at the
place where abrupt changes of section, especially at the conical chamfer regions.
In the inspection approach, casting defects detected on cast part sample include
the presence of misrun, mold break, sink and metal penetration. Misrun occurs due to
incomplete casting with rounded edges where casting is not completely filled. Mold
break was detect by surplus metal following contour of crack in shell mold. Sink occurs
during solidification of molten metal. A metal penetration defect can be seen as excess
metal material formed in a certain surface region of the part. Nevertheless, it should be
noted that surface defects will not contribute to affect the function of cast part sample.
The defects may appear as small crack or hole(s) which cannot traced visually and
become the root cause of leakage.
Red dye penetrant test was helps to identify small surface cracks in castings, the
surface of the casting is treated with a red dye solution base with low viscosity solvent.
The developer agent was sprayed into the part and acts as a blotter to assist the natural
seepage of the penetrant out of surface openings and spread it at the edges to enhance the
penetrant indicator. The location of defects can detected by the presence of red dye
Kolej Universiti Teknologi Tun Hussein Onn, Beg Berkunci 101, 86400 Batu Pahat, Johor Malaysia
regions. It was found that there is no red indicator could be seen on the surface. The
inspection gives a good result where there is no crack or small holes detected at the
surface of the part. Although this method shows the finest surface defects in magnified
form, the interior defects, however could not be revealed as the penetrant cannot reach
that deep. The major limitation of dye penetrant inspection is can detect only
imperfections at the surface. Radiography is suited to detect internal flaws.
Electromagnetic waves called x-ray used as inspection and the image of a defect appears
as a dark shadow on radiographic film. The radiography also present the occurrence of
shrinkage contraction near the porosity which has potential to produce internal crack.
To verify the accuracy of the simulation model, the computer prediction model is
compared with the experimental results. It shows that there is excellent agreement
between computer prediction model and the actual defect on the casting part. From the
simulation, potential porosity locations were identified at the edge of conical chamfer
especially as the diameter changes consecutively along the cast part. The result from
simulation was proven by Nondestructive (NDT) analysis as the defects occur at the same
predicted locations and appears as shrinkage porosity. It is characteristic of a shrink to
appear at heavier sections at change of sections or at hot spots.
Conclusion
To verify the accuracy of the simulation model, the computer predictions are
compared with the experimental result. It shows that there is excellent agreement
between computer predicted and the actual defect on the casting part. From the
simulation result, potential porosity locations were identified at the edge of conical
chamfer, especially if there is diameter changing along the casting part. It was proved by
Nondestructive analysis that the defects occur at the same predicted locations and
presence as shrinkage porosity.
Acknowledgements
The author would like to thank MT-Solution Provider Sdn. Bhd., SIRIM Berhad and MMI Sdn.Bhd for their help and support in the preparation of this paper. Special thanks go to Mr Fahmi Mat Sari from MMI
Kolej Universiti Teknologi Tun Hussein Onn, Beg Berkunci 101, 86400 Batu Pahat, Johor Malaysia
Precision, Tuan Haji Mohd Akhir Yeop Kamarudin from SIRIM Berhad, Dr. Hasbullah Idris and Mr Nazri from Malaysia University of Technology for their useful information and advice. The financial support received from the fundamental research (VOT 0132), Center of Consultancy, Research & Continuous Education, Kolej Universiti Teknologi Tun Hussein Onn is gratefully acknowledged.
References
Gaumann, M. and Sholapurwalla, A. 2004. Investment Cating Simulation. UES software Inc, Calcom SA, Lausanne, Switchland
Jain, P. L. 2003. Principles of Foundry Technology. Tata Mc-Graw Hill, New Delhi
Chijiwa, K 2000. Practical Technology of Castings. Vol 1. Japan International Coorperation Agency, Japan
Timothy, L. D. and Frye, H. F. 1999. Characterization and Correction of Casting Defects. Tech Form, Advance Casting Technology, L.L. C
Kolej Universiti Teknologi Tun Hussein Onn, Beg Berkunci 101, 86400 Batu Pahat, Johor Malaysia
Kolej Universiti Teknologi Tun Hussein Onn, Beg Berkunci 101, 86400 Batu Pahat, Johor Malaysia
5 % 10 % 15 %
30 % 40 %
20 %
50 % 60 % 70 %
[image:8.612.98.521.67.519.2]80 % 90 % 100 %
Figure 1 : Mould -filling Sequences from 5 % of Pouring Until 100 % Complete filling
Figure 2 : Temperature Contour of Material Figure 3 : Complete Feeding Process at the End of Filling
Figure 4 : Last Areas to Solidify, Predicted From Feeding Simulation
Fin
Figure 5 : Hot spot of Body Valve 1, Shown in “x-ray” Mode.
Kolej Universiti Teknologi Tun Hussein Onn, Beg Berkunci 101, 86400 Batu Pahat, Johor Malaysia
[image:9.612.109.491.461.696.2]Figure 6 : Prediction of Porosity location
Kolej Universiti Teknologi Tun Hussein Onn, Beg Berkunci 101, 86400 Batu Pahat, Johor Malaysia