1
RELATIONSHIP BETWEEN QUALITY OF WORK LIFE (QWL) AND JOB SATISFACTION: A CASE STUDY OF ENTERPRISE “XYZ” IN MALACCA
Prof. Dr. Ahmad Othman1 & Mok Cheak Lieng2 1Department of Technology Management,
Faculty of Manufacturing Engineering and Technology Management Universiti Malaysia Pahang, Kuantan, Pahang, MALAYSIA
2Graduate of the Faculty of Technology Management Universiti Tun Hussein Onn Malaysia, Johor, MALAYSIA
Abstract
The purpose of this paper is to discuss the relationship between Quality of Work Life (QWL) and Job Satisfaction. Specifically, the paper tries to identify the level of QWL programmes implemented and the level of job satisfaction and the relationship between the two variables at the enterprise XYZ in Malacca. The samples of this research consisted of 80 employees from the total population of 125. The questionnaire instrument was used consisting of 35 items for QWL programme and 72 items for job satisfaction. The variables of QWL programme were based on the eight dimensions suggested by Walton (1974) and four dimensions suggested by Lewis (2001). The level of job satisfaction was measured based on the five Job Description Index (JDI) dimensions suggested by Smith et al. (1969) which are work, pays, promotion, supervisor and co-worker. The response rate was 91.25 per cent. The result indicated that 54.8 per cent of respondents saw the QWL programme as good and the level of job satisfaction as moderate. Spearman correlation analysis was used to test the relationship between the two variables. Overall, there was a significant relationship between QWL programme and job satisfaction with the value of rs=0.754, at the significant level of =0.01.
Keywords: Quality of Work Life, Job Satisfaction
INTRODUCTION
The success of any organization is highly dependent on how it attracts, recruits, motivates, and retains its workforce. In the search for improved productivity, manager and executives alike are discovering the important contribution of Quality of Work Life (QWL). The evolution of QWL began in late 1960s where, during this time the focus was on the quality of the relationship between the worker and the working environment. However, QWL as a discipline began in 1972 when it was first introduced in an international conference at Columbia University’s Arden House (Davis and Cherns, 1975). According to Davis and Newstrom (1985), QWL was referred to as an environment that make workers at ease or otherwise. Thompson (1983) explains that QWL programme could suggest the actions that an organisation should take in order to achieve a level that emphasising teamwork, knowledge, and skills of its workers (Wyatt and Wah, 2001).
QWL is a set of principles which holds that people are the most important resource in the organisation as they are trustworthy, responsible and capable of making valuable contribution and they should be treated with dignity and respect (Straw and Heckscher, 1984). QWL entails the design of work systems that enhance the working life experiences of organizational members, thereby improving commitment to and motivation for achieving organizational goals. According to J. LIoyd Suttle, quality of work life is the degree to which members of a work organization are able to satisfy important personal needs through their experiences in the organization. More specifically, QWL may be set into operation in terms of employees perceptions of their physical and psychological well-being at work.
1 Professor, Department of Technology Management, Universiti Malaysia Pahang, Kuantan
2
Walton (1974) has outlined eight variables of QWL programme, i.e., fair compensation, safe and healthy working condition, opportunity for using and developing human capacity, opportunity for continued growth and security, social integration in the work organisation, employees right, the effect of job demand on personal lives, and social relevance of work life. Lewis (2001) has added four dimensions, i.e., co-worker and supervisor support, teamwork and communication, characteristic of organisation and overall impressions of the organisation.
In assessing whether the QWL programme is successful or failure depend to a great extent on job satisfaction of workers. In fact, many argue that job satisfaction can influence commitment, performance and productivity of workers. Many organisations concern about job satisfaction among workers because of its direct impact on individual productivity besides reducing absenteeism, mistakes, and turnover (Spector, 1985). Bruce and Blackburn (1992) argue that workers who are satisfied with their works should possess high internal motivation towards performing high quality works. Smith, Kendal and Hulin (1969) define job satisfaction as "the feelings a worker has about his job." They distinguished several dimensions of job satisfaction which include: the type of work, wages, opportunities for promotion, superior's supervision, and co-workers at workplace.
In summary, this study hopefully contributes to the literature on quality of work life (QWL) by testing relationship between QWL and job satisfaction among workers of XYZ Enterprise in Malacca.
METHODOLOGY
This study employed the survey method to collect data on the dependent variable, that is, perception of enterprise XYZ employees toward job satisfaction and on the independent variable, that is perception of employees towards quality of work life. See Diagram 1. The population of this study comprised of 80 employees from the lower and middle management levels. Since this study is not a replication of any previous studies, the questionnaire was developed through literature review and a mix and match approach was adopted whenever necessary to suit the local context. The questionnaire was pre-tested on 10 respondents giving the overall alpha of 0.731, thus meeting Cronbach’s recommendation of > 0.6 as the acceptable reliability level. The final questionnaire had a total of 35 items measuring twelve constructs as follows: (i) fair compensation; (ii) safe and healthy working condition; (iii) opportunity for using and developing human capacity; (iv) opportunity for continued growth and security; (v) social integration in the work organisation; (vi) employees right; (vii) the effect of job demand on personal lives; (viii) social relevance of work life; (ix) co-worker and supervisor support; (x) teamwork and communication; (xi) characteristic of organisation; and (xii) overall impressions of the organisation. The quantitative data collected was subjected to various statistical analyses including correlation analysis.
Independent variables Dependent Variables
3 RESULTS
Descriptive Analysis of Demographic Profile
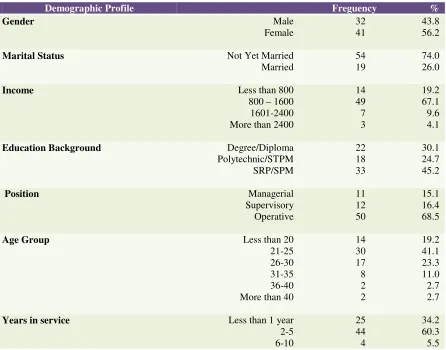
[image:3.595.83.529.179.529.2]The demographic data of 73 staff of XYZ Enterprise who participated in the study are summarised in Table 1.
Table 1: Demographic Profile
Demographic Profile Freguency %
Gender Male
Female 32 41 43.8 56.2
Marital Status Not Yet Married
Married 54 19 74.0 26.0
Income Less than 800
800 – 1600 1601-2400 More than 2400
14 49 7 3 19.2 67.1 9.6 4.1
Education Background Degree/Diploma
Polytechnic/STPM SRP/SPM 22 18 33 30.1 24.7 45.2
Position Managerial
Supervisory Operative 11 12 50 15.1 16.4 68.5
Age Group Less than 20
21-25 26-30 31-35 36-40 More than 40
14 30 17 8 2 2 19.2 41.1 23.3 11.0 2.7 2.7
Years in service Less than 1 year
2-5 6-10 25 44 4 34.2 60.3 5.5
Of the respondents, 43.8 per cent were male and 56.2 per cent were female. The majority of staff were at operative level (68.5%), followed by supervisory level (16.4%) and managerial level (15.1%). The majority of the respondents were aged 21-25 years (41.1%), followed by 26-30 years (23.3%), < 20 years (19.2%), 31-35 years (11%) 36-40 years (2.7%) and > 40 years (2.7%). The majority was not yet married (74%) compared with married (26%). The majority has served the company between 2-5 years (60.3%), followed by < 1 year (34.2%) and between 6-10 years (5.5%). The majority of respondents earned between RM800-1600 (67.1%), < RM800 (19.2%), RM1601-2400 (9.6%) and > RMRM1601-2400 (4.1%). The majority has SRP/SPM certificate qualification (45.2%), diploma and first degree qualification (30.1%), and STPM/politeknik certificate qualification (24.7%).
Analysis of relationship between QWL and job satisfaction
4
JDI dimensions are shown in Table 2 and Table 3. Summary of the relationship between QWL and JDI is shown in Table 4.
Table 2: Relationship Between QWL and Job Satisfaction
Overall Job Satisfaction
QWL programme 0.754** (0.000 (sig))
[image:4.595.81.495.232.411.2]** significant at alpha level =0.01
Table 3: Relationship Between QWL Dimensions and Job Satisfaction
QWL Dimensions Correlation with Job
Satisfaction
1. Fair compensation 0.729**
2. Safe and healthy working condition 0.398**
3. Opportunity for using and developing human capacity 0.690**
4. Opportunity for continued growth and security 0.675**
5. Social integration in the work organisation 0.372**
6. Employees right 0.714**
7. The effect of job demand on personal lives 0.670**
8. Social relevance of work life -0.301**
9. Co-worker and supervisor support 0.240*
10. Teamwork and communication 0.439**
11. Characteristic of organisation -0.115
12. Overall impressions of the organisation 0.502**
[image:4.595.79.552.455.620.2]** Significant at alpha level = 0.01 *Significant at alpha level = 0.05
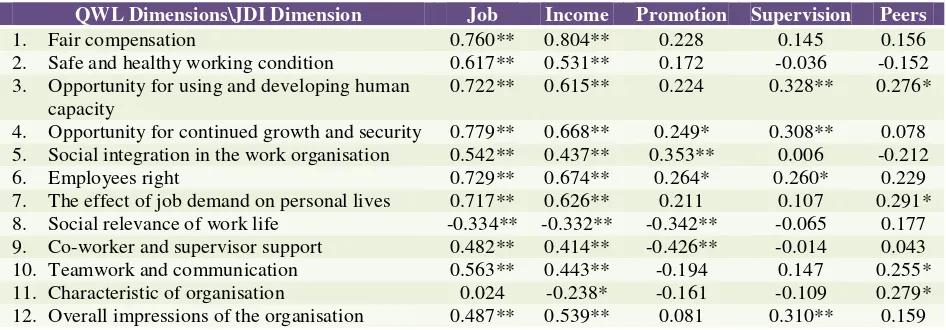
Table 4: Relationship Between QWL Dimensions and JDI Dimensions
QWL Dimensions\JDI Dimension Job Income Promotion Supervision Peers
1. Fair compensation 0.760** 0.804** 0.228 0.145 0.156
2. Safe and healthy working condition 0.617** 0.531** 0.172 -0.036 -0.152
3. Opportunity for using and developing human
capacity 0.722** 0.615** 0.224 0.328** 0.276*
4. Opportunity for continued growth and security 0.779** 0.668** 0.249* 0.308** 0.078 5. Social integration in the work organisation 0.542** 0.437** 0.353** 0.006 -0.212
6. Employees right 0.729** 0.674** 0.264* 0.260* 0.229
7. The effect of job demand on personal lives 0.717** 0.626** 0.211 0.107 0.291*
8. Social relevance of work life -0.334** -0.332** -0.342** -0.065 0.177
9. Co-worker and supervisor support 0.482** 0.414** -0.426** -0.014 0.043
10. Teamwork and communication 0.563** 0.443** -0.194 0.147 0.255*
11. Characteristic of organisation 0.024 -0.238* -0.161 -0.109 0.279*
12. Overall impressions of the organisation 0.487** 0.539** 0.081 0.310** 0.159
** Significant at alpha level = 0.01 *Significant at alpha level = 0.05
Table 5: Summary of Relationships Between QWL Dimensions and JDI Dimensions
QWL Dimensions\JDI Dimension Job Income Promotion Supervision Peers
1. Fair compensation X X
2. Safe and healthy working condition X X
3. Opportunity for using and developing human
capacity X X X X
4. Opportunity for continued growth and security X X X X
5
6. Employees right X X X X
7. The effect of job demand on personal lives X X X
8. Social relevance of work life X X X
9. Co-worker and supervisor support X X X
10. Teamwork and communication X X X
11. Characteristic of organisation X X
12. Overall impressions of the organisation X X X
DISCUSSIONS
The aim of this study was to determine relationship between the twelve dimensions of QWL and job satisfaction, that is fair compensation, safe and healthy working condition, opportunity for using and developing human capacity, opportunity for continued growth and security, social integration in the work organisation, employees right, the effect of job demand on personal lives, social relevance of work life., co-worker and supervisor support, teamwork and communication, characteristic of organisation and overall impressions of the organisation. Having measured the twelve dimensions in the present study has allowed us to better understand the relationship between overall QWL and job satisfaction.
The results show positive relationship between job satisfaction and eleven dimensions of QWL, except characteristic of organisation. Examining closely, it is found that fair compensation is the highest coefficient correlation (0.729), followed by employee right (0.714), opportunity for using and developing human capacity (0.690), opportunity for continued growth and security (0.675), the effect of job demand on personal lives (0.670), overall impression of the organisation (0.502), teamwork and communication (0.439), safe and healthy working condition (0.398), and the rest.
Based on the results of the study, the relationship between QWL dimensions and job satisfaction reveal some implication to managerial practices. In dealing with staff especially female since this group is higher than male, the organisation’s top management and HR department should review its compensation policy so that a fair compensation is in place including periodical salary revision and pay that is commensurate with responsibilities. Also, the company should review its policy on employees’ right. Among others, the management should be open and willing to listen to employees’ views, exercise the right to equitable treatment in all matters including the employees’ compensation scheme, reward and job security, and follow “rule of law” and not “rule of man”. Besides the two mentioned above, the third strongest relationship is the opportunity for using and developing human resource capacity. The management should review its policy on the opportunity for using and developing human resource capacity. Among others, the management should allow freedom to do work effectively among employees, encourage the use of available skills and knowledge in running the jobs, encourage information channel through two-way communication, review the job design for effective job implementation, and encourage employees to plan and implement their daily activities.
REFERENCES
Bruce, W. and Blackburn, J.W. (1992). Balancing job satisfaction and performance: A guide for human resource professionals. Quorum Books.
Davis, L. and Cherns, A. (1975). “The Quality of Work Life: Participative Management as A Basis for Improved Quality of Jobs”. The Journal of Applied Behavioural Science.
Davis, K. and Newstrom, J.W. (1988). Human Behavour at Work..New York: McGrawhill.
Lewis, D., Brazil, K., Krueger, P., Lohfeld, L., and Tjam, E. (2001). Extrinsic and .intrinsic determinants of Quality Work Life. Ontario: Research Scientist
6
Spector, P.E., (1985). “Behavior in organisations as a function of employee’s locus of control”.
Psychological Bulletin. No. 91. pp.482-497. .
Walton, R.E. (1974). “Work innovation at Topeka: After six years”. Journal of Applied Behavioural
Science. 13. 422-433.