5
II
February 2017
Technology (IJRASET)
©IJRASET: All Rights are Reserved
586
Study on Single Step Method for Synthesis of Nano
Fluids
Kiran Kumar
Abstract: This project primarily focuses and uses one-step chemical reduction method for synthesizing copper nanofluids by
reducing copper sulfate by sodium hypophosphite using microwave irradiation. Thermal conductivity of the product obtained is measured and the variation of thermal conductivity with pH and concentration of precursor is studied. Stability of the dispersion formed is studied by measuring zeta potential at different pH values. One-step method for synthesizing nanofluids has been used to produce nickel nanofluids and properties of the product formed were studied by transmission electron microscopy and x-ray diffraction techniques. High energy ball milling was used to produce copper nanoparticles to be used in the two step method for synthesizing copper nanofluids. The effect of milling time on the size of the crystallites formed was studied.
I.INTRODUCTION
In the development of energy-efficient heat transfer fluids, the thermal conductivity of the heat transfer fluids plays a vital role. Despite considerable previous research and development efforts on heat transfer enhancement, major improvements in cooling capabilities have been constrained because traditional heat transfer fluids used in today’s thermal management systems, such as water, oils, and ethylene glycol, have inherently poor thermal conductivities, orders-of-magnitude smaller than those of most solids. Due to increasing global competition, a number of industries have a strong need to develop advanced heat transfer fluids with significantly higher thermal conductivities than are presently available. It is well known that at room temperature, metals in solid form have orders-of-magnitude higher thermal conductivities than those of fluids. For example, the thermal conductivity of copper at room temperature is about 700 times greater than that of water and about 3000 times greater than that of engine oil. The thermal conductivity of metallic liquids is much greater than that of nonmetallic liquids. Therefore, the thermal conductivities of fluids that contain suspended solid metallic particles could be expected to be significantly higher than those of conventional heat transfer fluids.
Modern nanotechnology can produce metallic or nonmetallic particles of nanometer dimensions. Nanomaterials have unique mechanical, optical, electrical, magnetic, and thermal properties. Nanofluids are engineered by suspending nanoparticles with average sizes below 100 nm in traditional heat transfer fluids such as water, oil, and ethylene glycol. A very small amount of guest nanoparticles, when dispersed uniformly and suspended stably in host fluids, can provide dramatic improvements in the thermal properties of host fluids. Nanofluids (nanoparticle fluid suspensions) is the term coined by Choi (1995) to describe this new class of nanotechnology-based heat transfer fluids that exhibit thermal properties superior to those of their host fluids or conventional particle fluid suspensions. Nanofluid technology, a new interdisciplinary field of great importance where nanoscience, nanotechnology, and thermal engineering meet, has developed largely over the past decade. The goal of nanofluids is to achieve the highest possible thermal properties at the smallest possible concentrations (preferably<1% by volume) by uniform dispersion and stable suspension of nanoparticles (preferably<10 nm) in host fluids. Maxwell’s concept is old, but what is new and innovative in the concept of nanofluids is the idea that particle size is of primary importance .
A. Conventional Soild–Liquid Suspensions and Their Limitations
The century-old technique used to increase heat transfer rates is to disperse millimeter- or micrometer-sized particles in heat transfer fluids. The major problem with suspensions containing millimeter- or micrometer-sized particles is the rapid settling of these particles. If the fluid is kept circulating to prevent particle settling, millimeter- or micrometer-sized particles would wear out pipes, pumps, and bearings. Furthermore, such particles are not applicable to microsystems because they can clog microchannels. These conventional solid fluid suspensions are not practical because they require the addition of a large number of particles (usually,>10 vol%), resulting in significantly greater pressure drop and pumping power.
B. Potential applications
Technology (IJRASET)
©IJRASET: All Rights are Reserved
587
heat loads, heat fluxes, and localized hot spots at the chip and package levels. These thermal problems are also found in power electronics or optoelectronic devices. Air cooling is the most basic method for cooling electronic systems. However, heat fluxes over 100 W/cm2 in electronic devices and systems will necessitate the use of liquid cooling.
In the transportation industry, cooling is a crucial issue because the trend toward higher engine power and exhaust-gas regulation or hybrid vehicles inevitably leads to larger radiators and increased frontal areas, resulting in additional aerodynamic drag and increased fuel consumption. A pressing need for cooling also exists in ultrahigh–heat-flux optical devices with brighter beams, such as high-powered x-rays.
II.EXPERIMENTALWORK
A. Synthesis of Copper nanofluid
In the method proposed by Zhu et al (2004), Copper nanoparticles are produced by reducing copper sulfate with sodium hypophosphite. In a typical procedure, 25ml of ethylene glycol solution (0.1M) of copper sulfate penta hydrate is thoroughly mixed with 5ml of ethylene glycol solution (0.01M) of polyvinyl pyrrolidone (PVP-K30), using a magnetic stirrer for 30 min. Then 25ml of ethylene glycol solution of sodium hypophosphite (0.25M) is added and stirred for another 15min. The mixture is subjected to microwave heating till the reaction completes and the color of the mixture changes from blue to dark red. The obtained product is the copper-in- ethylene glycol nanofluid.
Chernogorenko V B and Tasybaeva Sh T proposed a mechanism for the reduction of copper sulfate with sodium hypophosphite. The metal ions are reduced by atomic hydrogen evolving from the reaction of hypophosphite with water.
H2PO2 - + H2O H2PO3 - + 2H
In this case, the total reduction process may be written as:
M2+ + H2PO2- + H2O M0 + H2PO3- + 2H+
However, it has been experimentally established that the reduction of M+2 cation corresponds to oxidation of two hypophosphite anions according to the equation :
M2+ + 2H2PO- 2 + 2H O M0 + 2H PO- + 2H+ + H223
Color changes during the course of the reaction indicate the formation of different complexes between copper sulfate and hypophosphite. As the copper sulfate solution is introduced into the hypophosphite solution, the blue copper sulfate solution becomes colorless (stage I), then turns green (stage II), and finally turns henna (stage III). The intermediate steps of the reduction mechanism for the synthesis are described as
follows. Stage I—formation of colorless copper(II) complex- + 2H+
B. Caracterization of the product
The product formed after the reaction is to be characterized and tested for the new phase formed. X-Ray Diffraction is used to verify whether the particles formed are of copper or not. High Resolution Transmission Electron Microscopy is used to find the size of the particles formed. Experimental details of the procedures of characterization are discussed below.
C. XRD Analysis
The nanofluid obtained is diluted with absolute ethanol, followed by centrifugation for 60 min at 4000 rpm, and then washed
withethylene glycol and then vacuum dried for 2hr at 800C. The as-prepared powder samples are placed in the groove of the sample holder with the help of a glass slide. Then the sample holder is placed in an X-Ray Diffractometer (Philips PW 1710) inorder to measure the diffraction pattern from its flattened surface. Diffraction pattern is obtained by projecting monochromatic
Co-Kα radiation of wavelength 1.79 A0, filtered through a Fe-filter. Diffraction pattern consists of some peaks at particular points, characteristic of a material. So from the positions of peaks obtained, thephase formed is found out.
D. Tem analysis
Technology (IJRASET)
©IJRASET: All Rights are Reserved
588
of in- situ study of electron diffraction from selected area from the sample. Also, an elemental analysis was done to obtain the compositionofthesample
E. Thermal conductivity of Copper nanofluid:
The thermal properties of the nanofluids are to be studied as they are supposed to be applicable as heat transfer fluids as a replacement for conventional fluids. Thermal conductivity is one of the important characteristics of heat transfer fluids.
F. Variation of thermal conductivity with
Copper nanofluid is prepared using 0.1M copper sulfate solution. The pH of the product is measured and the thermal conductivity values are measured by KD2 Thermal Properties Analyser, which employs transient hot wire-probe method, until consistent readings are observed. Then pH is varied by adding a little 3N NaOH solution to it and again thermal conductivity is measured. Thermal conductivity is measured at other pH values also by similarly varying the pH. The same procedure is carried out for the nanofluids obtained with 0.2M copper sulfate solution.
The variation of thermal conductivity with the change in the concentration of the precursor is also studied.
G. Thermal conductivity of reaction mixture and supernatant
After mixing the reactants – copper sulfate, sodium hypophosphite – and a small amount of dispersing agent, thermal conductivity is measured before microwave heating. Nanofluid is obtained by carrying out a reaction and after the product is formed, components other than copper are not removed. Any change in thermal conductivity can be due to the presence of these reaction components. To find out the effect of these materials present in the nanofluid formed, the nanofluid formed is centrifuged at 8000 rpm for 1hr to get the supernatant. Thermal conductivity of this supernatant is measured. Also, the pH of this supernatant is varied and thermal conductivity is measured as a function of pH.
H. Zeta Potential measurements
Due to dipolar characteristics and ionic attributes, the colloidal particles (including nanoparticles) suspended in solvents are charged electrically. For example, the surface groups of a colloid may be ionized. This leads to a net electric charge at the surface that causes the accumulation of opposite charges (counterions) around them. This in turn results in an electrical double layer. The ion (with positive or negative charge) and a set of counterions form a fixed part of the double layer. The diffuse or mobile part of the double layer consists of ions of different polarities, which extend into the liquid phase. This double layer may also be considered to have two parts, an inner region that includes ions bound relatively strongly to the surface, and a diffuse region in which the ion distribution is determined by a balance of electrostatic forces and random thermal motion. When an electric field is applied, the particles are attracted to the electrodes, depending on their polarity. The potential at which the fixed part of the double layer along with a part of the mobile layer move toward an electrode is called the Zeta or electrokinetic potential . It can also be defined as the potential at the shear plane of the particle when it moves in the medium.
Copper nanofluid is synthesized and samples with different pH values are prepared by using NaOH solution and each of them is analysed for zeta potential values using Zeta Sizer – Nano Series (Malvern Instruments). Samples were used as obtained and not
diluted.
I. Two-step method for Copper nanofluid
Technology (IJRASET)
©IJRASET: All Rights are Reserved
589
dry up where
β is the width of the peak at half maximum intensity of a specific phase (h k l) in radians K is a constant that varies with the method of taking the breadth (0.89<K<1)
λ is the wavelength of incident x-rays
θ is the center angle of the peak L is the crystallite length
Grain size is calculated for each sample using the width of peak at half the maximum intensity. This gives the effect of milling time on the particle size formed. The final product formed was dispersed in ethylene glycol and ultrasonicated intensely for 1 hr to produce 0.1 vol % copper in ethylene glycol nanofluid.
III. SYNTHESIS OF NICKEL NANOFLUID BY ONE-STEP METHOD
Thermodynamic analysis using the electrochemical potentials shows that the change in
Gibbs free energy (ΔG) for the net reduction reaction of nickel sulfate using sodium hypophosphite is negative i.e., the reduction of nickel sulfate using sodium hypophosphite is feasible. This point is used as the basis for extending the one step chemical reduction method to produce nickel nanofluid. The same procedure as used for the synthesis of copper nanofluid is used for the synthesis of nickel nanofluid also. 25ml of ethylene glycol solution (0.1M) of nickel sulfate heptahydrate is thoroughly mixed
with 5ml of ethylene glycol solution (0.01M) of polyvinyl pyrrolidone (PVP-K30), using a magnetic stirrer for 30 min. Then 25ml of ethylene glycol solution of sodium hypophosphite (0.25M) is added and stirred for another 15min. The mixture is subjected to microwave heating till the reaction completes and the color of the mixture changes from green to black. The obtained product is nickel-in- ethylene glycol nanofluid.
The product formed is to be characterized by performing XRD and TEM analysis. The samples were prepared in the same procedure as was used to prepare samples from copper nanofluid. Diffraction pattern is obtained by projecting monochromatic Co-Kα
radiation of wavelength 1.79 A0, filtered through a Fe-filter.
IV. RESULTS & DISCUSSION
A. Copper nanofluid - Characterization
The diffraction patterns for all the samples prepared from copper nanofluid have the peaks in intensity at 2θ values of 50.80, 59.350,
88.850 with the peak at 50.80 being the highest. The inter-planar spacings (d-spacings) corresponding to these θ-values are 2.086A0,
1.809 A0, 1.2786 A0, calculated using Bragg’s law (λ = 2d Sinθ) with λ = 1.79
A0for Co Kα radiation.
From the JCPDS file number 04-836, the peaks occur at 430, 500, 740for pure copper, when the radiation used is Cu Kα. The d
-spacings corresponding to these θ-values are 2.088A0, 1.808 A0 , 1.278 A0, calculated using Bragg’s law (λ = 2d Sinθ) with λ =
1.5405
A0 for Cu Kα radiation.
Technology (IJRASET)
©IJRASET: All Rights are Reserved
590
01.rd
Fig 4.1.1 (a)
Fig 4.1.1: X-Ray Diffractograms of samples prepared using 0.1M and 0.2M CuSO4 solutions, corresponding to (a) and (b) respectively.
Fig 4.1.2
Fig 4.1.2.(b) Fig 4.1.2.(c)
Fig 4.1.2: TEM micrographs of samples prepared from 0.1M, 0.2M, 0.3M CuSO4 corresponding to (a),(b),(c) respectively
Technology (IJRASET)
©IJRASET: All Rights are Reserved
591
nucleation and restricts the straightforward growth of newly born Cu. The size of the particles formed increased along with the increase in the concentration of precursor. This is due to the fact that, the nuclei formed have enough time to grow while the rest of the reactant is being consumed. Size of most of the particles is less than 20nm and some others are in the range of 20-50 nm. Elemental analysis was also performed along with transmission electron microscopy. The results show that all the three samples have only copper along with a small amount of carbon. Carbon actually is from the carbon-coated ultra-thin grid that is used to hold the sample in TEM.
B. Thermal conductivity enhancement in copper nanofluid
The thermal conductivity of the nanofluids are higher than that of the base fluid, ethylene glycol (k=0.253 Wm-1 oC-1 ). It was
observed that as the concentration of the precursor is increased, the effective thermal conductivity of the suspension also increased. The enhancements were as high as 5.14 %, 12.24% and 15.23% for the nanofluids prepared from 0.1M, 0.2M, 0.3M CuSO4 solutions respectively.
C. Effect of pH on thermal conductivity
Thermal conductivity of the nanofluids prepared from 0.1M and 0.2M CuSO4 were studied by varying the pH of the suspensions. It was observed that as the pH of the suspension increased, the effective thermal conductivity also increased in both the cases. This is because of the fact that, varying pH has a direct effect on the dispersion quality of a suspension. Better the quality of dispersion, higher is the effective thermal conductivity.
D. Increase in thermal conductivity was as high as 16%, at a pH of 13, for the nanofluid prepared from 0.1M CuSO4 solution and for that prepared from 0.2M solution, it was 19.57% at a pH of 11.3.
E. Thermal conductivity of reaction mixture and supernatant
The thermal conductivity of the reaction mixture before microwave heating was measured to be 0.2553 W/m-0C. Thus, the thermal
conductivity enhancement with respect to the base fluid recorded was 0.2%, which is a negligible quantity.
Supernatant obtained after centrifuging the nanofluid has no solid particles present in it. The thermal conductivity of this supernatant was measured to be 0.255 W/m-0C. Thus, the thermal conductivity enhancement with respect to the base fluid recorded was 0.2%,
which is also a negligible quantity. With the nanoparticles present, the nanofluid recorded an enhancement of 5.14%, which is a significant figure. Thus the effect of the reaction components present in the nanofluid can be neglected and the enhancement in thermal conductivity must be due to the presence of copper nanoparticles only. Also, when the pH of supernatant was varied, no change was observed in the value of thermal conductivity. Thus the increase in thermal conductivity of the nanofluid with the increase in pH can be said to be due to the effect of OH- ions (added to the nanofluid) on the nanoparticles.
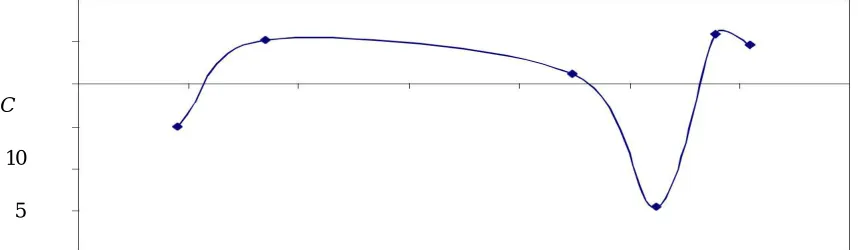
F. Zeta potential measurements
Zeta potential is measured to study the stability of the dispersion formed due to the reaction. The zeta potential values of the samples of different pH values did not follow any particular trend. All the values are not in the desirable range (absolute values are less than 20 mV). This may be because the dispersion formed is highly unstable. Another point that can be a reason for this abnormality may be high particle density that the samples used for measurement had.
C
10
[image:7.612.41.470.585.710.2]5
Technology (IJRASET)
©IJRASET: All Rights are Reserved
592
G. Two step method for copper nanofluid
The samples collected after 10 hr, 20 hr, 30 hr and 40 hr of milling are collected and are subjected to X-Ray diffraction analysis. Diffraction pattern is obtained by projecting monochromatic Co-Kα radiation of wavelength 1.79 A0, filtered through a Fe-filter
Peaks obtained were observed to be of pure copper for all the samples and the peak widths are to be used to calculate the grain size of the crystal.
The grain size formed from milling is calculated using Scherrer formula given below: Where
β is the width of the peak at half maximum intensity of a specific phase (h k l) in radians K is a constant that varies with the method of taking the breadth (0.89<K<1)
λ is the wavelength of incident x-rays, θ is the center angle of the peak
Technology (IJRASET)
©IJRASET: All Rights are Reserved
593
[image:9.612.108.489.141.365.2]even decrease the grain size.
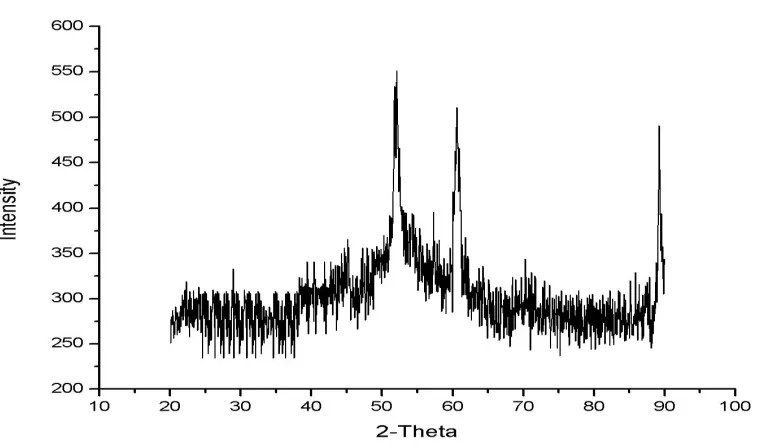
Fig. 4.5.1. XRD pattern of the sample prepared from the product obtained from NiSO4 solution
H. Nickel nanofluid - Characterization
Similar to the XRD patterns of copper nanoparticles, there is a shift in the position of peaks due to change in the radiation. The diffraction patterns of the sample prepared from nickel nanofluid have the peaks in intensity at 2θ values of 52.140, 60.90, 900 with
the peak at 52.140 being the highest. The inter-planar spacings (d-spacings) corresponding to these θ-values are 2.036A0, 1.76 A0,
1.24 A0, calculated using Bragg’s law (λ = 2d Sinθ) with λ = 1.79 A0for Co Kα radiation.
For pure face-centered nickel, the peaks occur at 44.50, 51.80, 76.40, when the radiation used is Cu Kα. The d-spacings
corresponding to these θ-values are 2.036A0, 1.765 A0, 1.247 A0, calculated using Bragg’s law (λ = 2d Sinθ) with λ = 1.5405 A0 for
Cu Kα radiation. Hence, it can be confirmed that the dispersion formed by the reaction has the nickel particles as the dispersed phase
Fig. 4.5.2. TEM micrographs of product obtained from NiSO4 solution
V. CONCLUSIONS
[image:9.612.71.478.539.695.2]Technology (IJRASET)
©IJRASET: All Rights are Reserved
594
conductivity of nanofluid is higher than that of the base fluid (ethylene glycol in this work). Enhancement in thermal conductivity is due to the presence of nanoparticles and the effect of the presence of other components in the dispersion is negligible. As the concentration of the precursor increases i.e., as the volume fraction of the copper particles increases, the thermal conductivity also increased. Also, as the pH of the nanofluid is increased, the thermal conductivity of the nanofluids increased. Zeta potential, used as a parameter to estimate the stability of the suspension, did not fall in the desirable range. The one-step method used previously for copper nanofluids is extended to nickel nanofluids using the same reducing agent. Two-step method for preparing copper nanofluids was also employed.
VI. FUTURE WORK
The stability of the nanofluids is to be studied more comprehensively.
The effect of the type of dispersing agent (organic/polymer etc) on the properties of the nanofluids is to be studied.
The nanofluid prepared by this one-step method is to be applied to a heat transfer system to find out the enhancement in the heat transfer rates.
VII.ACKNOWLEDGMENT
This project completion gives us immense pleasure .we would like to convey our sincere gratitude to A.Subbarao Professor of ChemicalDepartment . We would also expand our deepest gratitude to all those who has directly and Indirectly guided us in writing this thesis .
REFERENCES
[1] Chopkar.M, Manna.I, S.Kumar, P.K.Bhandari, P.K.Das (2007). Development and Characterisation of Al2Cu and Ag2Al nanoparticle dispersed water and ethylene glycol based nanofluid. Material Science and Engineering B; 139:141-148
[2] C.Suryanarayana (1995). Nanocrystalline materials. International Materials Reviews; 40: 41-6
[3] Dae-Hwang Yoo, K.S.Hong, Ho-Soon Yang (2007). Study of thermal conductivity of nanofluids for the application of heat transfer fluids. Thermochimica Acta; 455: 66-6
[4] Das S K, Nandy Putra, Peter Thiesen, Wilfried Roetzel (2003). Temperature dependence of thermal conductivity enhancement for nanofluids. ASME Journal of Heat Transfer; 125: 567-574
[5] Eastman JA, Choi SUS, Li S, Yu W, Thomson LJ (2001). Anomalously increased effective thermal conductivities of ethylene glycol-based nanofluids containing copper nanoparticles. Applied Physics Letters; 78:718-720H.Gleiter (1989). Nanocrystalline materials. Progress In Material Science; 33: 223-315
[6] Hai-tao Zhu, Yu-sheng Lin, Yan-sheng Yin (2004). A novel one-step chemical method for preparation of copper nanofluids. Journal of Colloid and Interface Science; 277: 100-10
[7] Hai-tao Zhu, Yu-sheng Lin, Yan-sheng Yin (2004). Rapid synthesis of copper nano-particles by sodium hypophosphite reduction in ethylene glycol under microwave irradiation. Journal of Crystal Growth; 270: 722- 72
[8] Hiroshi Akoh, Tsukasaki Y, Yatsuya S, Tasaki A (1978). Magnetic Properties of ferromagnetic ultrafine particles prepared by vacuum evaporation on running oil substrate. Journal of Crystal Growth; 45: 495-50
[9] Kear B H, McCandlish L E (1993). Chemical processing and properties of nanostructured WC-Co nanoparticles. Nanostructured Materials; 3: 19-3 [10] Lee S, Choi SUS, Li.S, Eastman JA (1999). Measuring thermal conductivity of fluids containing oxide nanoparticles. ASME Journal of Heat Transfer;
121:280-289