comment
reviews
reports
deposited research
interactions
information
refereed research
Research
Estimation of genetic distances from human and mouse introns
Jose Castresana
Address: European Molecular Biology Laboratory (EMBL), Biocomputing Unit, Meyerhofstrasse 1, D-69117 Heidelberg, Germany. Current address: Center for Genomic Regulation (CRG), Biocomputing Program, Dr Aiguader 80, 08003 Barcelona, Spain. E-mail: [email protected]
Abstract
Background: Using genetic distances measured from exons, it has been observed that the
mutation rate is not constant along mammalian chromosomes. Exons constitute only 1% of the human genome, however, and thus they cannot provide a complete picture of the mutational variation in the genome.
Results: I calculated genetic distances between 504 human introns and their orthologous mouse counterparts from a set of 63 pairs of human and mouse genes scattered through the genome using a recently developed method that can extract reliably aligned regions from the introns in an objective manner. I found a significant correlation between the genetic distance measured in the conserved intron segments and the synonymous and nonsynonymous distances measured in the corresponding coding exons, indicating that genes with evolving exons tend to have fast-evolving introns, and vice versa.
Conclusions: These results indicate that introns, which extend over almost a quarter of the
human genome, contain useful information for fully understanding the mutational dynamics of human and mouse genomes. This work also supports the idea that there is a mutational force that fluctuates nonrandomly along the genome, and shows for the first time that this force affects the introns and the synonymous and nonsynonymous positions in the exons of the genes simultaneously.
Published: 14 May 2002
GenomeBiology2002, 3(6):research0028.1–0028.7
The electronic version of this article is the complete one and can be found online at http://genomebiology.com/2002/3/6/research/0028 © 2002 Castresana, licensee BioMed Central Ltd
(Print ISSN 1465-6906; Online ISSN 1465-6914)
Received: 3 December 2001 Revised: 1 February 2002 Accepted: 27 March 2002
Background
The variable degree of sequence divergence that occurs in different parts of a gene or in different chromosome loca-tions can help to determine what types of evolutionary mechanisms and mutational forces are responsible for the current organization of the mammalian genome. Compar-isons of large homologous regions sequenced in mouse and human revealed the existence of strikingly different patterns of sequence conservation in different genomic tracts [1]. In addition, the correlation between rates of synonymous sub-stitution (that does not cause amino acid change) and non-synonymous substitution (that causes amino acid change) that has been found in many comparisons of mammalian genes [2-6] has also been explained by the existence of a
regional variation of the mutation rates along the chromo-some: genes located in bands of lower mutation rates would display both low synonymous and nonsynonymous rates, whereas the opposite would be the case for genes located in bands of higher mutation rates. However, it cannot be excluded that an excess of substitutions at adjacent pairs of nucleotides (tandem substitutions [2,7]) or common func-tional constraints (for instance, selection for optimal codons to improve translational accuracy [8,9]) were causing the correlation between synonymous and nonsynonymous rates.
found that the synonymous mutation rates of neighboring genes were more similar than expected by chance [10,11]. Furthermore, it was found, also by examining linked genes, that nonsynonymous rates are regionalized along the chro-mosomes, which could be due to the clustering of function-ally similar genes or, alternatively, could reflect some kind of local variation of selection pressure [12].
The sequence of the complete human genome has revealed that, whereas exons occupy only 1.1% of the genome, introns extend over 24% of its length [13,14]. Therefore the study of introns should be crucial to understanding the genome’s mutational dynamics. In addition, introns are embedded between conserved exons, making it easy to define ortholo-gous elements (unlike the situation in intergenic regions). The measurement of evolutionary rates in introns would allow us to test the prediction that, if a local rate variation exists and expands over large tracts of the genome, it would affect all parts of a gene, and therefore the evolutionary rates estimated from the coding exons should be correlated with the rates measured from the introns in the same gene. In this case, as introns and exons are physically more separated than synonymous and nonsynonymous positions, noninde-pendence of substitutions or common selection constraints would not provide alternative explanations of the variable mutational force. Despite the availability of a large number of orthologous human and mouse genes, introns have not been used to measure genetic distances between human and mouse because of the large divergence between these two species, which makes the handling of noncoding regions especially problematic. Although the study of noncoding regions will be easier when using more closely related species, it is important to know whether we are able to extract information from the human and mouse genome compar-isons, as the data obtained from different pairs of species should be complementary and will help to improve our understanding of the mammalian genome. I recently devel-oped a method to extract reliably aligned positions from divergent alignments and, in addition, showed that many sources of bias contained in the original alignments can be avoided [15]. The application of this method to extract reli-ably aligned positions from intron alignments enables this large part of the genome to be used in analyses of the evolu-tionary forces that have shaped the mammalian genome.
Results
The synonymous-nonsynonymous distance correlation in exons
A group of 63 orthologous mouse and human gene pairs selected from a data set compiled by Jareborg et al. [16] was used. They contained a total of 567 exons and 504 introns. The sets of human and mouse genes covered 441,243 and 424,641 base pairs (bp), respectively. Most of the genes were extracted from database entries containing a single gene -with a major exception where 16 genes, 15 of which were
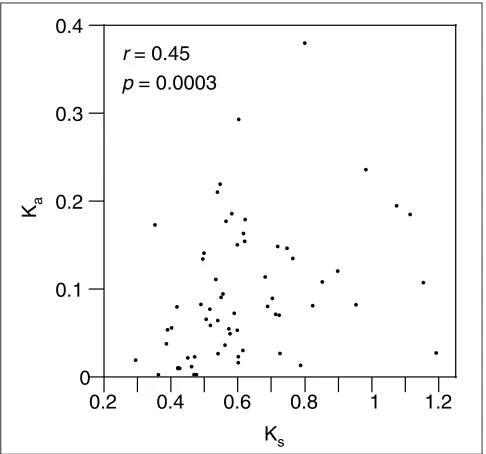
used here, came from the same region. The human sequences for which the chromosome position is reported in the database entry are located on 11 different chromosomes, so the data set contains genes scattered throughout the genome and is therefore a good representation of the mam-malian genome. The average values of the maximum-likeli-hood estimates of the synonymous distance (Ks= 0.622 H0.198 substitutions per site) and the nonsynonymous distance (Ka= 0.092H0.077), for the 63 genes used here are similar to those obtained in previous analyses of human and mouse data sets that contained more genes, although consisting only of exons [10,17]. In addition, the correlation between Ka and Ks observed in other work involving various pairs of mammals [2-6,18,19] is also clearly seen in the present data set (Figure 1). The strength of this correlation is, however, very sensitive to the method used to measure the evolution-ary rates. Here, the correlation is marginally better when rates were estimated by the algorithmic method of Nei-Gojobori (r= 0.4637, p= 0.0001) than when they were esti-mated by the more precise maximum-likelihood methods (r= 0.4455, p= 0.0003 with codon frequencies estimated from the data; r= 0.3882, p= 0.0017 with codon frequen-cies used as free parameters), in agreement with previous work that compared both types of measurements [4].
Distance estimation in intron alignments
[image:2.609.313.556.451.678.2]The alignments of human and mouse introns contain many regions where, even after removing repetitive elements, the divergence is so large that no alignment can be reliable [16];
Figure 1
Correlation of synonymous (Ks) and nonsynonymous (Ka) distances in the concatenated coding exons of 63 human and mouse orthologous genes, measured by maximum likelihood with codon frequencies calculated from the data.
• •
• •
•
• •
• •
•
• •
•
•
•
•
•
•
• •
•
• •
•
• •
•
• • •
•
• • •
•
• •
•
• •
•
• •
•
• •
•
• •
• •
• •
•
• •
•
•
• • •
• •
0
0.1
0.2
0.3
0.4
0.2
0.4
0.6
0.8
1
1.2
K
aK
sr = 0.45
comment reviews reports deposited research interactions information refereed research
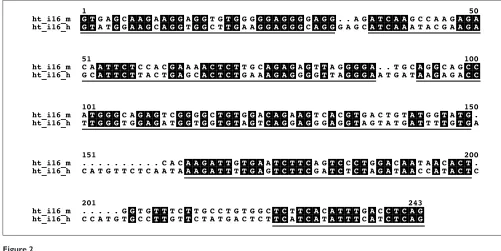
on the other hand, other regions of the same introns show enough identity matches to produce reliable local align-ments. Unlike methods that extract the most conserved seg-ments from this kind of alignseg-ments, and thus have a very high functional constraint, the Gblocks program [15] was devised to extract blocks from alignments that are reliably aligned but with enough variability inside the blocks to extract valuable phylogenetic information. In brief, blocks are selected that do not contain more than a certain number of contiguous nonconserved positions and are surrounded by highly conserved anchoring positions; then, gaps and nonconserved positions adjacent to gaps are also removed [15]. Figure 2 shows a typical alignment of a small intron and the blocks selected by Gblocks. Most of the removed seg-ments come from insertions/deletions like the region between positions 150 and 160 (which in some other introns can be very large, even after having removed interspersed repeats before alignment). In addition, segments of difficult alignment, normally close to a gap and full of nonconserved positions, like the one between positions 206 and 224, are also removed, as the alignment here is not reliable and these regions may be saturated by multiple substitutions that make the measurement of genetic distances unreliable. However, the algorithm allows a high degree of variability in many of the chosen regions, so that strong selection is not completely biasing the distance estimation. The extent and degree of conservation in different introns is very variable, with some of them being very well conserved and chosen by the Gblocks algorithm along their whole length, whereas others are so divergent that only a small percentage of the alignment
length is selected. All blocks are selected by Gblocks accord-ing to a set of predefined parameters that can have different stringencies for different types of analyses [15].
[image:3.609.53.554.462.713.2]To ensure that the alignment procedure was not affecting the results, the Gap alignment program was used with three dif-ferent sets of parameters that had very difdif-ferent intensities of gap insertion. Additionally, two different degrees of strin-gency of block selection in Gblocks were used in the three generated alignments, so I obtained six different sets of moderately conserved intron segments. The largest selected regions in the intron alignments were identical in the six sets although smaller regions were aligned and/or selected dif-ferently. The total length of the six sets was 236,710, 188,439, 237,519, 202,633, 226,838 and 204,475 positions, respectively, for the six conditions listed in Table 1, repre-senting between 62 and 78% of the average total length of the mouse and human introns (without interspersed repeats). All conserved blocks of all introns in every gene were concatenated and the distances (Ki) measured by maximum likelihood using the HKY (Hasegawa, Kishino, Yano) model of evolution. The average of this distance was 0.719, 0.566, 0.609, 0.515, 0.510 and 0.464 substitutions per site, respectively, for the six different conditions. They are in the same range of the average synonymous distances mea-sured from the exons (0.622 substitutions per site), indicat-ing that the conserved regions selected from the introns have a divergence level comparable to the synonymous positions of the exons. It is known that the average substitution rates in synonymous and intronic sites are very similar to each
Figure 2
other in several mammalian comparisons [20,21]. It should also be taken into account that, in the comparison of human and mouse, the distances from the complete introns, if they could be measured, would be higher than the ones calculated here from the conserved parts as a result of the elimination of the most divergent regions.
The intron and exon distance correlation
Interestingly, the genetic distances of the conserved intron segments is significantly correlated with both the synony-mous and nonsynonysynony-mous distances measured from the corresponding exons (Figure 3). This correlation coefficient is similar in strength to the well known correlation between Ks and Ka. Furthermore, this association is significant (p< 0.05) for all the alignment and selection methods used to extract the conserved intron segments, and for the three different methods used to measure Ksand Ka(Table 1). The method used to measure the synonymous and nonsynony-mous distances (maximum likelihood with codon frequen-cies taken from the data or used as free parameters and the Nei-Gojobori method) has almost no effect on the strength of the correlation. However, the alignment and block selec-tion methods have a small effect on the correlaselec-tion coeffi-cient, with the more stringent methods tending to reduce this correlation. This indicates that selection of regions that are too conserved may reduce the signal in the alignment.
A second approach, in which distances were measured from individual introns and exons, was used to analyze the corre-lation of intron and exon evolutionary rates. To produce reliable distance estimates, only pairs of coding exons and adjacent introns with alignments of more than 100 posi-tions were used; in addition, distances were measured from all exon positions (Ke) by maximum likelihood with the HKY model of evolution (the same model used for the introns), that takes all positions into account, instead of a codon-based model where positions are implicitly sub-divided into two classes (and which cannot be automatically applied to exons with interrupted codons). Kehas contribu-tions from both Ksand Kabut, in fact, Kialso probably has
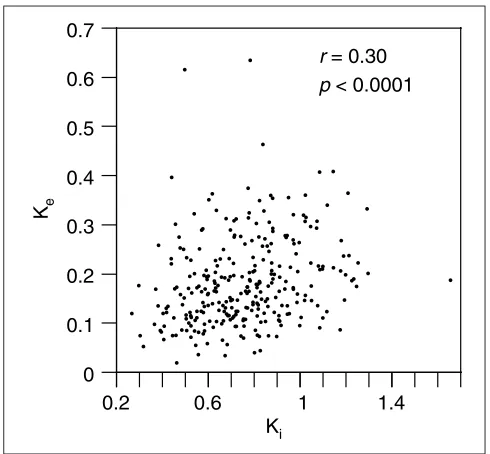
contributions from sites under different selection strengths and therefore both measures are approximations. The com-parison of 289 pairs of exon and upstream intron produced a highly significant correlation (r= 0.3013, p< 0.0001; Figure 4), similar to the correlation obtained for the whole genes. Of the five outliers in the plot, three, with a high Ke, correspond to the C4 complement protein. The elimination of these outliers or the whole of the C4 gene does not affect the strength of the correlation. The correlation calculated for 277 pairs of exons and downstream introns was also highly significant (r = 0.2149, p= 0.0003). Taking into account that some intron alignments are likely to have several positions wrongly aligned, which will only add noise to the correlation, the real correlation coefficient is proba-bly stronger in both the concatenated and the individual exon/intron comparisons.
[image:4.609.313.555.83.491.2]In a previous analysis of pairs of mouse and rat genes, where intron and exon evolutionary rates were also measured, no correlation between both variables was found [22]. In a re-analysis of the same gene pairs [23], this correlation was also not observed. A likely reason for the absence of the intron/exon mutation rate correlation in these studies is the smaller number (41) of genes used. To test this, I generated 100 samples of 41 genes randomly selected from the data set used here, and calculated the correlation of intron and exon distances. This correlation was significant (p< 0.05) in only 54 out of 100 replications (data not shown), indicating that in previous work this correlation was not observed as a result of the smaller data set used.
Figure 3
Correlation of intron distances (Ki) measured by maximum likelihood from the concatenated conserved parts of intron alignments and the synonymous (Ks) and nonsynonymous (Ka) distances in the
corresponding concatenated coding exons of 63 pairs of orthologous human and mouse genes.
• •
• •
•
• •
• •
• •
• •
•
•
•
• •
•
•
• •
•
•
•• •
•
••
• •
•
•
•
•
• •
• •
• •
•
•
•
• •
• •
• •
• •
•
•
• •
•
• •
•
••
0.2
0.4
0.6
0.8
1
1.2
0.2
0.4
0.6
0.8
1
1.2
K
sK
i• •
• •
•
• •
• •
• • •
•
•
•
•
• •
• •
•
• •
• •
•
•
• • •
•
• •
•
•
•
• •
• •
•
• •
•
• •
•
• •
• •
• •
•
• •
• •
• • •
• •
0
0.1
0.2
0.3
0.4
K
ar = 0.33
p = 0.0081
Discussion
The variation in the rate of evolution in the mammalian genome has mostly been studied using exons. However, introns should be important in this type of analyses, not only because they extend over a large part of the genome, but also because they allow us to exclude biases that may occur with the exclusive use of exons. Recently developed methods that can extract phylogenetic information from divergent align-ments [15] makes the use of introns in the analysis of muta-tional variation possible even with divergent species like mouse and human. In the present work, it has been shown that introns and exons have correlated evolutionary rates (Figures 3,4, Table 1). Introns and exons, unlike synony-mous and nonsynonysynony-mous positions, are physically sepa-rated, so it is difficult to envisage a mechanistic coupling of mutations between them. Furthermore, the evolutionary forces that operate on exons and introns are of a very differ-ent nature because of their completely differdiffer-ent function, which makes it unlikely that a common selection constraint can affect exons and introns simultaneously. In addition, selection mechanisms that can act in neighboring genomic segments with a low recombination rate are probably not acting across long evolutionary time scales such as those that separate primates and rodents [24]. Thus, the most likely explanation for the correlation between the rates of evolu-tion of exons and introns is the existence of local nonrandom fluctuations in mutation rates. A certain amount of selection is probably maintaining some conserved intron regions (as well as, more strongly, nonsynonymous sites), but if there is
a variable underlying mutation rate, the local rates would simultaneously affect all introns and exons in a gene (mostly at those positions that can vary freely), thus providing a common explanation for the correlation between rates at synonymous and nonsynonymous positions in exons and for the correlation between exon and intron rates. The fact that the correlation coefficients are similar for whole genes and for individual introns and exons indicates that the under-lying mutation rate bands extend from small to larger genomic regions. This local variation could be generated because some chromosomal regions are more prone to DNA damage than others or because DNA repair differs in effi-ciency in different chromosomal locations (see [10] for a more extensive discussion). With the availability of enough number of mouse and human genes with known chromo-some positions it will be possible to analyze whether neigh-boring genes show similar mutation rates in their introns, as previously studied with synonymous and nonsynonymous rates [10-12]. In addition, the analysis of a larger number of genes will also allow us to study the relationship of muta-tional bands with other types of banding pattern, including bands of differential gene expression and regulation [25,26], and bands of different GC composition or isochores [27,28].
Materials and methods
The data setA previously compiled data set of 77 pairs of orthologous mouse and human genes [16] was used. In this data set, genes were selected from database entries with clearly defined exon boundaries, and an extensive check for orthol-ogy was carried out. Of these genes, 14 were not used here for the following reasons. The Ftp-3and junBgenes did not have introns. ADA, C2Fand Igf2had internal stop codons. In the genes coding for --casein, coagulation factor VII, H2-Ma and JAK3, the number of exons and introns were not equivalent in mouse and human. H2-Mb1 and H2-Mb2 in mouse were almost identical, products of a recent gene duplication, and only the first one was used. The protamine genes Prm1and Prm2have a very small coding region that mainly codes for repetitive basic amino acids. Finally, the genes coding for interleukin 6 and Tnp2 had extreme values for Ka(and Tnp2also for Ks). However, the inclusion in the correlation analyses of the last five mentioned genes - where the distances could be measured - did not affect the results.
Concatenated exon alignments
The concatenated exon sequences were aligned at the amino-acid level using the program ClustalW 1.81 [29] with default parameters. Gaps were then introduced in the nucleotide sequence according to the amino-acid alignment. No problematic regions were found in these alignments. (When alignments were made at the nucleotide level, differ-ences in distance estimations were negligible.) The number of substitutions per synonymous (Ks) and nonsynonymous (Ka) site (synonymous and nonsynonymous distances,
[image:5.609.54.299.85.312.2]comment reviews reports deposited research interactions information refereed research Figure 4
Correlation of maximum-likelihood distances measured from all positions of 289 individual exon alignments (Ke) and distances from alignments of the corresponding upstream introns (Ki). Only exon-intron pairs where the alignments of both are greater than 100 positions were used.
• • • • • • • • • • • • • • • • • • • • • • • • • • • • • • • • • • • • • • • • • • • • • • • • • • • • • • • • • • • • • • • •• • • • • • • • • • • • • • • • • • • • • • • • • • • • • • • • • • • • • • • • • • • •• • • • • • • • •• • • • • • • • • • • • • • • • • • • • • • •• • • • • • • • • • • • • • • • • • • • • • • • • • •• • • • • • • • • • • • • • • • • • • • • •• • • • • • • • • • • • • • • • • • • • • • • • • • • • • • • • • • • • • • • • • • • • • • • • • • • • • • • • • • • • • • • • • • • • • • • • • • • • • • • • • • • • • • • • • • • • • • • • • • • •
0.2
0.6
1
1.4
K
ir = 0.30
p < 0.0001
respectively, easily convertible to evolutionary rates by dividing by the human-mouse divergence time) were esti-mated from the exon alignments by maximum likelihood using a codon-based model of evolution [30] with the Codeml program of the PAML 3.0 package [31]. Equilibrium codon frequencies of the model were either estimated from the three codon positions (CodonFreq = 2) or used as free parameters (CodonFreq = 3). In addition, Kaand Ks were also estimated by the Nei-Gojobori method [32] imple-mented in the same package. Consequently, three different estimates for both Kaand Kswere obtained for every gene.
Concatenated intron alignments
All introns were first treated with the RepeatMasker program [33] to remove rodent or primate interspersed repeats, as necessary. Individual introns were then aligned using the Needleman-Wunsch algorithm [34] implemented in the Gap program of the GCG package, version 10.1 (Genetics Com-puter Group, Madison, WI), using three different sets of para-meters: GOP = 50 and GEP = 3 (defaults); GOP = 35 and GEP = 2; and GOP = 20 and GEP = 2. Under all conditions, most intron alignments showed many problematic regions as a
result of the presence of large gaps and some regions with very low similarity. Therefore, the program Gblocks 0.74b [15,35] was used to extract the conserved parts of the intron alignments. Two different sets of parameters with two differ-ent degrees of stringency in the selection were additionally used in Gblocks, either the default ones or with ‘maximum number of contiguous nonconserved positions’ = 4. Thus, for every intron, six different alignments were obtained. All selected segments of all introns of each gene were then catenated. The distance in substitutions per site in each con-catenated intron alignment (Ki) was estimated by maximum likelihood with PAUP [36] using the HKY model of evolution [37]. This model, like the codon-based model used to calcu-late Kaand Ks, takes differences in transition/transversion
ratio and nucleotide composition into account. Other methods of distance estimation produced similar results, with much less variability than the variability introduced by the different alignment and selection methods.
[image:6.609.53.557.119.413.2]Thus, for every gene, three different estimations of Ksand Ka for the exons, and six different estimations of genetic dis-tances in the conserved intron segments, Ki, were obtained. Table 1
Correlation of distances measured in concatenated introns and exons of human and mouse orthologous genes
Ki- Kscorrelation Ki- Kacorrelation
Exon distance Intron alignment/ Correlation Significance Correlation Significance measurement* selection method† coefficient (r) probability (p) coefficient (r) probability (p)
ML (CF = 2) Gap 1, Gblocks 1 0.34 0.0057 0.33 0.0081
ML (CF = 2) Gap 1, Gblocks 2 0.32 0.0111 0.33 0.0079
ML (CF = 2) Gap 2, Gblocks 1 0.35 0.0045 0.32 0.0108
ML (CF = 2) Gap 2, Gblocks 2 0.33 0.0075 0.33 0.0089
ML (CF = 2) Gap 3, Gblocks 1 0.32 0.0105 0.31 0.0124
ML (CF = 2) Gap 3, Gblocks 2 0.30 0.0153 0.30 0.0165
ML (CF = 3) Gap 1, Gblocks 1 0.35 0.0044 0.34 0.0061
ML (CF = 3) Gap 1, Gblocks 2 0.32 0.0108 0.34 0.0061
ML (CF = 3) Gap 2, Gblocks 1 0.35 0.0047 0.32 0.0095
ML (CF = 3) Gap 2, Gblocks 2 0.32 0.0098 0.33 0.0077
ML (CF = 3) Gap 3, Gblocks 1 0.31 0.0121 0.32 0.0112
ML (CF = 3) Gap 3, Gblocks 2 0.29 0.0207 0.31 0.0147
NG Gap 1, Gblocks 1 0.34 0.0068 0.33 0.0082
NG Gap 1, Gblocks 2 0.32 0.0109 0.33 0.0079
NG Gap 2, Gblocks 1 0.35 0.0053 0.32 0.0099
NG Gap 2, Gblocks 2 0.35 0.0052 0.33 0.0082
NG Gap 3, Gblocks 1 0.26 0.0371 0.32 0.0110
NG Gap 3, Gblocks 2 0.29 0.0236 0.30 0.0154
The 18 possible correlations between Kiand Ksor Kawere calculated. All correlations were calculated with the Spear-man rank correlation method, which is less sensitive to out-liers, using the JMP package (SAS Institute, Cary, NC).
Individual intron and exon alignments
In the case of the individual intron alignments, the same alignments described above (before concatenation) were used, with default parameters for Gap and Gblocks. For the individual exons, new alignments were made at the nucleotide level (more convenient because of the presence of many interrupted codons) using Gap with default parame-ters. These alignments were very similar or identical to the ones made at the amino-acid level and only a few manual adjustments were necessary to correct shifted codons. Dis-tances were estimated for both intron and exon alignments by maximum likelihood with the HKY model of evolution using PAUP. Then the genetic distance for every individual exon was compared to the genetic distance for the intron immediately upstream or downstream. Only exon-intron pairs where both alignments had more than 100 positions were considered.
References
1. Koop BF: Human and rodent DNA sequence comparisons: a mosaic model of genomic evolution. Trends Genet 1995, 11:367-371.
2. Wolfe KH, Sharp PM: Mammalian gene evolution: nucleotide sequence divergence between mouse and rat.J Mol Evol 1993, 37:441-456.
3. Mouchiroud D, Gautier C, Bernardi G: Frequencies of synony-mous substitutions in mammals are gene-specific and corre-lated with frequencies of nonsynonymous substitutions. J Mol Evol 1995, 40:107-113.
4. Smith NG, Hurst LD: The effect of tandem substitutions on the correlation between synonymous and nonsynonymous rates in rodents.Genetics 1999, 153:1395-1402.
5. Ohta T, Ina Y: Variation in synonymous substitution rates among mammalian genes and the correlation between syn-onymous and nonsynsyn-onymous divergences. J Mol Evol 1995, 41:717-720.
6. Makalowski W, Boguski MS: Synonymous and nonsynonymous substitution distances are correlated in mouse and rat genes. J Mol Evol 1998, 47:119-121.
7. Urrutia AO, Hurst LD: Codon usage bias covaries with expres-sion breadth and the rate of synonymous evolution in humans, but this is not evidence for selection.Genetics 2001, 159:1191-1199.
8. Alvarez-Valin F, Jabbari K, Bernardi G: Synonymous and nonsyn-onymous substitutions in mammalian genes: intragenic cor-relations. J Mol Evol 1998, 46:37-44.
9. Akashi H: Synonymous codon usage in Drosophila melanogaster: natural selection and translational accuracy. Genetics 1994, 136:927-935.
10. Matassi G, Sharp PM, Gautier C: Chromosomal location effects on gene sequence evolution in mammals. Curr Biol 1999, 9:786-791.
11. Castresana J: Genes on human chromosome 19 show extreme divergence from the mouse orthologues and a high GC content.Nucleic Acids Res2002, 30:1751-1756.
12. Williams EJ, Hurst LD: The proteins of linked genes evolve at similar rates. Nature 2000, 407:900-903.
13. Venter JC, Adams MD, Myers EW, Li PW, Mural RJ, Sutton GG, Smith HO, Yandell M, Evans CA, Holt RA, et al.: The sequence of the human genome. Science 2001, 291:1304-1351.
14. Lander ES, Linton LM, Birren B, Nusbaum C, Zody MC, Baldwin J, Devon K, Dewar K, Doyle M, FitzHugh W, et al.: Initial sequencing and analysis of the human genome.Nature 2001, 409:860-921.
15. Castresana J: Selection of conserved blocks from multiple alignments for their use in phylogenetic analysis.Mol Biol Evol 2000, 17:540-552.
16. Jareborg N, Birney E, Durbin R: Comparative analysis of non-coding regions of 77 orthologous mouse and human gene pairs.Genome Res 1999, 9:815-824.
17. Makalowski W, Boguski MS: Evolutionary parameters of the transcribed mammalian genome: an analysis of 2,820 orthologous rodent and human sequences. Proc Natl Acad Sci USA 1998, 95:9407-9412.
18. Graur D:Amino acid composition and the evolutionary rates of protein-coding genes.J Mol Evol 1985, 22:53-62.
19. Li WH, Wu CI, Luo CC: A new method for estimating synony-mous and nonsynonysynony-mous rates of nucleotide substitution considering the relative likelihood of nucleotide and codon changes.Mol Biol Evol 1985, 2:150-174.
20. Chen FC, Li WH: Genomic divergences between humans and other hominoids and the effective population size of the common ancestor of humans and chimpanzees. Am J Hum Genet 2001, 68:444-456.
21. Graur D, Li WH: Fundamentals of Molecular Evolution, 2nd Edition. Sunderland, MA: Sinauer; 2000.
22. Hughes AL, Yeager M: Comparative evolutionary rates of introns and exons in murine rodents. J Mol Evol 1998, 46:497.
23. Smith NG, Hurst LD: Sensitivity of patterns of molecular evo-lution to alterations in methodology: a critique of Hughes and Yeager.J Mol Evol 1998, 47:493-500.
24. Charlesworth D, Charlesworth B: Sequence variation: looking for effects of genetic linkage. Curr Biol 1998, 8:R658-R661. 25. Cremer T, Cremer C: Chromosome territories, nuclear
archi-tecture and gene regulation in mammalian cells. Nat Rev Genet 2001, 2:292-301.
26. Caron H, van Schaik B, van der Mee M, Baas F, Riggins G, van Sluis P, Hermus MC, van Asperen R, Boon K, Voute PA, et al.: The human transcriptome map: clustering of highly expressed genes in chromosomal domains.Science 2001, 291:1289-1292.
27. Bernardi G: Isochores and the evolutionary genomics of vertebrates.Gene 2000, 241:3-17.
28. Bernardi G: The compositional evolution of vertebrate genomes.Gene 2000, 259:31-43.
29. Thompson JD, Higgins DG, Gibson TJ: CLUSTAL W: improving the sensitivity of progressive multiple sequence alignment through sequence weighting, position-specific gap penalties and weight matrix choice. Nucleic Acids Res 1994, 22:4673-4680. 30. Goldman N, Yang Z: A codon-based model of nucleotide
sub-stitution for protein-coding DNA sequences. Mol Biol Evol 1994, 11:725-736.
31. Yang Z: Phylogenetic Analysis by Maximum Likelihood (PAML), Version 3.0.London: University College; 2000.
32. Nei M, Gojobori T: Simple methods for estimating the numbers of synonymous and nonsynonymous nucleotide substitutions.Mol Biol Evol 1986, 3:418-426.
33. RepeatMasker
[http://repeatmasker.genome.washington.edu.]
34. Needleman SB, Wunsch CD: A general method applicable to the search for similarities in the amino acid sequence of two proteins. J Mol Biol 1970, 48:443-453.
35. Gblocks [http://www.embl-heidelberg.de/~castresa/Gblocks/ Gblocks.html]
36. Swofford DL: PAUP*: Phylogenetic Analysis Using Parsimony (*and Other Methods). Version 4. Sunderland, MA: Sinauer Associates; 1998. 37. Hasegawa M, Kishino H, Yano T: Dating of the human-ape
split-ting by a molecular clock of mitochondrial DNA. J Mol Evol 1985, 22:160-174.
comment
reviews
reports
deposited research
interactions
information